 Open Access Article
Creative Commons Attribution 3.0 Unported Licence
Fabrication of single Pt@Au nanowire electrodes for monitoring hydrogen peroxide released from living cells†
Yong Liu,
Yaoyao Zhang,
Hongmei Hua and
Yongxin Li *
*
Anhui Key Laboratory of Chemo/Biosensing, College of Chemistry and Materials Science, Anhui Normal University, Wuhu, 241000, P. R. China. E-mail: yongli@mail.ahnu.edu.cn; Fax: +86-553-386-9303; Tel: +86-553-386-9302
First published on 15th September 2017
Abstract
Single platinum covered Au nanowire electrodes (Pt@AuNWEs) were fabricated by a Cu under-potential deposition (UPD)/Pt redox replacement technique using a single Au nanowire as a template, and were characterized by transmission electron microscopy (TEM), electrochemical method and finite-element simulation. Electrochemical experiments showed that a steady-state current could be achieved for common redox species, such as ferrocene (Fc), ferrocenemethanol (FcCH2OH), K3Fe(CN)6 and Ru(NH3)6Cl3. The prepared single Pt@AuNWEs exhibited unusual electrocatalytic activity towards the reduction of H2O2, and were used to fabricate a nanosensor for the detection of H2O2 with good stability and high selectivity. The as-prepared nanosensor was applied to monitor H2O2 released from living cells stimulated by ascorbic acid with a satisfactory performance.
1 Introduction
Reactive oxygen and nitrogen species (ROS, RNS) released from cells under high metabolism conditions play an important role in some pathogenic conditions, such as cancer development, heart failure and neurodegeneration.1,2 To identify the changes of ROS/RNS concentrations, such as hydrogen peroxide, which is one of the important ROS generated during the oxidative burst process, several novel electrochemical sensors have been developed.3–8 Unfortunately, most of the previous works for monitoring hydrogen peroxide released from cells were based on macro or micro-size electrodes. This leads to limitations in detecting the release of intracellular fluid due to the large size of the probe.Owing to their high mass-transport rate, low RC constants and the ability for measurements in highly resistive solutions, single nanoelectrodes have been widely used in fundamental electrochemistry,9–14 scanning electrochemical microscopy (SECM),15–18 neurobiology and single cell research.5,19–21 Recently, single Pt disk nanoelectrodes were used to monitoring ROS/RNS release in cultured human breast cells,22 but Mirkin et al. have pointed out that the polished Pt nanoelectrodes are not suitable for ROS/RNS sensing due to Pt passivation problem.5 To solve this issue, Mirkin and Amatore have developed a methodology for ROS/RNS sensing by depositing Pt black inside an etched nanocavity under the control of atomic force microscope.5 Schuhmann et al. have developed a Prussian blue modified carbon nanoelectrode to detect hydrogen peroxide.23 Compared to Pt nanoelectrodes, Au nanoelectrodes have wider applications in bio-analysis, and Au nanodisk electrodes have been used to analyze bio-molecules.11,24 However, the detection sensitivity may be limited by the tiny surface area of Au nanodisk electrodes though the nanoelectrodes could be used for real-time analysis in living bio-system. Therefore, development of Au-based nanoelectrodes with relative larger surface area and ultra-small size is urgently important for real-time monitoring analytes in living system.
In this work, we have developed a unique methodology to fabricate single Pt covered Au nanowire electrodes (Pt@AuNWEs) by etching single Au nanodisk electrodes and a Cu under-potential deposition (UPD)/Pt redox replacement technique.25,26 Scheme 1 shows the process of the fabrication of single Pt@AuNWE and the reduction of hydrogen peroxide released from living cells under the stimulation of ascorbic acid. Transmission Electron Microscopy (TEM), electrochemical method and finite-element simulation were used to characterize the prepared single Pt@AuNWEs. The as-prepared single Pt@AuNWEs have demonstrated unusual electrocatalytic activity towards the reduction of H2O2, which have been applied to fabricate H2O2 sensor with high sensitivity, selectivity and stability. This hydrogen peroxide sensor has been used to monitor H2O2 released from living cells stimulated with ascorbic acid (AA) with satisfactory performance.
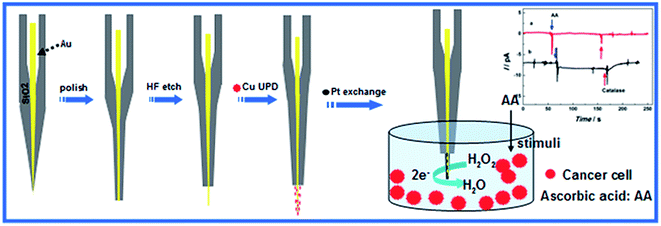 | ||
| Scheme 1 Schematic diagram showing the modified etch and copper underpotential deposition (UPD) redox replacement process for the preparation of Pt@Au nanowire electrode. | ||
2 Experimental section
2.1 Materials and reagents
Potassium ferricyanide (K3Fe(CN)6, AcrosOrganics), hexaammineruthenium(III) chloride (Ru(NH)3)6Cl3, Shanghai Chemical Co., Shanghai, China, ferrocene (Fc, Fluka), ferrocenemethanol (FcCH2OH, Aldrich), potassium chloride (KCl, Shanghai Chemical Co., Shanghai, China), acetonitrile (ACN, Shanghai Chemical Co., Shanghai, China), tetra-n-butylammonium hexafluorophosphate (TBAPF6, Aldrich), ascorbic acid (AA, Shanghai Chemical Co., Shanghai, China), uric acid (UA, Shanghai Chemical Co., Shanghai, China) and catalase (Shanghai Chemical Co., Shanghai, China) were of reagent grade or better, and used without further purification. Organic and aqueous solutions were prepared from acetonitrile and Milli-Q water, respectively. K2PtCl4·6H2O (Pt% > 40%), Au microwires (99.95%, hard, r.d. = 25 μm) and Cu(NO3)2 were purchased from Alfa Aesar. Borosilicate glass capillaries (i.d. ∼0.64 mm, o.d. ∼1.0 mm) were purchased from Sutter Instrument Co. (Novato, CA). Fine grit sandpapers with 400, 600, and 800 grits and alumina polishing powders with different particle sizes of 1.0, 0.3, and 0.05 mm were obtained from Buehler (Lake Bluff, IL). A fresh solution of H2O2 was prepared daily.2.2 Instruments
A laser-assisted puller (P-2000 mode, Sutter Instrument Co., Novato, CA) was used for the fabrication of Au nanowires. Electrochemical experiments were carried out using an electrochemical workstation controlled by computer (CHI 760 mode, Shanghai, China). A Ag/AgCl electrode (CHI instrument, Shanghai, China) was used as the reference electrode and a platinum wire as auxiliary electrode.TEM images were performed on a Tecnai G2.F20 (FEI, Japan) microscope.
2.3 Fabrication of single Pt@AuNWEs
Before preparation of single AuNWEs and Pt@AuNWEs, single Au nanodisk electrodes were obtained as we previously reported11 and the radii of the single nanodisk electrodes can be calculated.27 Single Pt@AuNWEs could be fabricated through the following two steps: first, single Au nanodisk electrode was immersed into HF (1![[thin space (1/6-em)]](https://www.rsc.org/images/entities/char_2009.gif) :
:![[thin space (1/6-em)]](https://www.rsc.org/images/entities/char_2009.gif) 4, v/v) solution for etching SiO2 layer and single Au nanowire could be exposed. Then, a copper underpotential deposition (UPD) redox replacement reaction was carried out on the surface of single Au nanowire28,29 through holding the potential at ∼0.20 V in a 0.1 M HClO4 + 1.0 mM Cu(NO3) 2 solution for 2 min.26,29 After that, the electrode was immersed in a freshly prepared nitrogen-purged solution of 0.10 M H2SO4 containing 5.0 mM K2PtCl4 for ∼15 min to make sure that the redox replacement between UPD Cu and Pt finished completely, and uniform Pt@Au nanowires can be obtained. The length of the single Pt@AuNWEs can be estimated from steady-state limiting current obtained from the cyclic voltammetry (CV) of redox species13,30 and also can be obtained from finite simulation results.31
4, v/v) solution for etching SiO2 layer and single Au nanowire could be exposed. Then, a copper underpotential deposition (UPD) redox replacement reaction was carried out on the surface of single Au nanowire28,29 through holding the potential at ∼0.20 V in a 0.1 M HClO4 + 1.0 mM Cu(NO3) 2 solution for 2 min.26,29 After that, the electrode was immersed in a freshly prepared nitrogen-purged solution of 0.10 M H2SO4 containing 5.0 mM K2PtCl4 for ∼15 min to make sure that the redox replacement between UPD Cu and Pt finished completely, and uniform Pt@Au nanowires can be obtained. The length of the single Pt@AuNWEs can be estimated from steady-state limiting current obtained from the cyclic voltammetry (CV) of redox species13,30 and also can be obtained from finite simulation results.31
2.4 Monitoring H2O2 released from MCF-7 cells
Human breast cancer cells MCF-7 provided by Wannan Medical University were used as target molecules to investigate the real applications of proposed nanosensors. MCF-7 cells were maintained in Dulbecco's modified Eagle medium (supplemented with 100 U ml−1 penicillin and 10% fetal bovine serum) and incubated at 37 °C in a humidified incubator (5% CO2 and 95% air).8 MCF-7 cells were digested with 0.25% pancreatin for 120 s and then centrifuged for 10 min (1000 rpm) and washed with phosphate buffer for three times. The obtained cells were re-suspended into 5 ml PBS. When the current reached to a steady state, ascorbic acid (AA) and catalase (500 U ml−1) was injected to the cells solution, which could motivate H2O2 generation and reduce H2O2 selectively. In control experiment, AA and catalase were added into the solution without cells at the same conditions.3 Results and discussion
3.1 Characterization and electrochemistry of single AuNWEs
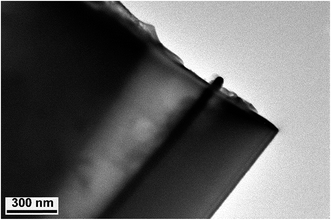
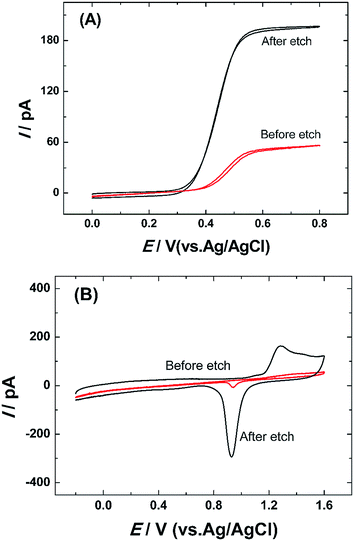
The structure and morphology of single AuNWEs were provided through TEM image (Fig. 1). From Fig. 1, a single Au nanowire with the radius of ∼30 nm and the length of ∼100 nm could be observed clearly, which was sealed with glassy sheath and the surface between SiO2 and single Au wire is smooth, and no obvious gap can be observed.Steady-state voltammetry in a 5 mM Fc solution was used to characterize the Au nano-disk electrodes before and after HF etching process, as shown in Fig. 2A. Assuming a single Au nanoelectrode with disk-shaped geometry embodied in an infinitely large insulation material of SiO2, the radius of Au disk nanoelectrode can be calculated from steady-state limiting current:14,27
| id = 4nFDCba | (1) |
 | (2) |
 , where v is the potential scan rate.
The cyclic voltammetric scan in H2SO4 solution was always applied to characterize metal electrodes, especially for gold and platinum electrodes through their characteristic peaks for the formation of surface oxides and their subsequent reduction in acid electrolytes.25,26,29 The single Au nano-disk electrode before and after HF etching was scanned in a 0.5 M H2SO4 solution (shown in Fig. 2B). From Fig. 2B, it can be obtained that all the nanoelectrodes showed the characteristic peak of gold in 0.5 M H2SO4 neither the electrode is etched or not. During the forward sweep, it appeared the oxidation peak at around 1.4 V. And the reduction peak was occurred at about 0.95 V when the potential swept to the opposite direction. The reduction peak of Au nanoelectrode after etching has a slightly shift towards negative direction. It is consistent with other literature reports.11,26
The length of the Au nanowire electrode can be estimated by the COMSOL simulation software (Fig. S1 in ESI†) through the comparison of CVs from experimental result and simulation data.32 As shown in Fig. S2 (ESI†), the length of single AuNWE is ∼71 nm approximately.
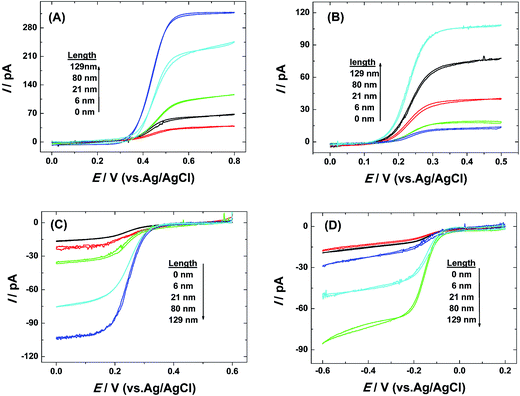
The voltammetric responses using single AuNWEs with different lengths (0 nm, 6 nm, 21 nm, 80 nm and 129 nm) were recorded using four different redox species, such as Fc, FcCH2OH, K3Fe(CN)6, and Ru(NH3)6Cl3, and the results are given in Fig. 3. From Fig. 3, it can be observed that all the voltammograms collected from 4 different redox species were well-defined sigmoidal shape with low hysteresis phenomena between the forward and backward sweeps, indicating that the prepared single AuNWEs were prepared very well and had good steady-state responses.
3.2 Fabrication and characterization of single Pt@Au nanowire electrodes
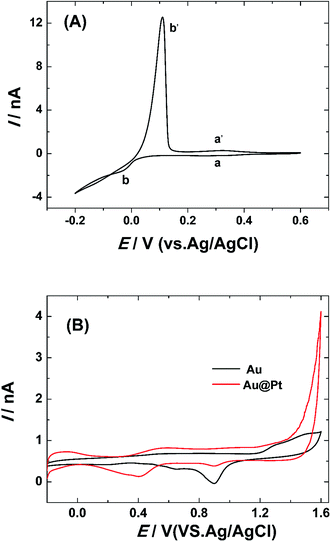
Copper under-potential deposition/Pt redox replacement reaction has been taken to fabricate single Pt@AuNWEs:25,26,29 a monolayer of copper was deposited on the surface of single AuNWE through holding the potential at ∼0.2 V for 2 min in a 0.1 M HClO4 + 1.0 mM Cu(NO3)2 solution. After that, the copper covered single AuNWE was put into a 0.1 M H2SO4 + 5.0 M K2PtCl4 solution for 15 min, and the UPD copper could be replaced by Pt completely. The copper deposition and sweep process on the surface of single AuNWE could be observed by a typical cyclic voltammogram in a 0.1 M HClO4 + 1.0 mM Cu(NO3)2 solution shown in Fig. 4A, and the two pairs of cathodic/anodic peaks correspond to the formation/dissolution of UPD copper (a and a′) and bulk copper (b and b′).The obtained nanowire electrode was put into a 0.5 M H2SO4 solution for cyclic voltammetric scan to confirm the formation of Pt on the surface of single AuNWE and the cyclic voltammogram was provided in Fig. 4B. From the typical hydrogen desorption–adsorption peaks at ∼0.1–−0.2 V and the typical reduction peak of Pt oxide at ∼0.42 V (Fig. 4B, red curve), it could be obtained that UPD copper was replaced by Pt and a single Pt@AuNWE was fabricated successfully.25,26,29 Moreover, a small reduction peak at ∼0.91 V could be found in the cyclic voltammogram by use of single Pt@AuNWE (Fig. 4B, red curve), indicating that few Au sites still exposed in the solution and Pt shell was discontinued on the surface of single AuNWE.33,34 For comparison, the CV of single AuNWE before UPD copper deposition/Pt replacement in a 0.5 M H2SO4 solution was also provided (Fig. 4B, black curve), and the typical oxidation peaks at ∼1.4 V and reduction peak at ∼0.95 V proved the bare AuNWE existing in the solution.
3.3 Electrocatalytic reduction of hydrogen peroxide at single Pt@AuNWEs
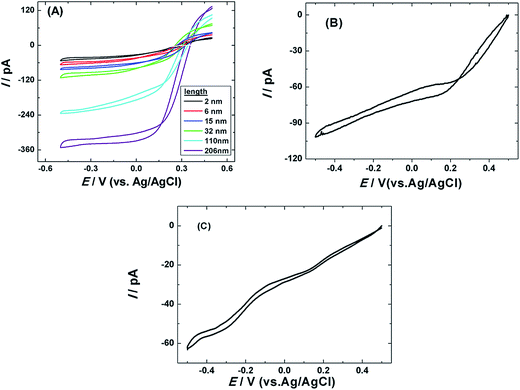
The electrocatalytic activity of prepared single Pt@AuNWEs towards the reduction of H2O2 was investigated by cyclic voltammetry. Fig. 5A shows the typical CVs of 0.5 mM H2O2 in a 10 mM PBS (pH = 7.4) by use of single Pt@AuNWEs with different lengths. From Fig. 5A, it could be observed that the cyclic voltammograms of H2O2 reduction showed well-defined steady state current with obvious steep gradient. However, the CVs collected from single Pt nanowire electrode (Fig. 5B) and single Au nanowire electrode (Fig. 5C) did not show steady state current, and the shape was poor without gradient. Moreover, the output current obtained from single Pt@AuNWE is much larger than that from single Pt nanowire electrode and single Au nanowire electrode when the length of all of the electrodes is ∼200 nm. These results demonstrate that the H2O2 electro-reduction using single Pt@AUNWEs has a diffusion-controlled process27 and faster electron transfer rate, and single Pt@AuNWEs can be used to fabricate nanosensor for H2O2 sensing.For amperometric detection of H2O2, the reduction potential is key parameter to achieve high sensitivity.3 Fig. S3 (ESI†) shows the amperometric responses of the single Pt@AuNWE to the successive additions of 4 μM H2O2 into 10 mM the stirring PBS (pH = 7.4) at the applied potential of 0.1 V (black curve), 0.15 V (red curve), 0.25 V (green curve), respectively. From Fig. S3 (ESI†), it could be obtained that the amperometric response using single Pt@AuNWE at the applied potential of 0.25 V had a gradual slope, but steep slopes could be found at the applied potential of 0.1 V and 0.15 V, indicating H2O2 reduction should have high sensitivity and fast response. Although more negative potential should have good sensitivity, the interferences species, such as ascorbic acid and uric acid, would cause big concern for hydrogen peroxide detection. Therefore, 0.10 V was chosen for amperometric detection of H2O2.
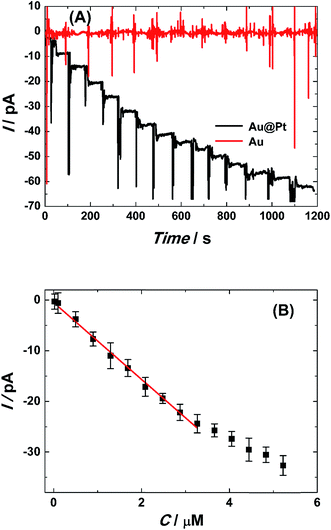
Fig. 6A provides the typical steady-state amperometric response of single Pt@AuNWE (black curve) to successive injection of 4 μM H2O2 into stirring PBS solution at the applied potential of 0.10 V, thus no obvious steady-state current could be found by use of single AuNWE (red curve) at the same test conditions. The single Pt@AuNWE could achieve ∼95% in its steady state current within 5 s, indicating fast electron transfer rate and rapid diffusion of hydrogen peroxide on the surface of the electrode. The linear relationship between the increasing current and the concentration of H2O2 at the range of 0.15–3.2 μM could be obtained (shown in Fig. 6B) according to the amperometric response, and the linear regression equation was I (pA) = −2.444 − 6.184C (μM) (R2 = 0.9942). Based on IUPAC rules,35 the limit of detection (LOD) can be defined as: LOD = 3.29σblank/S, where S is the slope of the linear calibration plot, which indicating the method calibration sensitivity, and σblank is the blank standard deviation. Using the above equation, the LOD of H2O2 could be calculated to be 0.12 μM. Under the optimum conditions, the relative standard deviation (R.S.D.) for nine successive determinations of 2.0 μM H2O2 was 2.27%, indicating the excellent reproducibility of the present system. According to regulations by IUPAC,36 the regression model diagnosis has been considered satisfactory with no lack of fit because the value of Fcalculated (1.74) is lower than Fcritical (3.18) within a 95% confidence interval, indicating that the linearity test was considered acceptable in the concentration range. Although similar results have been obtained from micro/macro electrodes,3,23,25 considering the tiny dimension and faster mass transport rate, the proposed nanosensor has significant advantage for sensing application in living-system.
The stability and selectivity of the prepared single Pt@AuNWE-based nanosensor were also investigated, as shown in Fig. S4 and S5 (ESI†). The stability of the nanoelectrode was tested by amperometric detection in the injection of 10 μM H2O2 periodically at days 1, day 3 and day 5, respectively (Fig. S4, ESI†). The single Pt@AuNWE was put into a 10 mM PBS solution (pH 7.4) for storage after each detection. It can be seen that the decrease of current value is only 2.2% and 2.7% in the three and five days respectively. For the selective study, we investigated the amperometric responses of common interference species co-existing in biological system upon consecutive addition of 10 μM H2O2, 0.5 mM ascorbic acid (1), 0.1 mM dopamine (2), 1.0 mM glucose (3), 1.0 mM uric acid (4), 1.0 mM lysine (5), and 1.0 mM L-cysteine (6) (shown in Fig. S5, ESI†). The results showed that the amperometric current changed greatly after the injection of H2O2, while no obvious amperometric current change could be found after the injections of common interference species, indicating that these species do not interference with the detection of H2O2. Therefore, the good stability, high selectivity and fast response showed that the single Pt@AuNWE-based nanosensor could be utilized for dynamic monitoring hydrogen peroxide, which overcome the Pt passivation problem.
3.4 Monitoring H2O2 released from living cells
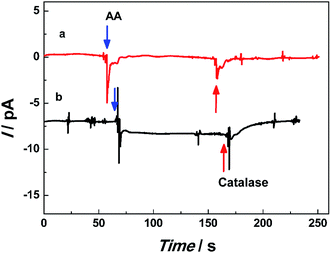
To investigate the application of single Pt@AuNWE for the detection of the dynamic release of hydrogen peroxide from cells, MCF-7 cells were chosen as model cells and ascorbic acid was chosen as stimulator which could induce the generation of H2O2 from cells. Fig. 7 gives the amperometric responses by use of single Pt@AuNWE in a 10 mM PBS solution (pH 7.4) with the presence (black curve) and absence (red curve) of MCF-7 cells at the applied potential of 0.10 V (vs. Ag/AgCl) upon successive addition of 1.0 mM AA and 500 U ml−1 catalase. From the black curve in Fig. 7, it could be observed that the cathodic current was increased sharply after the addition of AA into PBS solution containing MCF-7 cells, which then reached a steady state within several seconds, indicating that the H2O2 was released stably from MCF-7 cells at the stimulation of AA.8 To identify the increased current was from H2O2 released from cells, a 500 U ml−1 catalase was injected into the test solution. It could be found from black curve in Fig. 7 that the steady state current decreased quickly, and almost went back to background line after ∼10 seconds, indicating the released H2O2 was decomposed into water and oxygen at the existing of catalase, and the nanosensor would consume the produced oxygen. Therefore, it could be observed that the cathodic current decreased down to background line for several seconds and the cathodic current is produced from H2O2 released from living cells. Based on the current change from Fig. 7, the concentration of released H2O2 could be calculated as ∼0.15 μM according to the regression equation listed above. For control experiment, no significant current change could be observed when AA and catalase were successively injected into PBS buffer without MCF-7 cells. Although above data were obtained from an aqueous solution, these results demonstrated that the prepared single Pt@AuNWEs could be utilized effectively for real-time monitoring H2O2 released from living cells.4 Conclusions
In summary, we have fabricated single Pt@AuNWEs by Cu UPD/Pt redox replacement technique using single AuNWEs as templates, which shows steady-state current responses to several redox species such as such as ferrocene (Fc), ferrocenemethanol (FcCH2OH), K3Fe(CN)6 and Ru(NH3)6Cl3. The as-prepared single Pt@AuNWEs has been used as a nanosensor for the monitoring H2O2 released from living cells due to its ultra-small size, high selectivity and sensitivity. We believe this nanosensor will offer a new and facile method for real-time monitoring H2O2 or other analytes in living bio-system, and should be potentially applied in physiological and pathological research.Conflicts of interest
There are no conflicts to declare.Acknowledgements
We thank Prof. Bo Zhang (University of Washington) for his useful suggestions and discussion. This work is financially supported by the National Natural Science Foundation of China (No. 21375002; No. 21775003) and the Foundation for Innovation Team of Bioanalytical Chemistry of Anhui Province.References
- G. Waris and H. Ahsan, J. Carcinog., 2006, 5, 14 CrossRef PubMed.
- C. Bogdan, M. Rollinghoff and A. Diefenbach, Curr. Opin. Immunol., 2000, 12, 64–76 CrossRef CAS PubMed.
- C. Xiao, Y.-L. Liu, J.-Q. Xu, S.-W. Lv, S. Guo and W.-H. Huang, Analyst, 2015, 140, 3753–3758 RSC.
- S. Isik and W. Schuhmann, Angew. Chem., Int. Ed., 2006, 45, 7451–7454 CrossRef CAS PubMed.
- Y. Wang, J.-M. Noel, J. Velmurugan, W. Nogala, M. V. Mirkin, C. Lu, M. G. Collignon, F. Lemaitre and C. Amatore, Proc. Natl. Acad. Sci. U. S. A., 2012, 109, 11534–11539 CrossRef CAS PubMed.
- B. Reuillard, S. Gentil, M. Carriere, A. Le Goff and S. Cosnier, Chem. Sci., 2015, 6, 5139–5143 RSC.
- X. Liu, M. Zhang, T. Xiao, J. Hao, R. Li and L. Mao, Anal. Chem., 2016, 88, 7238–7244 CrossRef CAS PubMed.
- W. Qiu, M. Xu, R. Li, X. Liu and M. Zhang, Anal. Chem., 2016, 88, 1117–1122 CrossRef CAS PubMed.
- M. V. Mirkin, T. Sun, Y. Yu and M. Zhou, Acc. Chem. Res., 2016, 49, 2328–2335 CrossRef CAS PubMed.
- Y. Y. T. Sun and M. V. Mirkin, Anal. Chem., 2016, 88, 11758–11766 CrossRef PubMed.
- Y. Zhang, S. Xu, Y. Qian, X. Yang and Y. Li, RSC Adv., 2015, 5, 77248–77254 RSC.
- S. Chen and Y. Liu, Phys. Chem. Chem. Phys., 2014, 16, 635–652 RSC.
- K. Dawson, A. Wahl, R. Murphy and A. O'Riordan, J. Phys. Chem. C, 2012, 116, 14665–14673 CAS.
- Y. Li, D. Bergman and B. Zhang, Anal. Chem., 2009, 81, 5496–5502 CrossRef CAS PubMed.
- Y. Takahashi, A. I. Shevchuk, P. Novak, B. Babakinejad, J. Macpherson, P. R. Unwin, H. Shiku, J. Gorelik, D. Klenerman, Y. E. Korchev and T. Matsue, Proc. Natl. Acad. Sci. U. S. A., 2012, 109, 11540–11545 CrossRef CAS PubMed.
- M. Etienne, E. C. Anderson, S. R. Evans, W. Schuhmann and I. Fritsch, Anal. Chem., 2006, 78, 7317–7324 CrossRef CAS PubMed.
- J. Clausmeyer and W. Schuhmann, TrAC, Trends Anal. Chem., 2016, 79, 46–59 CrossRef CAS.
- T. Sun, Y. Yu, B. J. Zacher and M. V. Mirkin, Angew. Chem., Int. Ed., 2014, 53, 14120–14123 CrossRef CAS PubMed.
- P. Actis, S. Tokar, J. Clausmeyer, B. Babakinejad, S. Mikhaleva, R. Cornut, Y. Takahashi, A. L. Cordoba, P. Novak, A. I. Shevchuck, J. A. Dougan, S. G. Kazarian, P. V. Gorelkin, A. S. Erofeev, I. V. Yaminsky, P. R. Unwin, W. Schuhmann, D. Klenerman, D. A. Rusakov, E. V. Sviderskaya and Y. E. Korchev, ACS Nano, 2014, 8, 875–884 CrossRef CAS PubMed.
- M. Marquitan, J. Clausmeyer, P. Actis, A. L. Cordoba, Y. Korchev, M. D. Mark, S. Herlitze and W. Schuhmann, ChemElectroChem, 2016, 3, 2125–2129 CrossRef CAS.
- Y. Liu, M. Li, F. Zhang, A. Zhu and G. Shi, Anal. Chem., 2015, 87, 5531–5538 CrossRef CAS PubMed.
- P. Sun, F. O. Laforge, T. P. Abeyweera, S. A. Rotenberg, J. Carpino and M. V. Mirkin, Proc. Natl. Acad. Sci. U. S. A., 2008, 105, 443–448 CrossRef CAS PubMed.
- J. Clausmeyer, P. Actis, A. L. Cordoba, Y. Korchev and W. Schuhmann, Electrochem. Commun., 2014, 40, 28–30 CrossRef CAS.
- S. E. Salamifar and R. Y. Lai, Anal. Chem., 2014, 86, 2849–2852 CrossRef CAS PubMed.
- Q. Q. Wu, Y. X. Li, H. Y. Xian, C. D. Xu, L. Wang and Z. B. Chen, Nanotechnology, 2013, 24, 025501 CrossRef PubMed.
- D. Zhan, J. Velmurugan and M. V. Mirkin, J. Am. Chem. Soc., 2009, 131, 14756–14760 CrossRef CAS PubMed.
- A. J. Bard and L. R. Faulkner, Electrochemical Methods: Fundamentals and Applications, John Wiley and Sons Publishers, 2001 Search PubMed.
- Y. X. Li, Q. F. Lu, S. N. Wu, L. Wang and X. M. Shi, Biosens. Bioelectron., 2013, 41, 576–581 CrossRef CAS PubMed.
- Y. Li, J. T. Cox and B. Zhang, J. Am. Chem. Soc., 2010, 132, 3047–3054 CrossRef CAS PubMed.
- S. J. Percival and B. Zhang, J. Phys. Chem. C, 2013, 117, 13928–13935 CAS.
- Y. X. Li, Q. Q. Wu, S. F. Jiao, C. D. Xu and L. Wang, Anal. Chem., 2013, 85, 4135–4140 CrossRef CAS PubMed.
- Y. Zhang, S. Xu, X. Xiao, Y. Liu, Y. Qian and Y. Li, Chem. Commun., 2017, 53, 2850–2853 RSC.
- N. Kristian, Y. Yan and X. Wang, Chem. Commun., 2008, 353–355 RSC.
- X. Cui, S. Wu, S. Jungwirth, Z. Chen, Z. Wang, L. Wang and Y. Li, Nanotechnology, 2013, 24, 295402 CrossRef PubMed.
- L. A. Currie, Pure Appl. Chem., 1995, 67, 1699–1723 CrossRef CAS.
- K. Danzer and L. A. Currie, Pure Appl. Chem., 1998, 70, 993–1014 CrossRef CAS.
Footnote |
| † Electronic supplementary information (ESI) available. See DOI: 10.1039/c7ra08085a |
| This journal is © The Royal Society of Chemistry 2017 |

