 Open Access Article
Creative Commons Attribution 3.0 Unported Licence
Magnetofluidic micromixer based on a complex rotating magnetic field
Ahmed Munaza,
Harshad Kamblea,
Muhammad J. A. Shiddiky ab and
Nam-Trung Nguyen
 *a
*a
aQueensland Micro- and Nanotechnology Centre, Griffith University, Brisbane, QLD 4111, Australia. E-mail: na-trung.nguyen@griffith.edu.au
bSchool of Natural Sciences, Griffith University, Nathan Campus, QLD 4111, Australia
First published on 13th November 2017
Abstract
Rapid and efficient mixing of particles and fluids in a microfluidic system is of great interest for chemical and biochemical analysis. The present paper investigates magnetofluidic mixing induced by a rotating magnetic field from a number of permanent magnets. Numerical simulation shows the complex magnetic field in the mixing chamber. Simulated particle tracing predicts the trajectories of diamagnetic particles in a paramagnetic medium for the different stationary positions of the magnets. The experimentally obtained trajectories show negative magnetophoresis similar to that predicted by the simulation. However, the static configuration of the magnets cannot achieve mixing of the diamagnetic particles. We demonstrated that a rotating magnetic field could yield up to 86% mixing efficiency at a flow rate of 60 μL min−1 using a diluted ferrofluid of only 1% volume concentration.
1. Introduction
Microfluidics is a powerful tool for handling a small amount of fluid.1,2 One of the ultimate aims of this technology is its implementation in clinical point-of-care applications, where a large number of small samples are evaluated over a short period of time. Mixing is one of the basic sample preparation steps. As the flow is laminar on the microscale and relies on diffusion to mix, a long mixing channel is often required. A number of active and passive methods exist for improving mixing on the microscale.3,4 Active mixing disturbs the main flow with secondary flow generated by an external energy source.5 Among the various external energy sources for active mixing, magnetism has apparent advantages such as contactless manipulation, biocompatibility, simple and robust design.6,7 Using a magnet and magnetic particles, fast mixing can be achieved in a microfluidic device. Yuen et al. utilized two magnetic stirring bars inside a mixing chamber.8 The sample was delivered from one reaction chamber to another, while the bar was rotated by the external field of a magnetic stirrer. Lu and Ryu et al. integrated micro stirrers inside the mixing chambers.9,10 The stirrers were actuated by a rotating magnetic field. Another magnetofluidic approach is injecting magnetic particles into the chip and manipulate the flows from an external magnetic source. For instance, Biswal et al. injected paramagnetic microparticles into a microfluidic device to form linear chains and used two pairs of rotating electromagnet for active mixing of two fluids.11 Similarly, Lee et al. demonstrated an active mixing method by aligning ferromagnetic particles (ϕ = 4 μm) to form rod-like structures under the influence of a moving magnetic field generated by an electric stirrer.12 Furthermore, Bau et al. generated stretching and folding of the fluids by incorporating an electric and magnetic field into a micromixer.13 Yi et al. fabricated a device with an electrode at the sidewall and copper wires at the surface of the chamber. Chaotic mixing was induced by developing a potential difference between the wire electrode to the side wall electrode under a uniform magnetic field.14 All above methods have their advantages, but integrating a number of micromagnets or electrode pairs into each of the small device consumes a large amount of time and labors. Furthermore, biocompatibility is a major hurdle for implementation of these techniques in clinical applications.Magnetophoresis is a promising phenomenon for active flow manipulation. Considering the limitations of the existing methods, positive and negative magnetophoresis as a potential alternative have been explored for the separation, concentration, and transportation of particles.15 Positive magnetophoresis utilizes magnetic beads as a tag to initiate concentration and separation of biological samples. Under an external magnetic field, paramagnetic particles in a diamagnetic medium migrate towards the magnetic field maxima. A number of steps are involved in tagging the beads with the biological sample. The subsequent cleaning steps also considerably increase the process time.16–19 As negative magnetophoresis is a label-free approach, where the carrier fluid has paramagnetic properties, utilizing this effect drastically reduces the processing time. Diamagnetic particles such as cells or fluorescent beads act as magnetic holes in the paramagnetic fluid allowing for precise manipulation.20,21 If an external magnetic field is applied, the paramagnetic fluid particles move towards the magnetic field maxima. Larger diamagnetic particles migrate towards the magnetic field minima due to the magnetic susceptibility mismatch with the surrounding medium.22 Due to these advantages, negative magnetophoresis has been increasingly utilized for the purpose of cell separation, transport, and concentration. The key factors affecting negative magnetophoresis are the physical properties such as flow velocity, volume fraction of the magnetic material in ferrofluid, diameter of the magnetic nanoparticle, the magnetic field strength, as well as the geometrical parameters such as the size of the magnet and its distance from the fluidic channel.23,24 By tuning these properties, magnetic buoyancy force and hydrodynamic drag force can be optimized. Most of the previous reports considered these key factors.
For example, Zeng et al. used two attracting magnets placed on the top and bottom of a microchannel to concentrate polystyrene particles and live yeast cells in a ferrofluid flow.25 Furthermore, the authors utilized two offset magnets to separate cells and diamagnetic particles in a sheath-free ferrofluid flow.26 Liang et al. demonstrated the efficacy of ferrofluid to trigger negative magnetophoresis for high-throughput particle separation over the diamagnetic medium.27 In another study, Hejazian et al. deflected fluorescent polystyrene particles mixed with ferrofluid solution by externally arranged permanent magnets to transport nonmagnetic samples.28 The authors observed that the variation of the deflection was influenced by the flow rate and the distance of the magnet arrangements. Similarly, Zhu et al. observed negative magnetophoresis in a circular chamber to investigate the migration of diamagnetic particle in a weak uniform magnetic field.29 Zhu et al. exploited the susceptibility variation to separate the non-magnetic particles of different size in ferrofluids under a stationary magnetic field.30 Furthermore, the team successfully separated the mixture of fluorescent polystyrene microparticles and live cells in ferrofluids under a non-uniform magnetic field.31 Zhao et al. used label-free, continuous flow magnetophoresis to separate Hela cells from mouse red blood cells.32 Under an external magnetic field, the large Hela cells were deflected more due to the higher magnetic buoyancy force leading to efficient separation. Pamme et al. demonstrated the continuous separation of magnetic particles of different sizes, and non-magnetic particles based on free-flow magnetophoresis.33 They further extended the concept to biological cells labeled with magnetic nanoparticles.34 Simultaneous separation was possible due to the susceptibility mismatch caused by magnetic loading and size differences. Recently, Zhao et al. used negative magnetophoresis to separate low-concentration cancer cells from undiluted white blood cells with customized ferrofluids.35 The approach reduced the exposure time of the cells to ferrofluid, thus improves the biocompatibility and cell integrity. Furthermore, the team successfully separated circulating tumor cells (CTCs) from the RBC-lysed blood sample mixed with ferrofluid at a high throughput, and a high recovery rate by employing negative magnetophoresis.36
Most of the studies reported in the literature either require special magnetic particles or arrangement of a number of stationary magnets to achieve fluid manipulation.11,12,37 These magnets make the device bulky and increase the manufacturing cost, especially if further on-chip mixing, separation, trapping, and detection of the biochemical samples are required.38–41 In the present study, we address these issues by avoiding direct attachment of the magnets to the chip. The magnets are separately assembled and mounted on a platform. The chip is placed in such a way that the mixing chamber axially aligns with the magnet assembly. The design also offers an optical access for an inverted microscope. In addition, the setup enables the microfluidic chip to be easily inserted and exchanged. The platform can be extended for on-chip separation to perform the complex biochemical analysis.
Furthermore, we demonstrate here a novel approach for an externally mounted moving magnet for mixing. We carried out a detailed numerical simulation with various magnetic fields in a circular chamber. Associated particle trajectories were observed to predict the mixing performance. Experimental trajectories of fluorescent particles subsequently validate the simulation results. Finally, the dynamic behavior of the two fluid streams has been analyzed in terms of the mixing efficiency.
2. Material and methods
2.1. Basic design and working principle
Our microfluidic device contains two inlets, a circular mixing chamber, and outlet ports. The device was designed with CorelDraw (Corel Co., Canada). A commercial CO2 laser system (Trotec/Rayjet 300) was utilized to fabricate the channel mold from a laminated plastic sheet with the thickness of approximately 250 ± 30 μm. The mixing chamber has a diameter of 2 mm. The microchannel has a width of W = 500 μm, depth of D = 250 ± 30 μm and the total length of L = 20 mm. The length is relatively long to adjust the chip with the mounted platform. The laser machined parts were ultrasonicated for 10 minutes to remove any residual particles. A double-sided adhesive tape (Scotch, 3 M) was used to bond a clean glass slide (sizes of 50 × 76 mm) with the channel pattern to form a mould. The glass slide ensured that the replicated pattern is flat enough to achieve proper plasma bonding. Degassed polydimethylsiloxane (PDMS) prepolymer mixed with a crosslinker was then poured into the mould. The PDMS was further degassed for 30 min to remove any air bubbles and kept in an oven at 80 °C for an hour for curing. The cured PDMS replica was peeled off from the mold. The thickness of the PDMS layer was at approximately 3 mm. The inlet and outlet ports were introduced by punching 1.5 mm diameter hole. The replicated PDMS was again cleaned for 10 minutes by ultra-sonication. Finally, the PDMS device was treated with oxygen plasma for 45 seconds and bonded to a clean glass slide. The device was tested for different flow rates with DI water to ensure that the device is free of leakage. Our technique provides an opportunity to redesign and to optimize the device without much delay. Fig. 1 illustrates the schematic diagram of the system under investigation.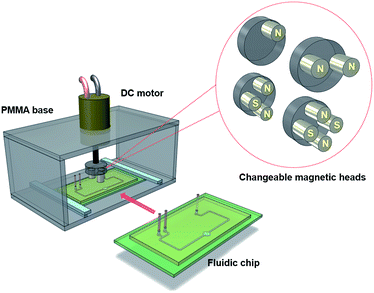 | ||
| Fig. 1 Schematic diagram of the fluidic chip inserted into the mixing system. The magnetic heads can easily be exchanged. | ||
The experiments consisted of two parts. First, particle trajectories caused by negative magnetophoresis were investigated. A water-based ferrofluid (EMG 707, Ferrotec, USA) was diluted to 1% volume concentrations (ϕ = 1% vol.) with DI water. Green fluorescent polyethylene microspheres (1.00 g cm−3, 30 μm, Cospheric, USA) was mixed with the ferrofluid solution. The mixture was then injected by a precision syringe pump (SPM-100, SIMTech Microfluidics Foundry) through a Teflon tube to one of the inlet ports. In this system, the ferrofluid served as the paramagnetic medium. The diamagnetic fluorescent beads created magnetic holes. The experiments were recorded over a period of 1 minute to visualize the trajectories caused by negative magnetophoresis. The video was recorded with a USB camera (Edmund Optics, Germany) at a rate of 30 frames per second through an inverted microscope (Nikon Eclipse TE-100). Associated software (uEye Cockpit) was utilized to save the videos. Initially, a fixed flow rate of 15 μL min−1 was initiated for the observations. Magnetophoresis effect was characterised for four different magnet configurations with one to four magnets.
In the second part, mixing efficiency was determined for the different arrangements. Two fluid samples were injected through the two syringe pumps (SPM-100, SIMTech Microfluidics Foundry). Diluted ferrofluid (ϕ = 1% vol.) with green fluorescent polyethylene microspheres (1.00 g cm−3, 30 μm, Cospheric, USA) and diluted ferrofluid (ϕ = 1% vol.) without fluorescent microparticles were delivered to each of the inlets to evaluate the mixing efficiency. Flow rates ranging from 15–60 μL min−1 were considered with rotational speeds ranging from 25 to 200 rpm. Fig. 2 demonstrates the step by step fabrication of the LOC device with the experimental setup. The associated images depict the channel before and after mixing.
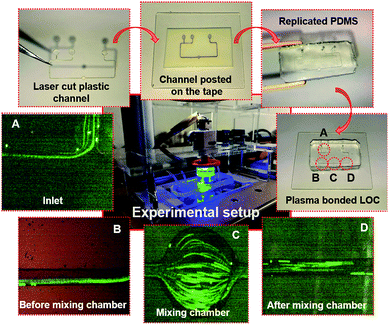 | ||
| Fig. 2 Step by step fabrication process of the LOC device: (A) inlet ports; (B) the channel before mixing; (C) mixing chamber; (D) the channel after mixing. | ||
We utilized the laser machining to fabricate the mounting platform of the motor on top of the microfluidic device. A cylindrical PMMA base was mounted on the motor shaft. A number of holes were implemented for holding the magnets. Cylindrical NdFeB magnet (grading N38, 5 × 6 mm, AFM Magnetics, Australia) were inserted to induce a magnetic field. The magnet arrangement was a key factor to improve the magnetic field distribution. Numerical simulation with COMSOL Multiphysics was considered for optimising the flux distribution over the mixing chamber. The optimised magnet arrangement facilitated increased flux distribution without making the system bulky.
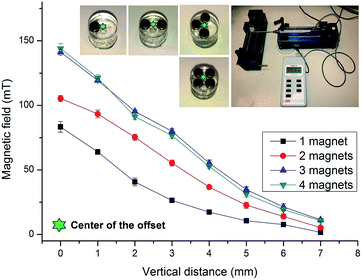
The magnetic field strengths were calibrated by a Gauss meter (Hirst Magnetic Instruments Ltd., UK). The tip of the Gauss metre was positioned at the center of the cylindrical base that is 1 mm apart from the edge of the magnets. This position represents the centre of the mixing chamber. Fig. 3 shows the measured magnetic flux density versus the distance from the surface of the magnets. The figure demonstrates a gradual decrease of flux density over the distance. Furthermore, the two-magnet configuration indicates an increased flux density as compared to the one-magnet configuration. The three-magnet and four-magnet configurations show higher flux density than the two-magnet configuration. Interestingly, the three-magnet configuration indicates a slightly higher flux density than the four-magnet configuration. The data depicted in Fig. 3 provided important insight on the magnetic flux distribution for the different configurations.
For a detailed magnetic flux distribution analysis, the magnetic base was adjusted manually around the edge of the mixing chamber. The gap between the magnetic surfaces to the circular chamber was approximately 3 mm. We selected 4 positions that are 90 degrees apart from each other. For the analysis, the video was converted into the still images by ImageJ software (NIH, imagej.net). For better visualisation, background noise and the stationary particles were subtracted to obtain the streamlines of each image using a customised MATLAB code.
We utilised an Arduino board (Duinotech Uno-XC 4410, China) to precisely control the rotational speed of the motor. The microprocessor was coded to provide a predefined speed ranging from 20 to 220 rpm. A fixed time frame has been considered to ensure that at least two circulations of the magnet around the chamber were observed. Each time frame consisted of at least 16 still images, for the different rotational speeds and flow rates. A customized MATLAB (MathWorks) code was used to analyse the mixing efficiency from the converted grayscale images. A total of 2400 still images were evaluated to determine the average mixing efficiency.
2.2. Theoretical background
The flow pattern of particles in an external magnetic field is affected by the magnetic force, hydrodynamic force, and drag forces.42 Under a complex magnetic field, the trajectory of particles depends on the balance of these forces. In the presence of a paramagnetic fluid, the manipulation of diamagnetic particles such as polystyrene is initiated by negative magnetophoresis, where the particles are pushed to the magnetic field minima.28 The magnetic field can be described as:| ∇μ0(H + M) = 0 | (1) |
| H = −∇Vm | (2) |
| ∇(ρfuf) = 0, | (3) |
 | (4) |
 | (5) |
 | (6) |
 | (7) |
| Fm = 2πrp3μ0μrk∇H2 | (8) |
 | (9) |
Mixing efficiency was calculated by evaluating the intensity of the recorded fluorescent images using customised MATLAB code.46 The mixing index is determined by measuring the pixel intensity over a cross-section area:
 | (10) |
2.3. Numerical simulations
COMSOL Multiphysics 5.2 (COMSOL Inc, USA) was utilized to observe the complex magnetic field of the different magnet configurations. The magnetic field with no current (MFNC) physics was utilized to model the magnetic flux density. The magnets with a diameter of ϕ = 5 mm and a thickness of h = 6 mm were placed in 4 different locations and 90° apart around the mixing chamber. The magnetization of the magnet was 1.6 × 10⁶ A m−1. A circular magnetic insulator with a diameter of 2 cm was imposed around the model. The relative permeability of the fluid was 1.05.For investigating the particle trajectories, low Reynolds number (creeping flow, SPF2) and particle tracing for the fluid flow (FPT) through the circulating chamber was considered. The model consists of an inlet, a circular mixing chamber, and an outlet. The edges from the magnet to the edges of the circular chamber had a minimum distance of 1 mm. An incompressible fluid (diluted ferrofluid in DI water) was introduced into the inlet with a flow rate of 15 μL min−1. The chamber was considered as a shallow channel with a thickness of 250 μm. For simplicity, no-slip boundary condition was selected. Six particles with a diameter of 30 μm and a particle density of 1200 kg m−3 ware considered in the simulation. The trajectory was initiated for a time period of 100 seconds with a time steps of 0.01 seconds.
Different magnetic pole arrangements for the magnets around the mixing chamber were investigated to optimise the magnetic flux gradient, Fig. 4. We expected that one of the different magnet arrangements will provide the optimal flux field gradient.1,18 Some magnet arrangements provide a stronger flux gradient than others.47,48 For example, two-magnet configurations with both the positive pole alignments provide more flux gradient into the mixing chamber then the positive and negative pole alignments due to their repulsive behaviour, Fig. 4B and C. However, in the three-magnet arrangements, the only positive or negative pole alignment repulses the flux lines in such a way that there is no effective field gradient into the mixing chamber. Besides, moving the magnet into a close setup improves the field gradient by many folds, Fig. 4F. For the four-magnet setup, an alternate magnetic pole alignments give the highest magnetic field gradient. For the simulation of particle trajectory, the configurations of Fig. 4A, B, F and G–H were considered.
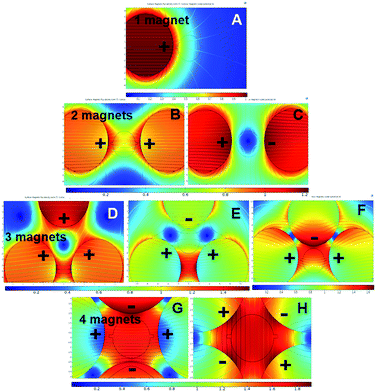 | ||
| Fig. 4 Different magnetic pole alignments for 1–4 magnets around the mixing chamber to optimize the maximum magnetic flux gradient. | ||
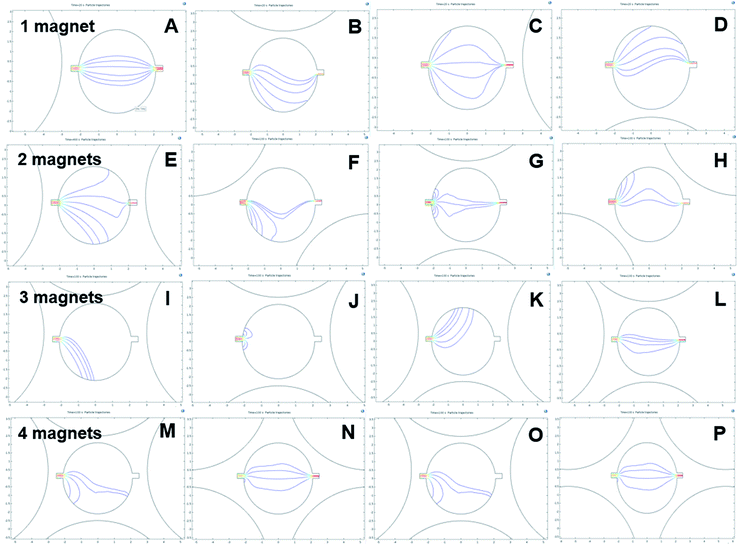
The next step was observing the effect of magnetic flux gradient for different positions of the magnets around the mixing chamber, Fig. 5. The figure represents the magnetic flux maxima and minima in the mixing chamber. With a clear understanding of magnetic flux distribution, it is possible to predict the negative magnetophoresis of the fluorescent particles. Fig. 6 shows the deflection of the diamagnetic particles in the mixing chamber. In Fig. 5A, the magnet is positioned close to the inlet region. The flux lines are aligned with the flow streamlines, and the flux minima are visible close to the outlet region. Hence, the particles tend to have straight trajectories from the inlet to the outlet, Fig. 6A. If the magnet moves 90 degrees clockwise, the flux lines become perpendicular to the streamlines. Moreover, the field maxima shifted to the top of the mixing chambers. As the particle follows the field minima, the trajectory bends towards this region, Fig. 6B. In Fig. 5C, the magnet was further moved by 90° and positioned close to the outlet. The field maxima again shift oppose to the hydrodynamic flows, and the field minima are visible close to the inlet. Therefore, the particles tend to accumulate at the inlet and are deflected at the outlet, Fig. 6C. The magnet again moved by 90° and positioned at the bottom of the chamber and subsequently the field minima region transferred to the upper part of the chamber. Therefore, the trajectories of the particle shifted towards the field minima as depicted in Fig. 6D.
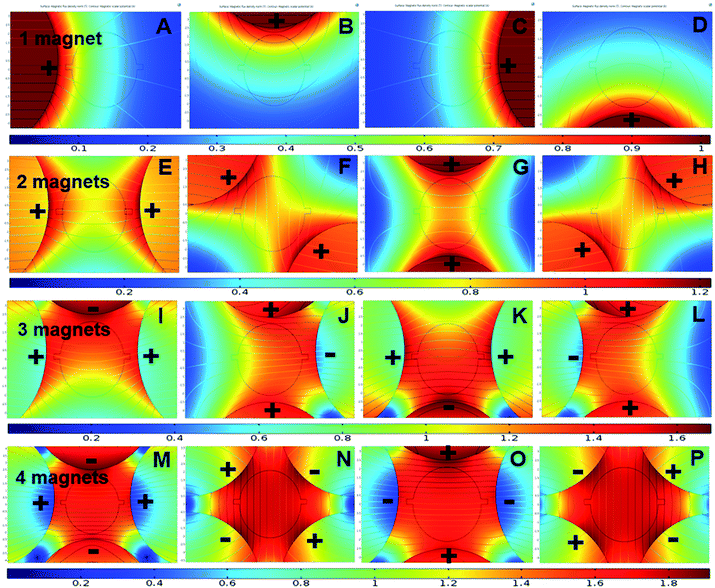 | ||
| Fig. 5 Magnetic flux distribution of 1–4 magnet arrangements at different positions over the fluidic chamber. | ||
For the two-magnet configurations, the setup was arranged in such a way that the like poles were facing towards the surface of the mixing chamber. The flux field gradient increases compared to the one-magnet setup.47 Fig. 5E shows the two magnets positioned 180° apart. The magnetic field minima can be observed at the top and the bottom of the mixing chamber. Furthermore, resultant flux fields are parallel to the streamlines of the flow. Therefore, the particles in Fig. 6E are projected through these field minima regions. Furthermore Fig. 5F and H show identical field pattern that is opposite. However, the field minima in Fig. 5F is at the bottom whereas the field minima in Fig. 5H is at the top of the inlet. Therefore, most particles tend to move toward these regions, Fig. 6F and H. Nonetheless, some of the particles could overcome the magnetic force and successfully pass through the mixing chamber by leaving a bending trail around the field minima region. Fig. 5G shows that the field minima were predominantly close to the inlet and the outlet. Some particle remains at the inlet region and is not be able to travel towards the outlet as they achieve zero velocity, Fig. 6G. However, other particles pass through the mixing chamber by maintaining possible field minima towards the outlet ports.
For the three-magnets configuration depicted in Fig. 5I–L, the flux gradient becomes stronger and only one field minimum could be observed. The particle follows these field as shown in Fig. 6I–L. Nonetheless, as the field minima are entirely covered by the inlet region, particle accumulated there, Fig. 6J. Fig. 5L indicates that the flux density gradually reduces from the inlet to the outlet port. Minimum deflection is observed for this gradual reduction of magnetic field strength. For the four-magnet configuration depicted in Fig. 5M–P, the magnetic flux gradient is stronger. In addition, the field minima disappear. Particle tracing shows only two patterns, Fig. 6M–P. Furthermore, it was interesting to observe that the trajectories have a tendency to move toward the bottom parts of the mixing chambers.
The detailed investigation suggested that the deflection pattern of the particles predominantly depends on the magnet position around the mixing chamber. Moreover, the dynamics movements by a DC motor could initiate similar patterns which have been utilized for active mixing in the subsequent experiments.
3. Results and discussion
3.1. Negative magnetophoresis in the stationary magnet fields
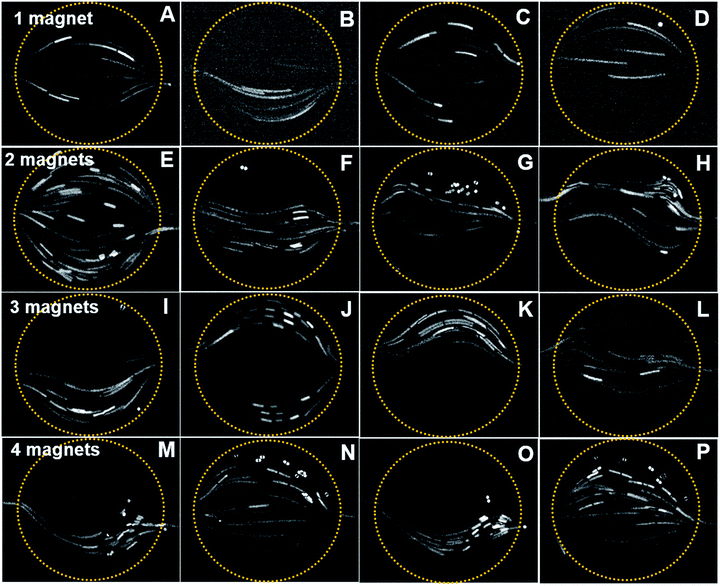
Fluorescent particles of 30 μm diameter were mixed with a diluted ferrofluid of 1% vol. concentration. As discussed in the simulation, the different magnet configurations were considered. Due to the diamagnetic nature of the fluorescent particles, negative magnetophoresis was observed in the experiments.28 The particles tend to accumulate in the magnetic flux minima region. Furthermore, due to the paramagnetic nature of the ferrofluid, the fluid experience a bulk force that creates a secondary flow in addition to the main hydrodynamic flow.The diamagnetic particles follow and pass through field minima region. As the magnet is positioned close to the inlet, the particle passes through the chamber without any deflections, Fig. 7A. However, if the magnet is positioned close to the outlet port (Fig. 7C), the magnetic field opposes the flow. The particle velocity is reduced while passing through the mixing chamber. Moreover, a number of particles are trapped in the mixing chamber due to the dominating magnetic forces. The particle stream demonstrates the phenomena where the longer stream observed close to the inlet region denotes a higher velocity, while it becomes shorter at the outlet indicating a relatively slower velocity. Fig. 7B and D show the particle deflection mostly towards the magnetic field minima due to negative magnetophoresis.
For the two-magnet configurations, particles tend to move more to the top and bottom where the field minima are, Fig. 7E. Fig. 7F and H show mirrored and slightly twisted trajectories. In both cases, the particles move through the minimum field close to the inlet and outlet. In Fig. 7G, the field minima are close to the inlet and outlet, because the magnets are positioned at the top and bottom of the mixing chamber. Thus, the particles mostly deflect near the inlet while flowing towards the outlet ports.
In a three-magnet configuration, identical and opposite deflections of the particles were observed, Fig. 7I and K. However, in Fig. 7J, the particle deflects towards the top and bottom region of the mixing chamber as the magnetic field minima are close to the inlet. Furthermore, no particles were observed at the center of the chamber. The simulated trajectory also provides an identical pattern, where the particles follow the side walls. A completely opposite phenomenon can be observed in Fig. 7L, where the particles mostly aggregated at the center region due to the higher magnetic field gradient all over the chamber.
In the four-magnet configurations depicted in Fig. 7M–P, only two patterns of particle trajectories were observed. For example, Fig. 7M and O indicates that the trajectories shifted towards the bottom region. When the magnet was placed 45 degrees further, the particles migrate towards the centre of the chamber, Fig. 7N and P.
The experimental data agree with the simulated trajectories. However, only six particles were considered in the simulation. In the experiments, we observed more complex secondary flows on top of the chamber. This could be due to a more complex and three-dimensional nature of the magnetic flux gradient acting on the fluid flows.28 The secondary flow is relatively slower and sometimes circulates opposing the main hydrodynamic flow. The deflection of the fluorescent particle relies on the active magnetic force perpendicular to the hydrodynamic force.
3.2. Mixing enhancement with multi-magnet setup
Mixing phenomena occur due to the susceptibility mismatch between the paramagnetic fluids and diamagnetic particles. The susceptibility mismatch generates a magnetoconvective flow of the paramagnetic fluids towards the magnetic field maximum. The competition between the hydrodynamic force and the magnetophoretic force determines the mixing performance.6,49 Fig. 8 shows the mixing efficiency of the multi-magnet configurations with rotational speed ranging from 25 to 200 rpm.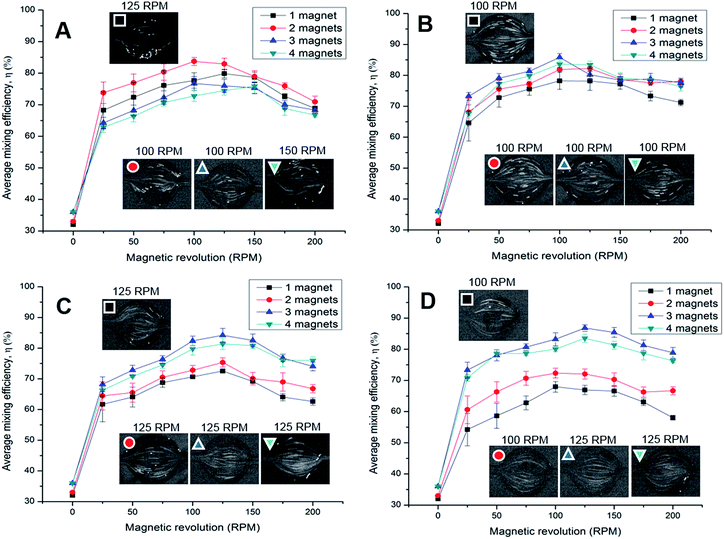 | ||
| Fig. 8 Mixing efficiency for the different rotational speeds of 1–4 magnets between a flow rate of (A) 15 μL min−1, (B) 30 μL min−1, (C) 45 μL min−1, and (D) 60 μL min−1. | ||
Fig. 8A shows the mixing efficiency for a flow rate of 15 μL min−1 for different rotational speeds of the one to four magnet configurations. Mixing of 1% vol. ferrofluid solution with 30 μm fluorescent particle, and 1% vol. ferrofluid solution (without fluorescent particle) was evaluated. The mixing efficiency was 28% in the chamber without any magnetic arrangement is due to the molecular diffusion. The mixing efficiency increases to 32% when the one-magnet (0 rpm) was mounted on top of the chamber. The efficiency increases due to the static magnetic field of the magnets acting on the bulk fluids. As a result, the magnetic nanoparticles of the ferrofluid solution slightly migrate towards the magnetic field maxima region.
For the one-magnet configuration, the mixing efficiency dramatically increases from 32% to approximately 68% due to the actuation of the magnets (25 rpm). The actuation changes the orientation of the magnetic flux lines. As the magnet revolves, the fluorescent particles are dragged along following the field minima. The mixing efficiency gradually increases to 79% with increasing rotational speed. The mixing efficiency reaches its maximum at 100–125 rpm due to the right force balance condition.28,42 Afterwards, the efficiency reduces as the fluid flow cannot follow the change of the magnetic field.11 For the two-magnet setup, the magnetic force becomes more dominant. The efficiency improves to 73–83% when the magnet rotates between 25 and 200 rpm, respectively. For the three, and four magnet setup, the magnetic flux becomes stronger but field minima are missing in the chamber, Fig. 5. Thus, mixing efficiency reduces to 64–76%, and 62–75% for the three, and four magnet setup respectively, as the diamagnetic particle follow the magnetic field minima.
At a flow rate of 30 μL min−1, the hydrodynamic force became more dominant, Fig. 8B. The mixing efficiency for the one, and two magnet configuration gradually decreases to 64–78%, and 68–82%, respectively. The maximum efficiency was observed between 100 and 125 rpm for both the cases. For the three-magnet setup, the mixing efficiency improves to 73–85% between 25 and 125 rpm, respectively. The peak efficiency was 85% at 100 rpm due to the right force balance condition. However, for the four-magnet setup, the mixing efficiency reduced to 67–83%. The maximum recorded efficiency was 83% between a range of 100–125 rpm. The reduced efficiency is again caused by the lack of field minima, Fig. 5.
At a flow rate of 45 μL min−1, the mixing efficiency dramatically drops to 61–72%, and 64–75% for the one, and two magnet configuration, Fig. 8C. As the hydrodynamic force dominates over the magnetic force, the diamagnetic particle associated with the ferrofluid cannot follow the moving magnetic field, Fig. 5. The three, and four magnet configuration offers a stronger field gradient with reduced field minima in the mixing chamber. The efficiency improves to 68–84%, and 66–81% for the three, and four magnet configuration, subsequently. The peak efficiency was at 100 rpm due to the right force balance condition. As the flow rate further increases to 60 μL min−1, the mixing efficiency for the one, and two magnet configuration further reduces to 54–67%, and 60–72%, respectively, Fig. 8D. Improved mixing performance was observed for three, and four magnet configuration at higher flow rates. The improved efficiency was 73–86%, and 70–83% for the three, and four magnet configuration. The four-magnet configuration shows reduced efficiency over three-magnets as the magnet works against each other, Fig. 3.
Another observation was that at low speed, the efficiency fluctuates more compared to a higher speed for the one, and two magnet configuration, Fig. 8. The flow stream does not deflect, if the magnet is closer to the inlet or the outlet ports, Fig. 7A, C and E. At a higher speed, the deviation decreases and a more stable mixing performance can be observed. Moreover, the fluctuation of the efficiency for the three, and four magnet configuration reduces at a lower speed, due to the lack of magnetic field minima, indicating a more stable mixing pattern.
4. Conclusion
The concept reported here is suitable for mixing of two or more samples. Our main motivation was to observe the phenomena of negative magnetophoresis and improved mixing with rotating magnets. Numerical simulation was conducted to observe the magnetic field distribution over the mixing chamber. Simulated particle tracing predicts trajectories of 30 μm fluorescent particles in ferrofluid stream for the four stationary positions of the magnet assemblies. The experimental trajectories show negative magnetophoresis similar to the predicted simulations. Both numerical and experimental data confirm that mixing of diamagnetic particles can be achieved by negative magnetophoresis.Efficient mixing was demonstrated with a low concentration of only 1% vol. ferrofluid. One, and two-magnet configurations show mixing efficiencies of approximately 79% and 83% at a flow rate of 15 μL min−1. The mixing efficiency gradually reduces with flow rates ranging from 30–60 μL min−1. Interestingly, improved mixing performance was observed at higher flow rates (45–60 μL min−1) for the three, and four magnet configuration. The trends were caused by the higher hydrodynamic force that allows the diamagnetic particle to balance with the stronger moving magnetic field. The highest mixing efficiency was 86% at a flow rate of 60 μL min−1 using the three-magnet configuration. The mixing efficiency reduced to 83% for the four-magnet configuration at a flow rate of 60 μL min−1.
The efficiency of the mixing concept presented here can be further improved using higher-grade magnets. A larger magnet will also improve the efficiency but may not suit the small microfluidic device. Moreover, the magnetic platform was mounted with a relatively large gap of almost 3 mm. The gap might be reduced to further improve the mixing efficiency. The multi-magnet configuration shows similar mixing performance at different flow rates for the microfluidic device. Multiple chambers with multiple motors in a series would allow for cascaded mixing. The same mixing concept can apply to paramagnetic particles functionalized with the antibody for diagnostic applications.50 Future works will address issues such as immobilizing biomarker on the beads, their on-chip mixing and separation.
Conflicts of interest
There are no conflict to declare.Acknowledgements
AM and HK acknowledge support from Griffith University through the Ph.D. scholarships. This work was performed in part at the Queensland node of the Australian National Fabrication Facility, a company established under the National Collaborative Research Infrastructure Strategy to provide nano and micro-fabrication facilities for Australia's researchers.References
- N. Minc, Encyclopedia of Microfluidics and Nanofluidics, 2015, pp. 1681–1689 Search PubMed.
- V. Hessel, H. Löwe and F. Schönfeld, Chem. Eng. Sci., 2005, 60, 2479–2501 CrossRef CAS.
- N.-T. Nguyen and Z. Wu, J. Micromech. Microeng., 2004, 15, R1 CrossRef.
- G. S. Jeong, S. Chung, C.-B. Kim and S.-H. Lee, Analyst, 2010, 135, 460–473 RSC.
- Y. K. Suh and S. Kang, Micromachines, 2010, 1, 82–111 CrossRef.
- N. Pamme, Lab Chip, 2006, 6, 24–38 RSC.
- N.-T. Nguyen, Microfluid. Nanofluid., 2012, 12, 1–16 CrossRef.
- P. K. Yuen, G. Li, Y. Bao and U. R. Müller, Lab Chip, 2003, 3, 46–50 RSC.
- L.-H. Lu, K. S. Ryu and C. Liu, J. Microelectromech. Syst., 2002, 11, 462–469 CrossRef CAS.
- K. S. Ryu, K. Shaikh, E. Goluch, Z. Fan and C. Liu, Lab Chip, 2004, 4, 608–613 RSC.
- S. L. Biswal and A. P. Gast, Anal. Chem., 2004, 76, 6448–6455 CrossRef CAS PubMed.
- S. H. Lee, D. van Noort, J. Y. Lee, B.-T. Zhang and T. H. Park, Lab Chip, 2009, 9, 479–482 RSC.
- H. H. Bau, J. Zhong and M. Yi, Sens. Actuators, B, 2001, 79, 207–215 CrossRef CAS.
- M. Yi, S. Qian and H. H. Bau, J. Fluid Mech., 2002, 468, 153–177 Search PubMed.
- T. Zhu, R. Cheng, Y. Liu, J. He and L. Mao, Microfluid. Nanofluid., 2014, 17, 973–982 CrossRef CAS.
- J. Kim and C.-N. Kim, J. Mech. Sci. Technol., 2015, 29, 4833–4839 CrossRef.
- W.-T. Wu, A. B. Martin, A. Gandini, N. Aubry, M. Massoudi and J. F. Antaki, Microfluid. Nanofluid., 2016, 20, 1–11 CrossRef CAS.
- T. F. Scherr, H. B. Ryskoski, A. B. Doyle and F. R. Haselton, Biomicrofluidics, 2016, 10, 024118 CrossRef PubMed.
- D. Robert, N. Pamme, H. Conjeaud, F. Gazeau, A. Iles and C. Wilhelm, Lab Chip, 2011, 11, 1902–1910 RSC.
- A. Skjeltorp, Phys. Rev. Lett., 1983, 51, 2306 CrossRef.
- W. Zhao, R. Cheng, J. R. Miller and L. Mao, Adv. Funct. Mater., 2016, 26, 3916–3932 CrossRef CAS PubMed.
- R. E. Rosensweig, Ferrohydrodynamics, Courier Corporation, 2013 Search PubMed.
- R. Cheng, T. Zhu and L. Mao, Microfluid. Nanofluid., 2014, 16, 1143–1154 CrossRef CAS.
- T. Zhu, D. J. Lichlyter, M. A. Haidekker and L. Mao, Microfluid. Nanofluid., 2011, 10, 1233–1245 CrossRef CAS.
- J. Zeng, C. Chen, P. Vedantam, T.-R. Tzeng and X. Xuan, Microfluid. Nanofluid., 2013, 15, 49–55 CrossRef CAS.
- J. Zeng, Y. Deng, P. Vedantam, T.-R. Tzeng and X. Xuan, J. Magn. Magn. Mater., 2013, 346, 118–123 CrossRef CAS.
- L. Liang, C. Zhang and X. Xuan, Appl. Phys. Lett., 2013, 102, 234101 CrossRef.
- M. Hejazian and N.-T. Nguyen, Lab Chip, 2015, 15, 2998–3005 RSC.
- G.-P. Zhu, M. Hejiazan, X. Huang and N.-T. Nguyen, Lab Chip, 2014, 14, 4609–4615 RSC.
- T. Zhu, F. Marrero and L. Mao, Microfluid. Nanofluid., 2010, 9, 1003–1009 CrossRef.
- T. Zhu, R. Cheng, S. A. Lee, E. Rajaraman, M. A. Eiteman, T. D. Querec, E. R. Unger and L. Mao, Microfluid. Nanofluid., 2012, 13, 645–654 CrossRef CAS PubMed.
- W. Zhao, T. Zhu, R. Cheng, Y. Liu, J. He, H. Qiu, L. Wang, T. Nagy, T. D. Querec and E. R. Unger, Adv. Funct. Mater., 2016, 26, 3990–3998 CrossRef CAS PubMed.
- N. Pamme, J. C. Eijkel and A. Manz, J. Magn. Magn. Mater., 2006, 307, 237–244 CrossRef CAS.
- N. Pamme and C. Wilhelm, Lab Chip, 2006, 6, 974–980 RSC.
- W. Zhao, R. Cheng, S. H. Lim, J. R. Miller, W. Zhang, W. Tang, J. Xie and L. Mao, Lab Chip, 2017, 17(13), 2243–2255 RSC.
- W. Zhao, R. Cheng, B. D. Jenkins, T. Zhu, N. E. Okonkwo, C. E. Jones, M. B. Davis, S. K. Kavuri, Z. Hao and C. Schroeder, Lab Chip, 2017, 17, 3097–3111 RSC.
- D.-W. Oh, J. S. Jin, J. H. Choi, H.-Y. Kim and J. S. Lee, J. Micromech. Microeng., 2007, 17, 2077 CrossRef.
- N. Pamme and A. Manz, Anal. Chem., 2004, 76, 7250–7256 CrossRef CAS PubMed.
- A. Munaz, R. K. Vadivelu, J. A. St John and N.-T. Nguyen, Lab Chip, 2016, 16, 2946–2954 RSC.
- H. Y. Tan, W. K. Loke, Y. T. Tan and N.-T. Nguyen, Lab Chip, 2008, 8, 885–891 RSC.
- A. Munaz, R. K. Vadivelu, J. S. John, M. Barton, H. Kamble and N.-T. Nguyen, Journal of Science: Advanced Materials and Devices, 2016, 1, 1–17 CrossRef.
- J. Zhang, S. Yan, D. Yuan, G. Alici, N.-T. Nguyen, M. E. Warkiani and W. Li, Lab Chip, 2016, 16, 10–34 RSC.
- J. Vanderlinde, Classical electromagnetic theory, Springer Science & Business Media, 2006 Search PubMed.
- P. M. Gresho and R. L. Sani, Incompressible flow and the finite element method, Volume 1: Advection-diffusion and isothermal laminar flow, John Wiley and Sons, Inc, 1998 Search PubMed.
- L. D. Landau and E. M. Lifshitz, Fluid mechanics, Volume 6: Course of theoretical physics, Pergamon Press, 1987 Search PubMed.
- A. Hashmi and J. Xu, J. Lab. Autom., 2014, 19, 488–491 CrossRef PubMed.
- A. Munaz, B.-C. Lee and G.-S. Chung, Sens. Actuators, A, 2013, 201, 134–140 CrossRef CAS.
- A. Munaz and G.-S. Chung, Microsyst. Technol., 2015, 1–9 Search PubMed.
- C.-Y. Lee, C.-L. Chang, Y.-N. Wang and L.-M. Fu, Int. J. Mol. Sci., 2011, 12, 3263–3287 CrossRef CAS PubMed.
- H. Bordelon, P. K. Russ, D. W. Wright and F. R. Haselton, PLoS One, 2013, 8, e68369 CAS.
| This journal is © The Royal Society of Chemistry 2017 |

