 Open Access Article
Creative Commons Attribution 3.0 Unported Licence
Electrocatalytic water oxidation at amorphous trimetallic oxides based on FeCoNiOx†
Md Abu Sayeed and
Anthony P. O'Mullane *
*
School of Chemistry, Physics and Mechanical Engineering, Queensland University of Technology (QUT), GPO Box 2434, Brisbane, QLD 4001, Australia. E-mail: anthony.omullane@qut.edu.au
First published on 5th September 2017
Abstract
Recently there has been a noticeable shift towards developing amorphous bimetallic or trimetallic oxides for electrochemical water splitting. However, the fabrication of a homogeneous mixed metal oxide electrocatalyst suitable for water electrolysis is not a facile process. Here we introduce an electrochemical synthesis method that is rapid, simple and performed under ambient conditions. Using this approach it is possible to create a catalytically active FeCoNiOxHy amorphous material whose activity is dependent on the nature of the underlying support. The trimetallic oxide is significantly more active than any single or bimetallic oxide combination for the OER. This amorphous catalyst demonstrates not only excellent activity but also stability over extended time periods.
Introduction
The ability to store energy from intermittent renewable energy sources is a significant challenge that can be addressed by generating hydrogen as a fuel via electrochemical water splitting.1–5 However, the sluggish kinetics of the oxygen evolution reaction (OER) is hampering this effort. The most commonly used electrocatalysts are IrO2 and RuO2 but these are prohibitively expensive due to their scarcity. Therefore, substantial commercial penetration of electrolysers has been hampered by a failure to fabricate inexpensive electrocatalysts that exhibit high current density at a low energy cost over prolonged periods. Consequently, addressing this major technological challenge has gained momentum and there has been significant progress in developing non-precious metal based earth abundant catalysts for better OER performance.1,6–9 In particular (oxy)-hydroxides or oxides of iron, nickel and cobalt have been studied due to their relatively higher abundance, lower cost and good performance in alkaline electrolytes for the OER.2,5,10–17 Recent work by Cao et al. have demonstrated that iron based thin films are highly active for the OER in neutral conditions,18,19 as well as hierarchical Co(OH)F superstructures20 and porphyrin and corrole based systems.21 It is now generally regarded that bimetallic or trimetallic oxides perform better than monometallic MOx systems.11–13,22,23 It has been shown that even iron impurities in the electrolyte can significantly enhance the performance of CoOx and NiOx electrodes for the OER.24 When the energetics of the water oxidation process is considered for monometallic MOx catalysts, the key intermediates such as OH, O and OOH are adsorbed either too weakly or strongly on the surface which introduces a large overpotential15 and limits activity. Therefore having three components in the catalyst appears to solve this issue and promotes electrocatalytic activity through a synergistic effect.Interestingly, there has been a shift from utilising crystalline catalysts to producing amorphous materials for water splitting.22,25–27 A recent study has shown that a photochemical metal–organic deposition process can produce amorphous mixed metal oxides displaying activity for the OER.22 Crystallinity or lack thereof is therefore expected to be a critical factor in determining the activity of the catalyst as evidence is now emerging that a reversible crystalline to amorphous transition can occur during the OER, as reported for Co3O4.28 The formation of a thin amorphous layer at the surface of the crystalline metal oxide was found to be the active state for the OER, which reverted to the crystalline state once returned to non-catalytic conditions. Therefore, the formation of an amorphous homogeneous mixed metal oxide system that is active and robust is of significant interest for the OER.
Here we introduce an electrochemical protocol that results in the formation of a FeCoNiOxHy material under ambient conditions that is evenly distributed over the substrate electrode and is highly active and durable for the OER. An electrochemical approach was taken due to simplicity, cost-effectiveness and good adherence to the underlying electrode compared to other deposition techniques that may be more involved for OER electrode preparation such as hydrothermal, co-sputtering and thermal decomposition techniques.
Results and discussion
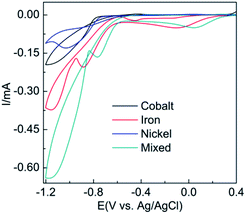
Cyclic voltammograms (CVs) recorded at a gold electrode in an electrolyte containing either 8 mM of the hydrated salts of Co(NO3)2, Ni(NO3)2 or Fe(NO3)2 or an equimolar solution of all three salts is shown in Fig. 1. When taking a solution of 8 mM Co(NO3)2 in water the cathodic current seen from −0.80 to −1.20 V is due to the reduction of water via 2H2O + 2e− → 2OH(aq)− + H2(g). The liberated OH− ions at the electrode surface complex with Co2+ ions to form Co(OH)2(s). An analogous process occurs for the case of Ni(NO3)2 as evidenced by a very similar voltammetric profile. In the case of Fe(NO3)3 slightly different behaviour is observed in that there is a peak at 0.05 V prior to the onset of the large cathodic current as seen for the other two metal salts, which is due to the reduction of Fe3+ to Fe2+. However iron hydroxide/oxide is formed in an analogous manner as reported elsewhere.29For the equimolar solution containing all three metal salts the voltammogram is close to the addition of the three individual processes as evidenced by the large magnitude of current from −0.80 to −1.20 V. This result was further verified by the mathematical summation of the response from the individual reduction processes (Fig. S1†). It should be noted that there is a slight shift to more positive potentials (ca. 0.15 V) for all processes compared to the individual responses which may be due to the increased conductivity of the solution when three salts are present. Also in the CV it can be seen that there is current crossover between the forward and reverse scans which is highly indicative of nucleation growth phenomenon.30 This was analysed by performing current time transients (Fig. S2†) over a range of −0.70 to −1.00 V and analysing the data by the Hills–Scharifker method31 where it was found that at early times (<3 s) instantaneous nucleation and growth occurs.
Initially it was confirmed that the electrodeposition of all three components did in fact enhance the OER compared to either individually deposited materials or the bimetallic combinations. A potential of −0.95 V was chosen which is well within the water reduction process (Fig. 1) for a period of 90 s. It can be seen from Fig. 2 that the trimetallic system gave the highest current density at an overpotential of 0.34 V when compared to mono or bimetallic systems (the 5th cycle is presented which ensured a stable response). In addition this material showed the lowest Tafel slope of 32 mV dec−1 when compared to all other combinations (Table S1†). Interestingly the FeCo and FeNi combinations reduced the overpotential but could not facilitate as high current densities. This data is consistent with previous work where the presence of iron, although very inactive itself in the potential range of interest, promotes the activity of Co and Ni oxides.13,32,33
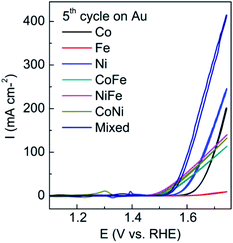 | ||
| Fig. 2 Cyclic voltammograms recorded at 10 mV s−1 in 0.1 M NaOH for mono-, bi- and trimetallic oxides showing the 5th cycle of the OER. | ||
It can be seen prior to the onset of oxygen evolution that there are significant faradaic processes occurring at the as-deposited materials which are illustrated in Fig. 3. For the individual M(OH)2 deposits characteristic redox processes can be seen for the Co(II)/Co(III) and Ni(II)/Ni(III) transitions with the latter process occurring at more positive potentials. For the case of iron hydroxide/oxide there are no oxidation processes in the potential range studied which is consistent with previous reports.32 For the CoNi hydroxide/oxide system it can be seen that the CV shows behaviour in a potential region between that of the individual components which indicates good electronic communication between the materials. For FeCo and FeNi hydroxide/oxide the inclusion of iron has a significant impact on the voltammetry which is evidenced by a dramatic reduction in the peak intensities and shift to less positive potentials for both the Co(II)/Co(III) and Ni(II)/Ni(III) transitions. The inclusion of iron also results in a dramatic increase in the OER current towards the end of the sweep which is much greater than that seen for the CoNi case. This is consistent with the recent work by Strasser who demonstrated that the incorporation of Fe into nickel oxide can increase the OER rate by 1–2 orders of magnitude.13 Finally for the trimetallic FeCoNi sample there is a broad oxidation process from 1.2 to 1.5 V prior to the onset of the OER. Although the onset for the OER is slightly more positive compared to the bimetallic samples containing iron the current density that can be achieved with the trimetallic sample at slightly higher potentials is significantly greater (Fig. 1). Therefore given the enhanced performance in terms of current density that can be achieved the trimetallic system was investigated in detail. The optimum OER activity was then determined via applying different potentials and deposition times as shown in Fig. S3† and found to be −0.95 V for 90 s. These conditions also resulted in the best long term performance of the electrocatalyst. A SEM image of the optimised sample is shown in Fig. 4. The formation of a layered sheet-like morphology with minimal cracks was observed which is indicative of M(OH)2 materials such as Ni(OH)2 and Co(OH)2 (ref. 34 and 35) and also consistent with iron oxyhydroxide films.36 SEM-EDX analysis revealed a composition of Fe25Co40Ni35Ox (Fig. S4†) for the as-deposited material which is comparable with the X-ray photoelectron spectroscopy (XPS) data as Fe20Co37Ni43OxHy. This indicates that the final composition is different to the ratio of metal salts used during the electrodeposition process which were equimolar. Therefore this indicates that the electrodeposition of nickel and cobalt hydroxide is preferred over iron hydroxide.
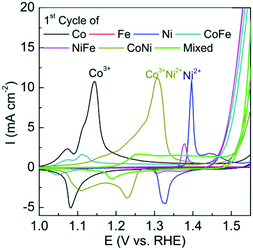 | ||
| Fig. 3 Cyclic voltammograms recorded at 10 mV s−1 in 0.1 M NaOH for mono-, bi- and trimetallic oxides showing the 1st cycle prior to the OER. | ||
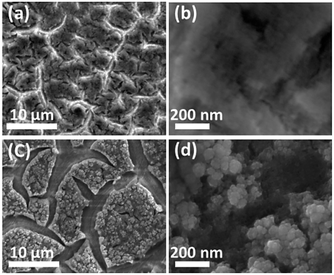 | ||
| Fig. 4 SEM images of FeCoNiOxHy electrodeposited onto an Au electrode (a), (b) before and (c), (d) after OER. | ||
However this material is unlikely to be the active species involved in the OER as reported previously for electrodeposited Co(OH)2.35 Once Co(OH)2 is oxidised the composition changes to Co3O4 prior to the OER and then formation of Co(IV) occurs which is responsible for oxygen evolution.37 Therefore the sample was also imaged (Fig. 4c and d) after several potential cycles into the OER region over the range shown in Fig. 2. An interesting effect occurred whereby the surface loses its layered type structure and is replaced with a fractured surface containing isolated islands comprised of nodule like nanomaterials. EDX mapping of the reconstructed surface shows a highly even distribution of Fe, Co, Ni and O throughout the material without any evidence of phase segregation (Fig. 5 and S5†).
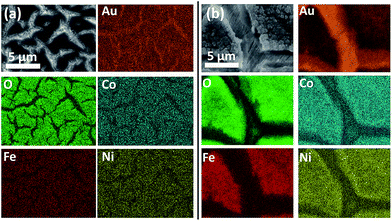 | ||
| Fig. 5 SEM-EDX maps of FeCoNiOxHy electrodeposited onto an Au electrode (a) before and (b) after OER. | ||
This is generally difficult to achieve with more conventional approaches such as thermal decomposition and coprecipitation.22 There is also clear exposure of the supporting gold electrode (Fig. 5) which in principle should be beneficial for oxygen evolution given the significant impact it has on the activity of cobalt oxide catalysts.7,35,37,38 The thickness of the as-deposited sample is 75 μm which decreased slightly after the OER to 67 μm (Fig. S6†).
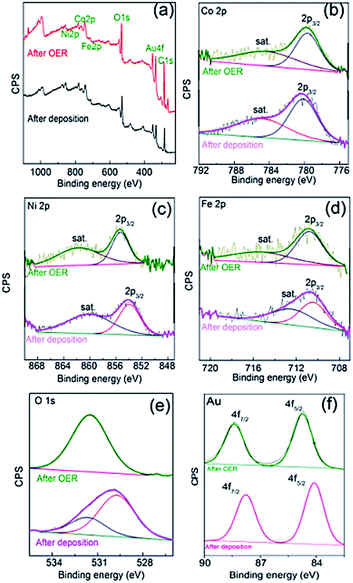
The composition also changed compared to the as-deposited material and was determined to be Fe30Co30Ni40OxHy by SEM-EDX (Fig. S5†) and Fe30Co35Ni35OxHy by XPS (Fig. 6) indicating a slight enrichment of Fe and Ni compared to the as-deposited material. Taking the Co 2p core level spectrum the binding energy of Co 2p3/2 (Fig. 6b) before the OER conversion process is 780.1 eV with a clear satellite peak at higher energy which indicates the presence of Co(OH)2.35 After the OER reaction the satellite peak is diminished, which indicates the formation of Co3O4 at the surface. For Ni, the Ni 2p3/2 peak at a binding energy of 855.1 eV (Fig. 6c) is indicative of Ni2+ species and is consistent with the formation of NiO and Ni(OH)2.39 For Fe the Fe 2p3/2 peak at a binding energy of 710.8 eV (Fig. 6d) is indicative of Fe2O3 which is consistent before and after the OER reaction. It has been reported previously29 that electrochemically reduced iron nitrate initially forms Fe(OH)2 but then converts readily to Fe2O3 which is consistent here with the as deposited material.40 The O 1s spectrum (Fig. 6e) before the OER can be deconvoluted into two components indicating a mixture of hydroxide (higher binding energy) and oxide states (lower binding energy). However, after the OER only one broad component is observable indicating the majority of the sample comprises of metal hydroxides41 or oxygen defects. Also shown in Fig. 6f shows the Au 4f core level spectra showing binding energies of 84.9 eV and 88.5 eV for Au 4f5/2 and 4f7/2, respectively which can be assigned to metallic Au0 of the underlying electrode.42 The binding energy values shift by 2 eV indicating the formation of an oxidised surface43 after the OER reaction. The composition of the catalyst before and after the OER was also analysed by laser ablation inductively coupled plasma mass spectrometry and found to change from Fe24Co44Ni32OxHy to Fe28Co38Ni34OxHy which is consistent with the EDX and XPS results.
To gain further insights into the structure of the materials, FeCoNiOxHy was electrodeposited onto an Au coated (2–3 nm thick) TEM grid (Fig. 7a and b). EDS analysis with HRTEM shows that FeCoNiOxHy was electrodeposited on the gold particles and the underlying carbon film (Fig. S7†). From the FFT images in the carbon only region (Fig. 7b), it was observed that the materials were mainly amorphous, however it must be noted that there are some spots in the FFT pattern which indicates some degree of crystallinity at the localised nanoscale level. Interestingly, after the OER the material showed evidence of a transition into a more crystalline state (Fig. 7d). However, XRD analysis of the bulk material before and after the OER was dominated by the underlying gold substrate (Fig. 8) and suggests that this amorphous to crystalline transition does not extend through the bulk of the electrodeposited material. It is interesting that the gold peaks are suppressed after the OER which may indicate that the gold is being oxidised quite significantly during the process (Au film for this sample is 100 nm thick) which is expected at this applied potential.44 The two peaks around 2θ = 55° which shift after the OER were unable to be assigned and did not correspond to any mono-, bi- or tri-metallic oxide/hydroxide. Given the absence of any other major peaks at lower values does suggest the material is amorphous.
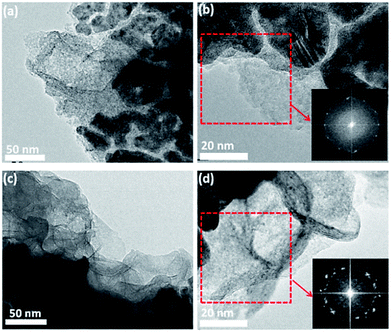 | ||
| Fig. 7 HR-TEM images for (a, b) electrodeposited mixed hydroxide and (c, d) post OER electrodeposited mixed hydroxide. The inset shows the FFT images. | ||
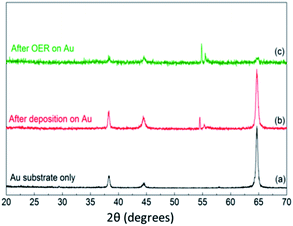 | ||
| Fig. 8 GIXRD patterns of (a) Au substrate only, (b) FeCoNiOxHy@Au after deposition and (c) FeCoNiOxHy@Au after 5 cycles of OER. | ||
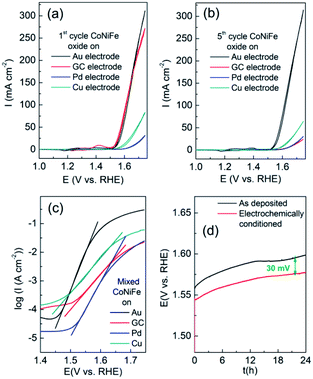
It was also found that the underlying electrode influenced the OER whereby a gold electrode was found to show significantly better performance over glassy carbon (GC), Pd or Cu support electrodes (Fig. 9). Although the first cycle for FeCoNiOxHy deposited on GC showed similar behaviour to that on Au the current density quickly diminished after 5 cycles (Fig. 9b) and demonstrated less activity than both Pd and Cu support electrodes. The Tafel slope for the OER at FeCoNiOxHy on the different substrates (Au, GC, Pd and Cu) after 5 cycles was determined to be 32, 84, 52 and 73 mV dec−1 respectively, implying a significant dependence on the substrate for the OER (Fig. 9c). It should be noted that the morphology of FeCoNiOxHy deposited on GC is distinctly different compared to Au (Fig. S8†). The surface is fractured and does not contain the layered type structure seen for the case of Au (Fig. 4). However from SEM-EDX analysis (Fig. S9†) the composition is comparable (Fe30Co34Ni36OxHy) on a GC electrode. After the OER parts of the film were compromised but in general the morphology remained intact indicating that a significant restructuring process did not occur. Previous work on cobalt oxide catalysts postulated that underlying metals act as electron sinks to promote the formation of the Co(IV) oxidation state which is regarded as the active site for oxygen evolution.7 This may also play a role here given the high percentage of cobalt in the trimetallic oxide sample.
Determining the main active site for the OER however is a challenging issue that is difficult to address. Recently however, Strasser13 has shown for the FeNi system that the buildup of higher oxidation states of Ni(IV) and Fe(IV) is followed by O–O bond formation with the subsequent release of molecular oxygen. This process restores the metal site back to its reduced state. Once the Fe level is above 4% the rate of oxygen evolution is greater than the rate of metal oxidation and therefore lower valent metal centres are stabilised during catalysis and the active centre was determined to be Ni2+Fe3+OOH. Recent spectroscopic characterization of mixed Fe–Ni oxide electrocatalysts indicated that a NiFe2O4 phase was a contributing factor to enhanced OER activity as well as the presence of basic active sites.45 Bell et al.46 have also reported that Ni–Fe catalysts are active for the OER whereby the incorporation of iron into the film increases the potential at which the Ni(OH)2/NiOOH redox process occurs and decreases the average oxidation state of Ni in NiOOH which results in an increase in activity for the OER.46 Cao et al. have also investigated the Fe–Ni system in detail47–49 and described additional effects that promote OER activity such as the embedded Fe(III) increases charge mobility due to more oxygen vacancies that facilitate polaron hopping between neighbouring atoms as well as the creation of surface defects for the coordination of reactive species. As seen from Fig. 2 and 3 the incorporation of Fe into cobalt also enhances activity at low overpotentials and therefore an analogous process may be taking place. However the nature of the underlying electrode was not investigated and may have an influence on the processes taking place. The combination of electronic interaction between the catalyst layer and the support, the critical presence of Fe, and the surface morphology changes that occur, greatly influence OER activity.
The turnover frequency (TOF) is an excellent way to benchmark these materials as getting accurate surface areas for electrodeposited materials on this scale is not straightforward. As discussed by Lyons et al. the electrochemical equivalent of the TOF can be described by:50
| TOF = 1NA/4FNatoms = J/4Q | (1) |
Experimental
Chemicals
Cobalt(II) nitrate hexahydrate, iron(III) nitrate nonahydrate (Chem-Supply), nickel(II) nitrate hexahydrate (Alfa Aesar) and sodium hydroxide (98%) (Sigma-Aldrich) were used as received and made up with deionised water (resistivity of 18.2 MΩ cm) purified by use of a Milli-Q reagent deioniser (Millipore). The plating solution for the mixed CoNiFe oxide nanostructures consisted of 8 mM each of Co(NO3)2·6H2O, Ni(NO3)2·6H2O and Fe(NO3)3·9H2O.Electrochemical characterization
Electrochemical measurements were undertaken at (20 ± 2) °C with a BioLogic VSP workstation equipped with a Rotating Ring Disk Electrode-3A (RRDE) assembly and a standard three-electrode cell configuration, consisting of a working electrode, reference electrode (Ag/AgCl (3 M KCl)) and counter electrode (Pt wire). For OER experiments, Au (3 mm diameter), GC (3 mm diameter), Pd (3 mm diameter) or Cu RDE (1.6 mm diameter) from BAS Inc. were used. The surface was mechanically polished with 0.3 μm-sized alumina powder on a Microcloth pad and rinsed in Milli-Q water. For all electrochemical experiments the electrolyte was initially purged for 10 min with nitrogen gas. For chronoamperometric experiments the potential was stepped from 0 V to the deposition potential of interest. For the OER the catalyst which was deposited on a RDE was rotated at 1500 rpm in 0.1 M NaOH. The reproducibility of the measurements was checked by carrying out four replicates for each OER experiment which is shown in Fig. S10.† The as electrodeposited mixed metal oxide/hydroxide was washed with deionised water for at least 3 times before the characterizations. In all cases iR correction was applied to cyclic voltammograms and the potential for the OER data has been converted to the RHE scale via ERHE = EAg/AgCl + 0.059 × pH + 0.197 V. The current density reported in this work is normalized to the geometric surface area of the electrodes and was also used in the TOF calculation. The cyclic voltammetric experiments used to obtain the Tafel data were recorded at a sweep rate of 1 mV s−1.Structural characterization
SEM and EDX were performed on JEOL 7001F at an operating voltage of 5 kV and 15 kV, respectively. Samples were prepared by electrodeposition onto 100 nm thick Au coated silicon substrates following the same parameters used for the Au electrode (BAS), followed by rinsing with Milli-Q water to remove any metals salts and drying with a flow of nitrogen. The active area on the Au coated silicon substrates was carefully controlled using a mask (∼17 mm diameter). X-ray photoelectron spectroscopy data were collected using an Omicron Multiscan Lab Ultra-high Vacuum Scanning Tunnelling Microscope (UHV-STM) incorporating a 125 mm hemispherical electron energy analyser. XPS measurements were performed using non-monochromatic Mg Kα (1253.6 eV) X-ray source (DAR 400, Omicron Nanotechnology), 300 W incident angle at 65° to the sample surface. Wide scans were observed at an analyser pass energy of 50 eV with 0.5 eV steps and 200 ms dwell time. Narrow high-resolution scans for Co 2p, O 1s, Au 4f, and C 1s were taken at 20 eV pass energy, 0.2 eV steps, 200 ms dwell time. The base pressure in the analysis chamber was 1.0 × 10⁻⁹ Torr and 1.0 × 10⁻⁸ Torr when the sample was analysed. HRTEM images were taken using a JEOL 2100 instrument at 200 KV. A high-sensitivity silicon drift X-ray detector for more accurate compositional analysis and a Gatan Orius SC1000 CCD camera is equipped for better image acquisition. Ultrathin gold supported films on 3 mm standard TEM grids (Substratek™, TED PELLA) were used as the working electrode for the electrodeposition of FeCoNiOxHy. Laser ablation of samples took place in a He atmosphere (0.85 l min−1) in a ESI New Wave “TV” cell attached to a ATL excimer laser. The laser was fired at 6 Hz and the spot size was 85 microns. The laser output fluence was about 2 J cm−2 and the fluence at the sample was approximately 25% of that. Samples were either drilled or rastered. The reference material used in the experiment was NIST-610, a silicate glass. Samples were drilled until the silicon substrate was 100% of the signal. The ablated material in the carrier He gas was Y-ed into an argon gas flow at 1 l min−1 which entered the plasma of the Agilent 8800 ICPMS. The instrument was run in single MS mode with RF power at 1350 and no torch shield.Conflicts of interest
There are no conflicts to declare.Acknowledgements
AOM gratefully acknowledges funding through a Future Fellowship from the Australian Research Council (FT110100760). The XPS and SEM data reported in this paper were obtained at the Central Analytical Research Facility operated by the Institute for Future Environments (QUT). Access to CARF is supported by generous funding from the Science and Engineering Faculty (QUT).Notes and references
- I. Roger, M. A. Shipman and M. D. Symes, Nature Reviews Chemistry, 2017, 1, 0003 CrossRef.
- M. E. G. Lyons, R. L. Doyle, M. P. Browne, I. J. Godwin and A. A. S. Rovetta, Current Opinion in Electrochemistry, 2017, 1, 40–45 CrossRef.
- X. Li, X. Hao, A. Abudula and G. Guan, J. Mater. Chem. A, 2016, 4, 11973–12000 CAS.
- S. Anantharaj, S. R. Ede, K. Sakthikumar, K. Karthick, S. Mishra and S. Kundu, ACS Catal., 2016, 6, 8069–8097 CrossRef CAS.
- X. Zou and Y. Zhang, Chem. Soc. Rev., 2015, 44, 5148–5180 RSC.
- J. A. Koza, Z. He, A. S. Miller and J. A. Switzer, Chem. Mater., 2012, 24, 3567–3573 CrossRef CAS.
- B. S. Yeo and A. T. Bell, J. Am. Chem. Soc., 2011, 133, 5587–5593 CrossRef CAS PubMed.
- Y. Zhao, S. Chen, B. Sun, D. Su, X. Huang, H. Liu, Y. Yan, K. Sun and G. Wang, Sci. Rep., 2015, 5, 7629 CrossRef CAS PubMed.
- M. S. Burke, L. J. Enman, A. S. Batchellor, S. Zou and S. W. Boettcher, Chem. Mater., 2015, 27, 7549–7558 CrossRef CAS.
- T. Maiyalagan, K. A. Jarvis, S. Therese, P. J. Ferreira and A. Manthiram, Nat. Commun., 2014, 5, 3949 CAS.
- Q. Luo, M. Peng, X. Sun, Y. Luo and A. M. Asiri, Int. J. Hydrogen Energy, 2016, 41, 8785–8792 CrossRef CAS.
- M. Görlin, M. Gliech, J. F. de Araújo, S. Dresp, A. Bergmann and P. Strasser, Catal. Today, 2016, 262, 65–73 CrossRef.
- M. Görlin, P. Chernev, J. Ferreira de Araújo, T. Reier, S. Dresp, B. Paul, R. Krähnert, H. Dau and P. Strasser, J. Am. Chem. Soc., 2016, 138, 5603–5614 CrossRef PubMed.
- D. R. Chowdhury, L. Spiccia, S. S. Amritphale, A. Paul and A. Singh, J. Mater. Chem. A, 2016, 4, 3655–3660 CAS.
- S. A. Bonke, A. M. Bond, L. Spiccia and A. N. Simonov, J. Am. Chem. Soc., 2016, 138, 16095–16104 CrossRef CAS PubMed.
- J. Nai, H. Yin, T. You, L. Zheng, J. Zhang, P. Wang, Z. Jin, Y. Tian, J. Liu, Z. Tang and L. Guo, Adv. Energy Mater., 2015, 5, 1401880 CrossRef.
- M. S. Burke, S. Zou, L. J. Enman, J. E. Kellon, C. A. Gabor, E. Pledger and S. W. Boettcher, J. Phys. Chem. Lett., 2015, 6, 3737–3742 CrossRef CAS PubMed.
- M. Chen, Y. Wu, Y. Han, X. Lin, J. Sun, W. Zhang and R. Cao, ACS Appl. Mater. Interfaces, 2015, 7, 21852–21859 CAS.
- Y. Wu, M. Chen, Y. Han, H. Luo, X. Su, M.-T. Zhang, X. Lin, J. Sun, L. Wang, L. Deng, W. Zhang and R. Cao, Angew. Chem., Int. Ed., 2015, 54, 4870–4875 CrossRef CAS PubMed.
- S. Wan, J. Qi, W. Zhang, W. Wang, S. Zhang, K. Liu, H. Zheng, J. Sun, S. Wang and R. Cao, Adv. Mater., 2017, 29, 1700286 CrossRef PubMed.
- W. Zhang, W. Lai and R. Cao, Chem. Rev., 2017, 117, 3717–3797 CrossRef CAS PubMed.
- R. D. L. Smith, M. S. Prévot, R. D. Fagan, Z. Zhang, P. A. Sedach, M. K. J. Siu, S. Trudel and C. P. Berlinguette, Science, 2013, 340, 60–63 CrossRef CAS PubMed.
- J. Nai, Y. Tian, X. Guan and L. Guo, J. Am. Chem. Soc., 2013, 135, 16082–16091 CrossRef CAS PubMed.
- L. Trotochaud, S. L. Young, J. K. Ranney and S. W. Boettcher, J. Am. Chem. Soc., 2014, 136, 6744–6753 CrossRef CAS PubMed.
- W.-Y. Xia, N. Li, Q.-Y. Li, K.-H. Ye and C.-W. Xu, Sci. Rep., 2016, 6, 23398 CrossRef CAS PubMed.
- Y. Hou, M. R. Lohe, J. Zhang, S. Liu, X. Zhuang and X. Feng, Energy Environ. Sci., 2016, 9, 478–483 CAS.
- J. Fan, Z. Chen, H. Shi and G. Zhao, Chem. Commun., 2016, 52, 4290–4293 RSC.
- A. Bergmann, E. Martinez-Moreno, D. Teschner, P. Chernev, M. Gliech, J. F. de Araujo, T. Reier, H. Dau and P. Strasser, Nat. Commun., 2015, 6, 8625 CrossRef CAS PubMed.
- T. Yousefi, R. Davarkhah, A. Nozad Golikand, M. Hossein Mashhadizadeh and A. Abhari, Prog. Nat. Sci.: Mater. Int., 2013, 23, 51–54 CrossRef.
- A. R. Harris, A. K. Neufeld, A. P. O'Mullane, A. M. Bond and R. J. S. Morrison, J. Electrochem. Soc., 2005, 152, C577–C583 CrossRef CAS.
- B. Scharifker and G. Hills, Electrochim. Acta, 1983, 28, 879–889 CrossRef CAS.
- M. S. Burke, M. G. Kast, L. Trotochaud, A. M. Smith and S. W. Boettcher, J. Am. Chem. Soc., 2015, 137, 3638–3648 CrossRef CAS PubMed.
- R. D. L. Smith, M. S. Prévot, R. D. Fagan, S. Trudel and C. P. Berlinguette, J. Am. Chem. Soc., 2013, 135, 11580–11586 CrossRef CAS PubMed.
- C.-C. Hu, J.-C. Chen and K.-H. Chang, J. Power Sources, 2013, 221, 128–133 CrossRef CAS.
- M. A. Sayeed, T. Herd and A. P. O'Mullane, J. Mater. Chem. A, 2016, 4, 991–999 CAS.
- K. W. Chung, K. B. Kim, S.-H. Han and H. Lee, J. Electrochem. Soc., 2005, 152, C560–C565 CrossRef CAS.
- X. Lu, Y. H. Ng and C. Zhao, ChemSusChem, 2014, 7, 82–86 CrossRef CAS PubMed.
- Z. Zhuang, W. Sheng and Y. Yan, Adv. Mater., 2014, 26, 3950–3955 CrossRef CAS PubMed.
- F. J. Pérez-Alonso, C. Adán, S. Rojas, M. A. Peña and J. L. G. Fierro, Int. J. Hydrogen Energy, 2015, 40, 51–61 CrossRef.
- C. S. Lim, C. K. Chua, Z. Sofer, K. Klimova, C. Boothroyd and M. Pumera, J. Mater. Chem. A, 2015, 3, 11920–11929 CAS.
- J.-C. Dupin, D. Gonbeau, P. Vinatier and A. Levasseur, Phys. Chem. Chem. Phys., 2000, 2, 1319–1324 RSC.
- A. P. O'Mullane and S. K. Bhargava, Electrochem. Commun., 2011, 13, 852–855 CrossRef.
- Y. Xue, X. Li, H. Li and W. Zhang, Nat. Commun., 2014, 5, 4348 CAS.
- L. D. Burke, A. J. Ahern and A. P. O'Mullane, Gold Bull., 2002, 35, 3–10 CrossRef CAS.
- J. Landon, E. Demeter, N. İnoğlu, C. Keturakis, I. E. Wachs, R. Vasić, A. I. Frenkel and J. R. Kitchin, ACS Catal., 2012, 2, 1793–1801 CrossRef CAS.
- M. W. Louie and A. T. Bell, J. Am. Chem. Soc., 2013, 135, 12329–12337 CrossRef CAS PubMed.
- W. Zhang, Y. Wu, J. Qi, M. Chen and R. Cao, Adv. Energy Mater., 2017, 7, 1602547 CrossRef.
- W. Zhang, J. Qi, K. Liu and R. Cao, Adv. Energy Mater., 2016, 6, 1502489 CrossRef.
- J. Qi, W. Zhang, R. Xiang, K. Liu, H.-Y. Wang, M. Chen, Y. Han and R. Cao, Adv. Sci., 2015, 2, 1500199 CrossRef PubMed.
- I. J. Godwin and M. E. G. Lyons, Electrochem. Commun., 2013, 32, 39–42 CrossRef CAS.
Footnote |
| † Electronic supplementary information (ESI) available: XPS data for as-deposited films and films after OER, XRD data, chronoamperometry data recorded at Au and GC electrodes and SEM images showing the effect of deposition time and potential. See DOI: 10.1039/c7ra07995h |
| This journal is © The Royal Society of Chemistry 2017 |

