
 Open Access Article
 This Open Access Article is licensed under a Creative Commons Attribution-Non Commercial 3.0 Unported Licence
Detection of phosphate based on phosphorescence of Mn doped ZnS quantum dots combined with cerium(III)†
Jin Qin,
Dongxia Li,
Yanming Miao and
Guiqin Yan *
*
Shanxi Normal University, Linfen, Shanxi 041000, China. E-mail: gqyan2013@163.com; Fax: +86-0357-2051249
First published on 3rd October 2017
Abstract
A simple and rapid room-temperature phosphorescence (RTP) sensor for phosphate detection was developed on the basis of Ce3+ modulated mercaptopropionic acid (MPA)-capped Mn-doped ZnS quantum dots (QDs). This sensor utilizes the affinity of lanthanides-phosphates and the RTP properties of doped QDs. Ce3+ can electrostatically interact with carboxyl groups on the surface of MPA-capped Mn-doped ZnS QDs, which leads to the aggregation of QDs and changes the RTP signals. The high affinity of phosphate to Ce3+ enables the dissociation of Ce3+ from the surface of MPA-capped ZnS QDs, forming a stable complex with phosphate and recovering the RTP of the QDs. Under the optimized conditions, the phosphate detection range is 8 to 320 μM (R = 0.9998) and the detection limit is 2.71 μM. Thus, the new sensor is potential for phosphate detection in environmental water without complicated pretreatment and is free from the interference of background fluorescence or scattering light.
1. Introduction
Eutrophication has become a global environmental problem in stagnant water bodies such as lakes, reservoirs, and estuaries. Phosphates are a group of well-known contaminants in ground and surface water, and the excess of phosphates usually leads to excessive algal growth followed by decomposition, depletion in dissolved oxygen, eutrophication, reduction in water quality1,2 and even the release of secondary metabolites of biotoxins. These harmful algal blooms can devastate local ecosystem, the fishing industry, water sports and leisure activities, and drinking water supply.3 In the natural water body without eutrophication, the limit standard of phosphate environmental quality was 0.02 mg L−1.4 Therefore, phosphate detection is of great significance for the control and guard of eutrophication. Up to now, many methods have been developed for quantitative analysis of phosphate, including colorimetry,5,6 fluorimetry,7–9 chromatography10 electrochemical method11,12 and enzymatic biosensors.13 However, further application of new methods is hampered due to the great time consumption, high cost and complicated pretreatment. Thus, development of sensitive, reliable and easy phosphate detection method is still highly demanded.Room-temperature phosphorescence (RTP) quantum dots (QDs) become a research hotspot in the field of optical sensors and are widely used to prepare different sensors.14–30 Owing to long lifetime and appropriate delay, RTP reserves high intensity after the termination of matrix fluorescence attenuation, and thus can avoid the interference of the background fluorescence and scattering light from other fluorescent substances.14,18 Moreover, since RTP is less frequent than fluorescence, RTP sensors are significantly more selective14 and no complex pretreatment is needed.18,23 Thus, the RTP of Mn-doped ZnS (Mn-ZnS) QDs can be utilized to detect environmental pollutants.
Owing to the high affinity with phosphates/phosphate esters, trivalent lanthanide ions are widely used to develop sensors for detection of physiological phosphates and phosphate-containing biomolecules.31–34 Ce3+ is the most abundant among rare earth elements and is superior with lower costs and accessible raw materials. Since Ce3+ is more affine to phosphates,35 Ce3+ will be potentially and widely used to detect phosphate pollutants in the environment.
In this study, we prepared the Ce3+/MPA-capped Mn-ZnS QDs nanohybrids and used them as an RTP sensor for phosphate detection. The principles of our phosphate sensing concept are shown in Fig. 1, Initially, Ce3+ ions can coordinate to the carboxylate groups on the surface of the MPA-capped Mn-ZnS QDs,36 where they act as a bridge for the induction of Mn-ZnS QDs aggregation. After phosphates were added to this system, the stronger interaction between phosphates and Ce3+ would result in the formation of more-stable hybrids, which competitively desorbed the Ce3+ from the surfaces of Mn-ZnS QDs, thus dispersing the Mn-ZnS-QDs/Ce3+ nanohybrids and restoring the RTP of Mn-ZnS QDs. Based on this principle, we built a phosphate phosphorescence detection sensor. This sensor is featured by simple operations and a wide detection range, and avoids the interferences from background fluorescence and scattering light. Besides, when used to detect the phosphates in real water, this sensor does not need complex pretreatment and thus is more practicable.
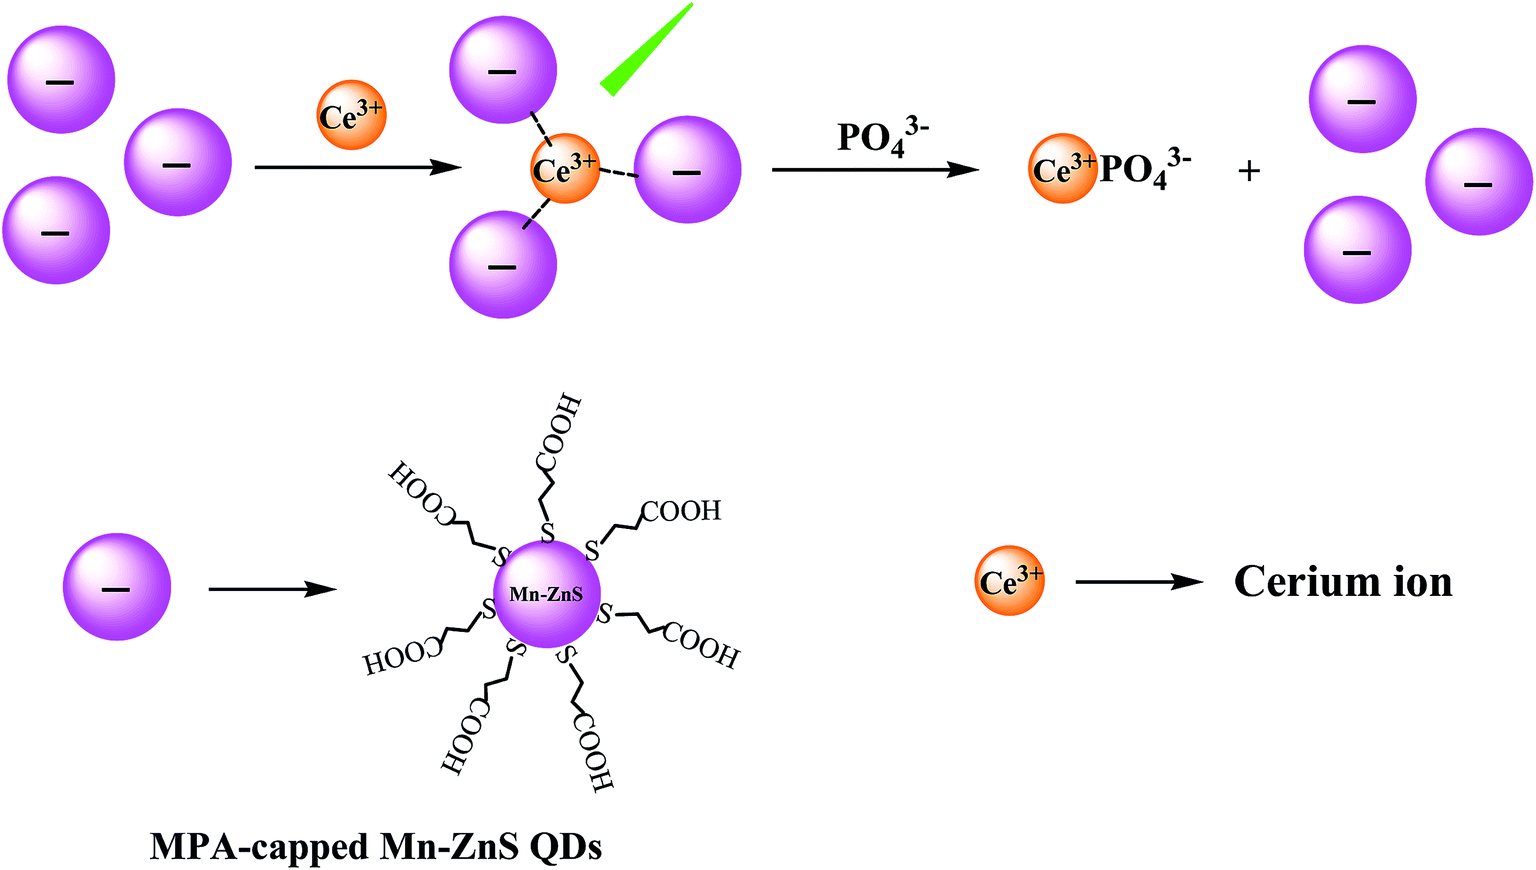 | ||
| Fig. 1 Design of phosphate sensors based on Mn-ZnS-QDs/Ce3+ nanohybrids. | ||
2. Materials and methods
2.1 Materials and apparatus
Mn-doped ZnS QDs were prepared from mercaptopropionic acid (MPA; J&K Scientific, Beijing, China), Mn(Ac)2·4H2O, Zn(Ac)2·2H2O and Na2S·9H2O (Tianjing Kermel Chemical Reagent Co., China). Ultrapure water (18.2 MΩ cm) was generated from a Water Pro water purification system (Labconco Corporation, Kansas City, MO). Ce(NO3)3·6H2O and Na3PO4 were purchased from Sigma Corporation of America.The morphology and microstructure of the QDs were characterized on a JSM-7500F transmission electron microscope (TEM, Japan). Phosphorescence was measured on a Cary Eclipse fluorescence spectrophotometer (Varian American Pty Ltd., America) in the phosphorescence mode, equipped with a plotter unit and a quartz cell (1 × 1 cm2). The slits for excitation and emission were both 10 nm wide. Ultraviolet/visible (UV/vis) absorption spectra were recorded using a Shimadzu UV-29100 UV/vis spectrophotometer. The pH meter was bought from Jinpeng Analytical Instruments Co. Ltd. (China). Rotatory evaporator was bought from Shanghai Yarong Instruments Co. Ltd. (China).
2.2 Synthesis of the Mn-doped ZnS QDs
The MPA-capped Mn Doped ZnS QDs were synthesized according to references with some modification.19,26 Briefly, a colloidal solution was synthesized in a 250 mL three-neck flask with pH electrodes, followed by addition of 180 μL of 0.04 M MPA, 5 mL of 0.1 M Zn(Ac)2, and 2 mL of 0.01 M Mn(Ac)2. The mixture was adjusted to pH 11 with 1 M NaOH and stirred under argon bubbling at room temperature for 30 min. Then 5 mL of 0.1 M Na2S was quickly injected into the solution under isolation from air. After 20 min of stirring, the solution was aged at 50 °C in open air for 2 h to form MPA-capped Mn-doped ZnS QDs. As for purification, the QDs were precipitated with the same volume of ethanol, centrifuged, washed with ethanol, and vacuum-dried at room temperature. The QD powder as-obtained was highly water-soluble.2.3 Analytical procedures
3. Results and discussion
3.1 Characterization of MPA-capped Mn-doped ZnS QDs
The size of Mn-ZnS QDs observed by TEM is about 3.5 nm (Fig. S1a†). The maximum excitation peak is 295 nm and the maximum emission peak is 590 nm; where hv1 is the fluorescence induced by ZnS surface defects; hv2 is the phosphorescence caused by the Mn2+ 4T1–6A1 transition (Fig. S1b†). After the ZnS matrix absorbed the excitation light, the holes were captured by Mn2+, while the electrons and holes separately compounded on Mn2+, leading to the stimulation of Mn2+ and finally forming an orange RTP emission (about 590 nm).37,383.2 Construction of Mn-ZnS QDs/Ce3+ sensor
As reported, some metal ions can efficiently induce the change of quantum photoluminescence.39–41 We first observed how Ce3+ would affect the RTP emission spectrum of Mn-ZnS QDs (Fig. 2). After Ce3+ was added into the Mn-ZnS QD solution, the RTP intensity of the Mn-ZnS QDs was enhanced with the increase of Ce3+ concentration and was maximized at the concentration of 4 μM Ce3+(Fig. 2a). Interestingly, when the Ce3+ concentration was above 4 μM, the RTP intensity of Mn-ZnS QDs stopped increasing, but declined (Fig. 2b). The RTP intensity of nanohybrids formed by Ce3+ and Mn-doped ZnS QDs is 10.4 times as large as that of Mn-doped ZnS QDs at the same concentration (Fig. 2c). This phenomenon indicates the high effects of the concentrations of Ce3+ and Mn-doped ZnS QDs on the RTP intensity of the nanohybrids. Thereby, we deduce this phenomenon is mainly attributed to the Ce3+-induced QDs aggregation. Since the excess of Ce3+ would affect the systematic response and given the stability and sensitivity of the detection system, we selected the concentration of 4 μM Ce3+ in the subsequent trials. | ||
| Fig. 2 Ce3+ concentration-dependent RTP emission of the MPA-capped Mn-doped ZnS QDs. (a, b) The change of the RTP intensity with the increase of the concentration of Ce3+; (c) the plot of RTP intensity with the increase of the concentration of Ce3+. | ||
3.3 Principle of Mn-ZnS-QDs/Ce3+ sensor construction
The MPA that capped the surfaces of Mn-ZnS QDs not only enhanced the water-solubility of the QDs, but also endowed the dot surfaces with abundant carboxyl. Thereby, the Ce3+ could coordinately complex with the surface carboxyl, forming Mn-ZnS QDs/Ce3+ nanohybrids, leading to the aggregation of QDs. The dot surface defects induced by electrons–holes would generate a local electric field.42,43 After the addition of Ce3+, the distances between the Mn-ZnS QDs were shortened, which enhanced the Coulomb force of Mn-ZnS QDs. As a result, the local electric field around the QDs was enhanced, which induced the QDs to produce more-effective excitation,44 so more energy was transferred from the surface holes of Mn-ZnS QDs to Mn2+ and finally the RTP intensity of Mn-ZnS QDs was significantly enhanced.17,45 However, the number of carboxyl binding sites on the surfaces of the QDs was finite, so when the Ce3+ concentration around the QDs was saturated, the QDs would be dispersed (Fig. 3a). | ||
| Fig. 3 (a) Schematic illustration of fabricating Mn-ZnS QDs after the addition of Ce3+; (b, c) RLS spectra of the Mn-ZnS QDs in the presence of different concentrations of Ce3+; (d) the absorption spectra of QDs in the presence of various concentrations of Ce3+. | ||
When two substances aggregate through interaction and produce scattering particles, they can generate very remarkable resonance light scattering (RLS) signals. By analyzing the RLS spectrum of Ce3+ and Mn-ZnS QDs interaction, we find the Mn-ZnS QDs emitted low RLS within the wavelength of 200–700 nm. However, after Ce3+ was slowly added into the Mn-ZnS QDs solution, the RLS intensity in the reaction system was gradually enhanced (maximum absorption peak was 395 nm) (Fig. 3b), indicating the Mn-ZnS QDs and Ce3+ interacted to form larger scattering particles. With the increase of Ce3+ concentration above 4 μM, the RLS intensity in the reaction system was gradually weakened (Fig. 3c), indicating the QDs were dissociated. The Mn-ZnS QDs and Ce3+ aggregated due to electrostatic attraction, but the QDs were dissociated when the Ce3+ concentration around the QDs was saturated. Further ultraviolet spectral analysis shows that with the increase in Ce3+ concentration, the absorption peaks of MPA-capped Mn-ZnS QDs within 240–360 nm were gradually enhanced (Fig. 3d), which validate the interaction between Ce3+ and Mn-ZnS QDs.
3.4 Influence factors on stability of Mn-ZnS QDs/Ce3+ nanohybrids
To enhance the stability and selectivity of the new sensor during phosphate detection, we investigated the effects of pH, reaction time and salt concentrations. As showed in Fig. S2a,† within pH 6.5–7.5, the RTP intensity of the three reaction systems stabilized. Given the precipitation of rare earth ions under base conditions, we selected the pH 7.4 in the following measurements. Meanwhile, the Mn-ZnS QDs/Ce3+ nanohybrids within 60 min and under the high concentration of salts basically were maintained stable.3.5 Detection of phosphate by Mn-ZnS/Ce3+ nanohybrids
Under the above optimal conditions, we studied the relationship between the RTP intensity of Mn-ZnS QDs/Ce3+ nanohybrids and the phosphate concentration. As showed in Fig. 4a, with the rise of phosphate concentration, the RTP intensity of the Mn-ZnS QDs/Ce3+ nanohybrids was regularly quenched, indicating the RTP sensor of Mn-ZnS QDs/Ce3+ nanohybrids can be used to detect phosphates. The linearity between the RTP quenching value of Mn-ZnS QDs/Ce3+ nanohybrids (ΔRTP) and the phosphate concentration under the optimal conditions was obtained (Fig. 4b). | ||
| Fig. 4 (a) Phosphate concentration-dependent RTP emission of the Mn-ZnS QDs/Ce3+. (b) The relationship between ΔRTP and the phosphate concentration. | ||
Fig. 5a shows the UV-vis spectra of phosphate (curve 1), Ce3+ (curve 2) and Mn-ZnS QDs (curve 3). With the addition of Ce3+, the spectra of the Mn-ZnS QDs were enhanced (curve 4). With the addition of phosphate into the Mn-ZnS QDs and Ce3+ mixed solution, the ultraviolet spectra of the Mn-ZnS QDs were further enhanced and red-shifted (curve 5). These changes indicate there is interaction between the Mn-ZnS QDs and Ce3+ and between phosphate and Mn-ZnS QDs/Ce3+ nanohybrids. The ultraviolet spectra of Ce3+/phosphate binding (Fig. 5b) show that the UV intensity of single phosphate was very weak, and with the rise of Ce3+ concentration within 0–2 μM, the UV absorption intensity of the phosphate was gradually enhanced and significantly red-shifted, indicating the Ce3+ and phosphate formed larger scattering particles.
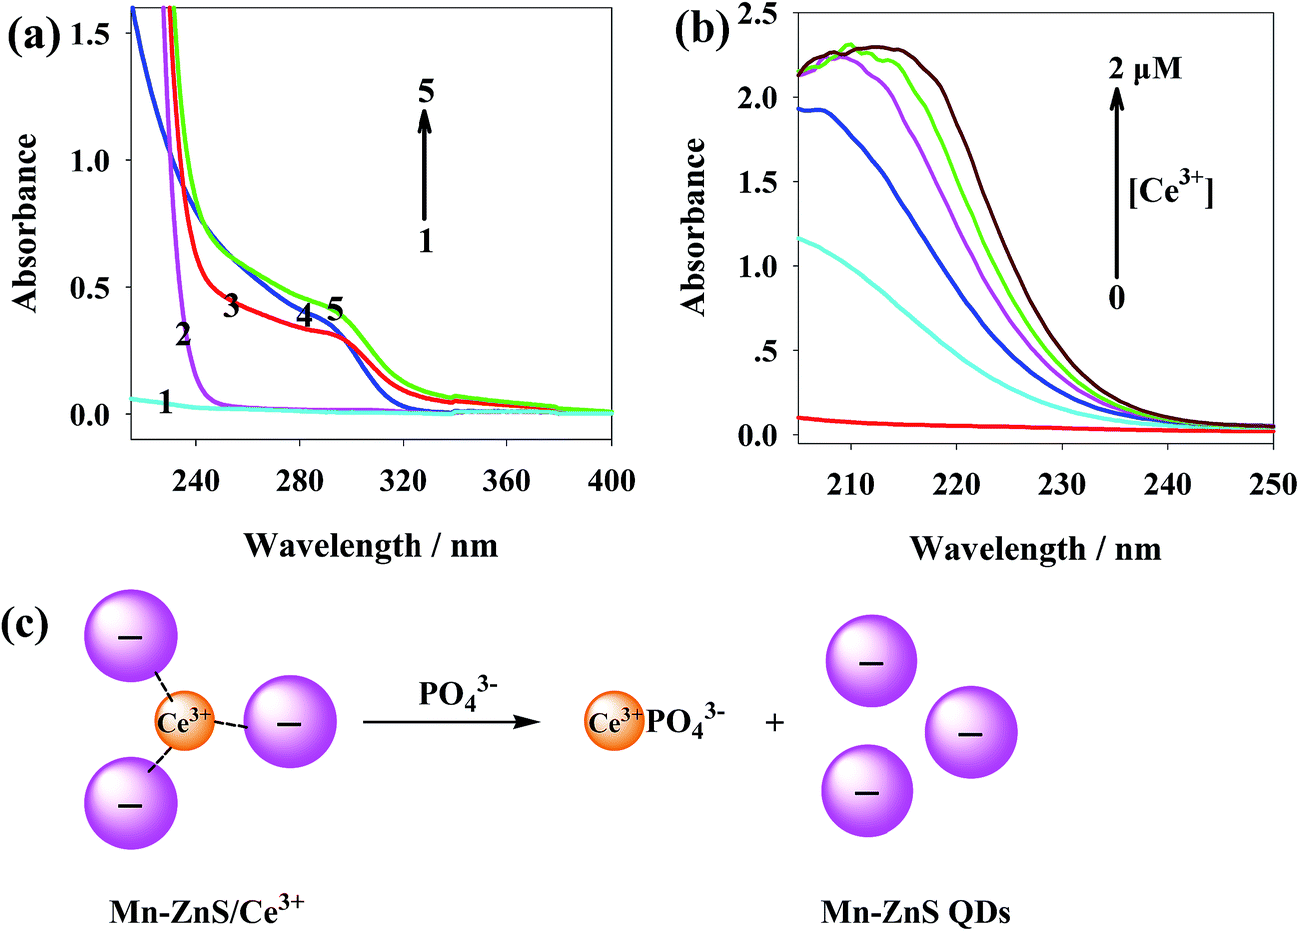 | ||
| Fig. 5 (a) UV-vis absorption spectra of (1) phosphate, (2) Ce3+, (3) Mn-ZnS QDs, (4) Mn-ZnS QDs/Ce3+ nanohybrids, (5) Mn-ZnS QDs/Ce3++ phosphate; (b) absorption spectra of phosphate in the presence of different concentrations of Ce3+; (c) schematic illustration of fabricating Mn-ZnS QDs/Ce3+ after the addition of phosphate. | ||
As showed in Fig. 5c, the addition of PO43− significantly reduced the clustering of QDs. Though Ce3+ could bind with carboxyl, Ce3+ was more affine to phosphates.34 As reported, the complexation constant between PO43− and Ce3+ was far larger than that between carboxyl and Ce3+.46,47 Thus, the addition of phosphates destroyed the aggregation of the Mn-ZnS QDs/Ce3+ nanohybrids, and the phosphate and Ce3+ formed more-stable hybrids, which dispersed the QDs to the solution again and recovered the phosphorescence. Given that phosphates could restore the RTP intensity of the reaction system, we thereby built a novel RTP sensor for phosphate detection.
Under the optimal conditions, this new sensor has high linearity in phosphate detection within the range of 8–320 μM, with a linear equation of ΔRTP = 78.4x − 73.6 (R = 0.9998) and a detection limit of 3σ = 2.71 μM. We continuously detected both a phosphate-free solution and a 80 μM phosphate solution for 11 times, and got the relative standard deviation of 3.1%. Compared with other phosphate measurement methods (Table 1), this new sensor has a detection limit lower than colorimetry,6 higher than AuNPs based colorimetric method,5 fluorescence method9 and electrochemical method,13 but its linear range is broader than these methods. Besides, the phosphorescence detection system efficiently avoids the interferences from background fluorescence and scattering light. Moreover, the QDs-based RTP method does not need deoxidant or other inducers and sophisticated electrode modification. Thus, this method is more feasible for phosphate detection in complex water samples.
3.6 Interferences from coexisting substances
Considering the promise of the Mn-ZnS QDs/Ce3+ sensor system for application in environmental fields, the selectivity of the phosphorescence sensor for phosphate was evaluated. This was achieved by monitoring the RTP responses of the Mn-ZnS QDs/Ce3+ complex upon addition of phosphate and some coexisting substances, including anions such as Cl−, Br−, I−, SO42−, SO32−, CO32−, NO3−, NO2−, cations such as Ca2+, Mg2+, Ba2+, Ni2+, Al3+, Fe3+, Cr3+, and amino acids such as serine (Ser), histidine (His), all of which were kept at a concentration twenty times higher than that of phosphate. As shown in Fig. 6, phosphate can significantly restore the RTP intensity of the Mn-ZnS QDs/Ce3+ complex in the presence of all potential competitors tested. In contrast, no clear enhancement is observed with any other ions or amino acids. The results demonstrate that this RTP probe is highly selective for phosphate. This high specificity could be attributed to the specific and robust affinity between Ce3+ ions and phosphate. These properties are important for investigating environmental samples.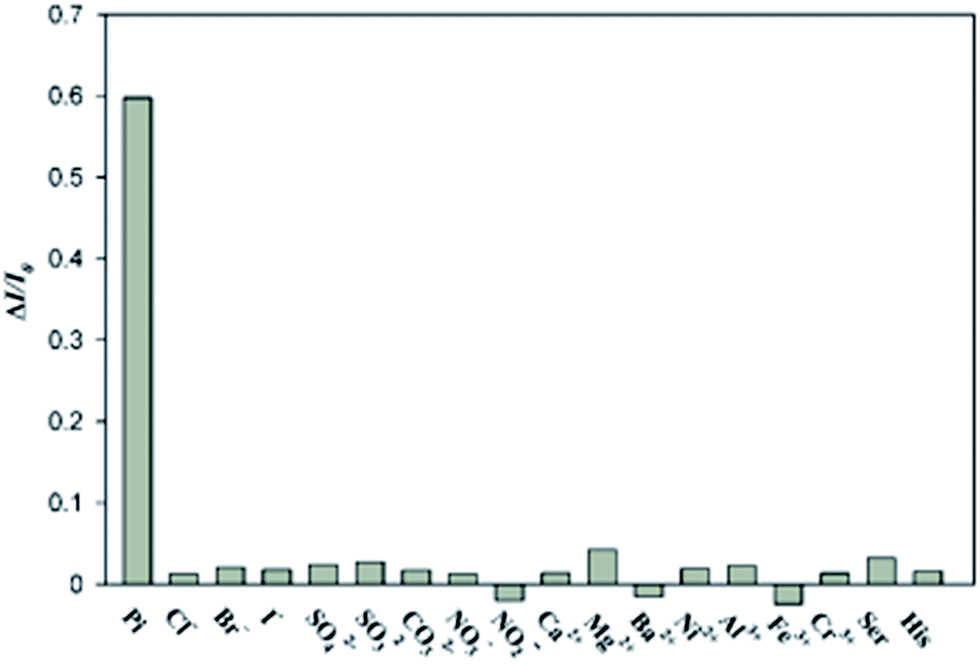 | ||
| Fig. 6 Selectivity of the RTP assay for phosphate over other substances. The concentration of phosphate was 100 μM and that of other substances was 2000 μM. | ||
3.7 Sample analysis
The excellent specificity combined with high sensitivity and fast response of the Mn-ZnS QDs/Ce3+ complex to phosphate suggests that this method might be directly applied to detecting phosphate in real samples. Therefore, we examined the practicality of the assay for phosphate detection in environmental. Water samples were collected from Fen River, Yuxiu lake. The samples were filtrated with 0.45 μm filter, rotationally evaporated, and concentrated 30 times before analysis. The concentration of phosphate was determined experimentally (Table 2). Clearly, when this sensor was used to detect phosphate concentrations in real water samples, the spiked recovery rates were 92.4–106.6%, indicating the detections were reliable.| Water samples | Ammonium molybdate method (μM) | Spiked (μM) | Measured (μM) | RSD (%) | Recovery (%) |
|---|---|---|---|---|---|
| Fenhe | 0.5 | 0 | 0.6 | 4.12 | — |
| 76.1 | 80 | 74.5 | 3.06 | 92.4 | |
| 163.4 | 160 | 171.2 | 2.87 | 106.6 | |
| Yuxiu lake | 3.1 | 0 | 2.9 | 3.74 | — |
| 87.2 | 80 | 86.3 | 3.43 | 104.2 | |
| 155.3 | 160 | 153.7 | 2.45 | 94.3 |
4. Conclusions
We designed a simple and rapid phosphate RTP sensor. This sensor eliminated complex sample pretreatment and avoided the interferences of background fluorescence and scattering light from fluorescent substances. The example of the use of ZnS QDs was environmentally friendly and easily prepared. With high sensitivity and wide linear range, this sensor can be promising as versatile probes in the environmental in the future.Conflicts of interest
There are no conflicts to declare.Acknowledgements
This work was supported by the Research Fund for the Doctoral Program of Higher Education of China (NO. 20111404110002). Fund for Construction Program of Chemical Advantage and Key Discipline of Shanxi Province of China (NO. 912019).References
- C. Warwick, A. Guerreiro and A. Soares, J. Biosens. Bioelectron., 2013, 41, 1–11 CrossRef CAS PubMed.
- A. T. Law al and S. B. Adeloju, Talanta, 2013, 114, 191–203 CrossRef CAS PubMed.
- J. Heisler, P. M. Glibert, J. M. Burkholder, D. M. Anderson, W. Cochlan, W. C. Dennison, Q. Dortch, C. J. Gobler, C. A. Heil, E. Humphries, A. Lewitus, R. Magnien, H. G. Marshall, K. Sellner, D. A. Stockwell, D. K. Stoecker and M. Suddleson, Eutrophication and harmful algal blooms: a scientific consensus, Harmful Algae, 2008, 8, 3–13 CrossRef CAS PubMed.
- USEPA, Nutrient Criteria Technical Guidance Manual, Office of Science and Technology, U.S. EPA, Washington, DC, 2000 Search PubMed.
- W. Liu, Z. Du, Y. Qian and F. Li, Sens. Actuators, B, 2013, 176, 927–931 CrossRef CAS.
- G. He, L. Zhao, K. Chen, Y. Liu and H. Zhu, Talanta, 2013, 106, 73 CrossRef CAS PubMed.
- H. X. Zhao, L. Q. Liu, Z. D. Liu, Y. Wang, X. J. Zhao and C. Z. Huang, Chem. Commun., 2011, 47, 2604–2606 RSC.
- J. M. Bai, L. Zhang, R. P. Liang and J. D. Qiu, Chem.– Eur. J., 2013, 19, 3822–3826 CrossRef CAS PubMed.
- M. R. Ganjali, M. Hosseini, Z. Memari, F. Faridbod, P. Norouzi, H. Goldooz and A. Badiei, Anal. Chim. Acta, 2011, 708, 107–110 CrossRef CAS PubMed.
- M. Colina and P. H. E. Gardiner, J. Chromatogr. A, 1999, 847, 285–290 CrossRef CAS.
- W. H. Lee, Y. Seo and P. L. Bishop, Sens. Actuators, B, 2009, 137, 121–128 CrossRef PubMed.
- W. L. Cheng, J. W. Sue, W. C. Chen, J. L. Chang, J. M. Zen and A. Chem, J. Anal. Chem., 2010, 82, 1157 CAS.
- L. Gilbert, A. T. A. Jenkins, S. Browning and J. P. Hart, Sens. Actuators, B, 2011, 160, 1322–1327 CrossRef CAS.
- J. M. Costa-Fernández, R. Pereiro and A. Sanz-Medel, TrAC, Trends Anal. Chem., 2006, 25, 207–218 CrossRef.
- J. M. Traviesaalvarez, I. Sánchezbarragán, J. M. Costafernández, R. Pereiro and A. Sanzmedel, Analyst, 2007, 132, 218–223 RSC.
- Y. He, H. F. Wang and X. P. Yan, J. Anal. Chem., 2008, 80, 3832–3837 CAS.
- Y. He, H. F. Wang and X. P. Yan, Chem.–Eur. J., 2009, 15, 5436–5440 CrossRef CAS PubMed.
- P. Wu, Y. He, H. F. Wang and X. P. Yan, J. Anal. Chem., 2010, 82, 1427–1433 CAS.
- W. S. Zou, D. Sheng, X. Ge, J. Q. Qiao and H. Z. Lian, J. Anal. Chem., 2011, 83, 30–37 CAS.
- P. Wu, L. N. Miao, H. F. Wang, X. G. Shao and X. P. Yan, Angew. Chem., Int. Ed., 2011, 50, 8118–8121 CrossRef CAS PubMed.
- C. X. Yang and X. P. Yan, J. Anal. Chem., 2011, 83, 7144–7150 CAS.
- H. B. Ren and X. P. Yan, Talanta, 2012, 97, 16–22 CrossRef CAS PubMed.
- E. Sotelo-Gonzalez, M. T. Fernandez-Argüelles, J. M. Costa-Fernandez and A. Sanz-Medel, Anal. Chim. Acta, 2012, 712, 120–126 CrossRef CAS PubMed.
- H.-F. Wang, Y.-Y. Wu and X.-P. Yan, J. Anal. Chem., 2013, 85, 1920–1925 CAS.
- P. Wu and X. P. Yan, Chem. Soc. Rev., 2013, 2013(42), 5489 RSC.
- Y. Miao, Z. Zhang, Y. Gong and G. Yan, J. Biosens. Bioelectron., 2014, 59, 300–306 CrossRef CAS PubMed.
- Y. Miao, Z. Zhang, Y. Gong, Q. Zhang and G. Yan, J. Biosens. Bioelectron., 2014, 52, 271–276 CrossRef CAS PubMed.
- P. Wu, T. Zhao, J. Zhang, L. Wu and X. Hou, J. Anal. Chem., 2014, 86, 10078–10083 CAS.
- P. Wu, J. Zhang, S. Wang, A. Zhu and D. X. Hou, Chem.– Eur. J., 2014, 20, 952–956 CrossRef CAS PubMed.
- P. Wu, T. Zhao, Y. Tian, L. Wu and D. X. Hou, Chem.–Eur. J., 2013, 19, 7473–7479 CrossRef CAS PubMed.
- J. Massue, S. J. Quinn and T. Gunnlaugsson, J. Am. Chem. Soc., 2008, 130, 6900 CrossRef CAS PubMed.
- E. A. Weitz, J. Y. Chang, A. H. Rosenfield and V. C. Pierre, J. Am. Chem. Soc., 2012, 134, 16099 CrossRef CAS PubMed.
- S. Nadella, J. Sahoo, P. S. Subramanian, A. Sahu, S. Mishra and M. Albrecht, Chem.–Eur. J., 2014, 20, 6047–6053 CrossRef CAS PubMed.
- M. Schäferling and O. S. Wolfbeis, Chem.–Eur. J., 2007, 13, 4342–4349 CrossRef PubMed.
- R. Samy, P. J. Faustino, W. Adams, L. Yu, M. A. Khan and Y. Yang, J. Pharm. Biomed. Anal., 2010, 51, 1108–1112 CrossRef CAS PubMed.
- H. S. Huh and S. W. Lee, Bull. Korean Chem. Soc., 2006, 27, 1839–1843 CrossRef CAS.
- R. Thakar, Y. Chen and P. T. Snee, Nano Lett., 2007, 7, 3429 CrossRef CAS PubMed.
- J. H. Chung, C. S. A. And and D. J. Jang, J. Phys. Chem. B, 2001, 105, 4128–4132 CrossRef CAS.
- Y. Gong and Z. Fan, J. Biosens. Bioelectron., 2015, 66, 533–538 CrossRef CAS PubMed.
- Z. Zhang, Y. Miao, L. Lian and G. Yan, Anal. Biochem., 2015, 489, 17–24 CrossRef CAS PubMed.
- Y. Shen, S. Liu, J. Yang, L. Wang, X. Tan and Y. He, Sens. Actuators, B, 2014, 199, 389–397 CrossRef CAS.
- D. J. Norris, A. Sacra, C. B. Murray and M. G. Bawendi, Phys. Rev. Lett., 1994, 72, 2612–2615 CrossRef CAS PubMed.
- V. I. Klimov, J. Phys. Chem. B, 2000, 104, 6112–6123 CrossRef CAS.
- O. Kulakovich, N. Strekal, A. Yaroshevich, S. Maskevich, S. Gaponenko, I. Nabiev, A. Ulrike Woggon and M. Artemyev, Nano Lett., 2002, 2, 1449–1452 CrossRef CAS.
- Y. Hou, J. Ye, Z. Gui and G. Zhang, Langmuir, 2008, 24, 9682–9685 CrossRef CAS PubMed.
- J. Galea, R. Beccaria, G. Ferroni and J. P. Belaich, Electrochim. Acta, 1978, 23, 647–652 CrossRef CAS.
- J. E. Powell, J. L. Farrell, W. F. S. Neillie and R. Russell, J. Inorg. Nucl. Chem., 1968, 30, 2223–2231 CrossRef CAS.
Footnote |
| † Electronic supplementary information (ESI) available. See DOI: 10.1039/c7ra07991e |
| This journal is © The Royal Society of Chemistry 2017 |