 Open Access Article
Production of carbonaceous microspheres from wood sawdust by a novel hydrothermal carbonization and extraction method
Qingxin Zheng ,
Masato Morimoto* and
Toshimasa Takanohashi*
Non-conventional Carbon Resources Group, Research Institute of Energy Frontier, National Institute of Advanced Industrial Science and Technology (AIST), 16-1 Onogawa, Tsukuba 305-8569, Japan. E-mail: m.morimoto@aist.go.jp; toshi-takanohashi@aist.go.jp
First published on 29th August 2017
Abstract
Here we present the production of monodispersed carbonaceous microspheres directly from wood sawdust by a novel hydrothermal method, combining hydrothermal carbonization and hydrothermal extraction. This is the first time to obtain high-quality carbonaceous microspheres from crude biomass except carbohydrates, the morphology of which is quite different from the hydrochar obtained from woody biomass by traditional hydrothermal carbonization processes. Carbonaceous microspheres obtained from two wood sawdust samples have uniform spherical morphologies and yields as high as ≥16%, with sizes ranging from 0.1 to 6.9 μm. The analysis of yields and functional groups on the surface indicates that these carbonaceous microspheres were formed from the extraction of hydrochar, and it forecasts that this novel hydrothermal method will be effective with different wood feedstocks. Based on the evidence of morphology, yield, elemental composition, and functional groups, an initial mechanism was proposed to explain the production of carbonaceous microspheres from wood sawdust. During the hydrothermal treatment, a liquid-phase precursor formed first from the carbonization of wood sawdust and extraction of hydrochar, together with some decarboxylation reactions, and then carbonaceous microspheres appeared from this precursor and grew during the cooling process. This research opened a new door for the application of wood sawdust, and extended the sources of carbonaceous microspheres greatly.
1 Introduction
Carbonaceous microspheres (CM) have been used widely in the fields of materials science, chemistry, biology, and medicine.1–8 Particularly in the field of materials science, CM are always used as a resource for carbon nano/microspheres and as templates to produce inorganic or composite materials with hollow, core/shell, porous, or other structures, as displayed in Fig. 1.2,3,5,8,9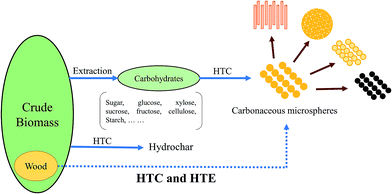 | ||
| Fig. 1 Diagram of previous research and our concept (dotted line). HTC: hydrothermal carbonization. HTE: hydrothermal extraction. | ||
Biomass, which is available in high quality and large amounts worldwide, is an environmental friendly renewable resource for energy, chemicals, and materials.9–11 Using water as the only medium, the hydrothermal carbonization (HTC) process has been shown to be a green and suitable method for the conversion of biomass to a value-added solid product, referred as hydrochar.9,12 All the chemistry and technology based on HTC products are essentially sustainable, close to ‘CO2 neutral’ operations.9
The HTC process was first proposed as a method to study the coalification of cellulose in 1913 by Bergius.9 At the beginning of the 21st century, Wang and co-workers reported the synthesis of hydrochar with uniform spherical morphology from sugar by HTC process.13 That was the first report about the production of CM from biomass. Then, in the next dozen years, a series of CM with similar morphology and micron scale were produced using HTC without any other solvent or additive from various carbohydrate biomasses, such as sugars, glucose, xylose, sucrose, fructose, cellulose and starch.9,14–19 In addition, CM can also be obtained from some waste biomasses, such as olive oil waste and hazel nutshell,20 while the quality of spheres obtained from waste biomasses are clearly lower than those from carbohydrates, which was attributed to the lignin and cellulose contents of the waste biomasses, reported by Aydincak and co-workers.20
So far biomass have become a very important resource for CM, and the biomass resources for production of high-quality CM by HTC are still limited to carbohydrates. Because carbohydrates extracted from crude biomass are highly sought-after, expensive, and important energy sources for human foods, it would be more sustainable, economical, and appropriate to produce high-quality CM from a crude feedstock or waste biomass, such as wood sawdust.
Previously, HTC has been applied to wood sawdust using a batch autoclave.21–26 Hydrochars obtained from the HTC of woods are generally composed of bulk materials with a porous structure, irrelevant to CM.21,23,26 Although some sphere-like microparticles were found on the surface of the larger particles in eucalyptus sawdust-based hydrochar, it was believed that they originated from the decomposition of cellulose during HTC process.24,25 It is challenging to realize the production of high-quality CM from wood sawdust due to its complex composition. Thus, a novel HTC process is required; if such as process could be developed, wood sawdust would be a cheap, sustainable, and abundant resource for the production of CM.
Here, we described a novel route to produce CM directly from wood sawdust, by combining a traditional HTC process and a hydrothermal extraction (HTE) process using a semi-continuous system, as shown in Fig. 1.
2 Experimental
2.1 Materials
In the experiments, two wood sawdust samples, from Japanese red pine (JRP) and Japanese beech (JB), were used as feedstocks. Table 1 shows the ultimate and proximate analyses of JRP and JB, including elemental compositions, fixed carbon (FC) contents, volatile matter (VM) contents, ash contents, and water contents (moisture). Both of two wood sawdust samples have no nitrogen or sulphur, and contain a little amount of ash.| Sample name | Ultimate analysis [wt%, daf] | Proximate analysis [wt%, db] | Moisture [wt%] | ||||||
|---|---|---|---|---|---|---|---|---|---|
| C | H | N | S | O (diff.) | FC | VM | Ash | ||
| JRP | 48.6 | 6.1 | 0 | 0 | 45.3 | 17.8 | 82.1 | 0.1 | 9.7 |
| JRP-CM | 69.3 | 5.4 | 0 | 0 | 25.3 | 45.1 | 54.8 | 0.1 | — |
| JRP-HC | 64.8 | 4.6 | 0 | 0 | 30.6 | 29.8 | 70.1 | 0.1 | — |
| JB | 48.8 | 6.0 | 0 | 0 | 45.2 | 13.5 | 86.4 | 0.1 | 9.3 |
| JB-CM | 66.0 | 5.7 | 0 | 0 | 28.3 | 36.2 | 63.7 | 0.1 | — |
| JB-HC | 62.3 | 4.4 | 0 | 0 | 33.3 | 43.4 | 56.5 | 0.1 | — |
2.2 Production of CM
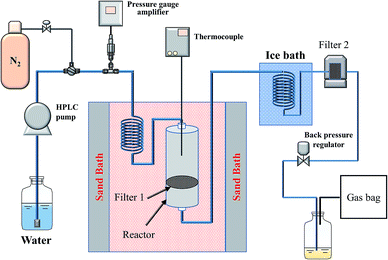
A schematic diagram of the semi-continuous reactor is shown in Fig. 2, as reported previously.27–30 In a typical experiment, 1.5 g of wood sawdust (JRP or JB) was placed on a filter (Filter 1 in Fig. 2, Swagelok, SUS316; outer diameter: 11.2 mm; pore size: 0.5 μm) in the reactor. Distilled water was supplied continuously to the system at a flow rate of 1 mL min−1 using a high-performance liquid chromatography (HPLC) pump. By controlling a back pressure regulator, the pressure of system (between HPLC pump and the back pressure regulator) was increased and maintained at a certain pressure (10 MPa for JRP and 4 MPa for JB). After the reactor was put into a preheated fluidized sand bath, the temperature of reactor increased to the target temperature (300 °C for JRP and 250 °C for JB) at a rate of 30 °C min−1 and kept for 60 min. After the experiment, the water flow was stopped and the reactor was removed from the sand bath. The system was cooled to room temperature and the pressure was released after flushing the system with nitrogen. The reactor and Filter 2 (an additional filter located downstream of the cooling system; pore size: 0.5 μm) in Fig. 2 were dried in a vacuum at 80 °C for 24 h and weighed. Finally, black residues (hydrochar, referred as HC) and brown-yellow solid products (CM) were collected from the reactor and Filter 2, respectively. Their quantities were calculated by subtracting the blank weights. Gaseous products were collected in a gas bag and the volume was measured with a cylinder. CM and HC obtained from JRP and JB were denoted as JRP-CM, JB-CM, JRP-HC, and JB-HC, respectively, as shown in Table 1.2.3 Characterizations
The composition of the gas fraction was analyzed with a natural gas analyzer (GL Science Inc.) with two columns of 3 m packed with Porapak Q and Molecular Sieve 5A for CO2, CO, H2, and CH4. The elemental compositions of feedstocks, HC, and CM were determined using a CHNS analyzer (FLASH 2000, Thermo Scientific). The amounts of ash, fixed carbon (FC), and volatile matter (VM) were determined according to ASTM D3172 using a thermobalance (TG 8121, Rigaku Corporation) in an air or nitrogen atmosphere. Microscopic morphology was assessed by field-emission scanning electron microscopy (FE-SEM, 1.5 kV, JSM-7400F, JEOL) and transmission electron microscopy (TEM, 120 kV, EM-002B, TOPCON). CM samples were examined by FE-SEM after being coated with Ni/Pt nanoparticles. The functional groups on the surface of solid samples were tested by attenuated total reflectance Fourier transform infrared spectroscopy (ATR-FTIR, Agilent Technologies, Cary 630 FTIR). To compare FTIR spectra of sawdust and products obtained and to determine peak heights, the spectra were baseline corrected and vector-normalized using software MestReNova Version 8.1.2 (Mestrelab Research S.L.).The yield of product was calculated by the proportion of its weight to the total mass without water and ash. Carbon percentage of product was calculated by the proportion of its carbon amount to the total carbon amount.
3 Results and discussion
3.1 Morphology
Fig. 3 shows the SEM and TEM images of JRP-CM and JB-CM. It indicates that both JRP-CM and JB-CM are composed of particles with uniform spherical morphology and micron scale, showing that high-quality CM were produced from wood sawdust. Based on the TEM images in Fig. 2b, it was confirmed that CM in JRP-CM have a smooth surface without a hollow interior, whereas some microspheres with a porous structure were found in JB-CM, as shown in Fig. 3c and d. The sizes of CM in JRP-CM and JB-CM were distributed in the ranges of 0.1–3.9 μm and 0.2–6.9 μm, respectively. As shown in Fig. 3e and f, most microspheres in JRP-CM had a diameter below 1 μm, and the sizes of the JB-CM microspheres were distributed normally and centred on 1.2 μm. This is the first report about the production of high-quality CM from woody biomass directly, the morphology of which is quite different from the hydrochar obtained from woody biomass by traditional HTC processes.23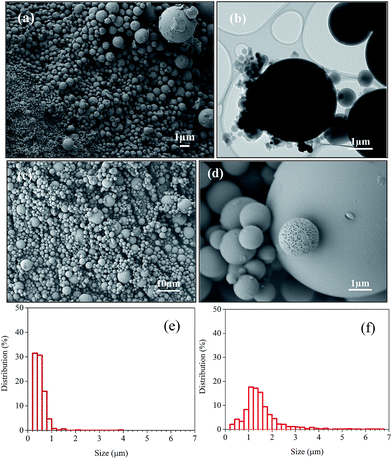 | ||
| Fig. 3 Morphology of JRP-CM and JB-CM. (a, b and e) SEM, TEM images, and size distribution of JRP-CM, respectively, and (c, d and f) SEM images and size distribution of JB-CM. | ||
As a contrast, the morphologies of JRP-HC and JB-HC were characterized and shown in Fig. 4. The hydrochars produced from both JRP and JB were in bulky sheets with micro/nano-porous structures on the surfaces. This kind of morphology is consistent with that obtained from woody biomass by traditional HTC processes, and indicates its possible application as activated carbon.21–23
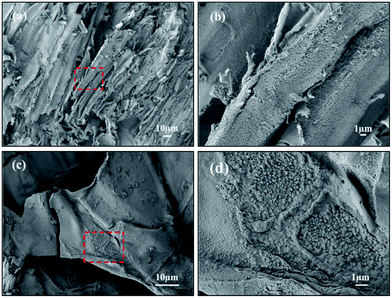 | ||
| Fig. 4 SEM images of (a and b) JRP-HC and (c and d) JB-HC. (b and d) are enlargements of red box areas in (a and c), respectively. | ||
3.2 Yield
Fig. 5 shows the yields and carbon percentages of products obtained from JRP and JB during HTC and HTE process. The yields of JRP-HC and JB-HC were 11% and 13%, respectively, lower than those of JRP-CM and JB-CM, which were 21% and 16%, respectively. The carbon percentages of CM and HC are higher than the corresponding yields, which can be attributed to the high carbon contents of CM and HC. The sum yields of HC and CM for JRP and JB were 44% and 39%, similar to that of hydrochar obtained by traditional HTC processes.26 This is evidence of the coexistence of HTC and HTE in our process, and that CM form from the extract.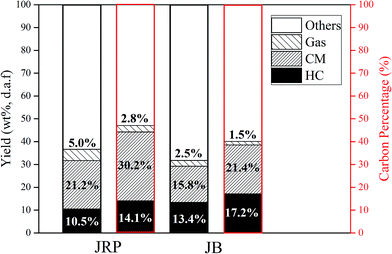 | ||
| Fig. 5 Yields (black-color frame) and carbon percentages (red-color frame) of products obtained from wood sawdust during the HTC and HTE process. | ||
3.3 Composition and functional groups
In order to disclose the formation mechanism of CM, it is necessary to study the relationship between CM and HC. The elemental compositions of CM and HC obtained from JRP and JB are shown in Table 1. Compared with the feedstocks, both CM and HC have increased carbon contents and decreased hydrogen and oxygen contents. The elemental compositions of CM and HC obtained from the same feedstock are approximate; in general CM have higher carbon and hydrogen contents and lower oxygen contents than HC. Furthermore, the H/C versus O/C van Krevelen diagrams of JRP, JB, JRP-CM, JRP-HC, JB-CM, JB-HC, carbohydrates, and hydrochars obtained from various carbohydrates by the traditional HTC processes are shown in Fig. 6. It can be seen that both CM and HC obtained from JRP and JB, and hydrochars obtained from carbohydrates, are the products of the dehydration of the raw materials. In the H/C versus O/C van Krevelen diagram, CM and HC are located in a close region, and the position of CM is in the downstream of HC along with the decarboxylation line, suggesting that during the hydrothermal process, some decarboxylation reactions occurred with the emission of carbon dioxide, as shown in Table 2.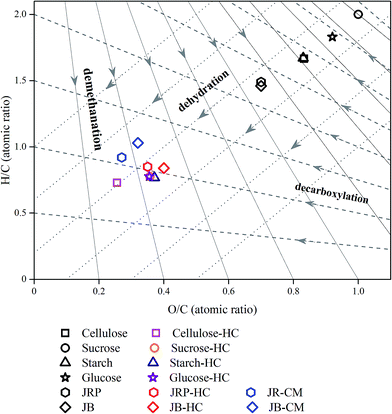 | ||
| Fig. 6 H/C versus O/C van Krevelen diagram of different carbohydrates, HC resulting from HTC of carbohydrates,17 wood sawdust samples, and CM and HC obtained from them. | ||
| Wood sawdust | JRP | |
|---|---|---|
| Gaseous products | CO2 | H2 |
| Mass% | 99.85 | 0.15 |
| Mol% | 96.83 | 3.17 |
| Wood sawdust | JB | ||
|---|---|---|---|
| Gaseous products | CO2 | CH4 | H2 |
| Mass% | 94.85 | 4.53 | 0.62 |
| Mol% | 78.46 | 10.28 | 11.26 |
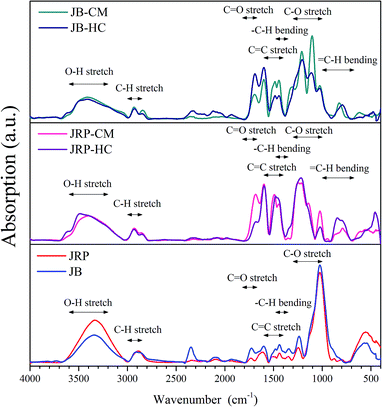
Fig. 7 shows the FTIR spectra of JRP, JB, and CM and HC obtained from JRP and JB. The FTIR spectra of raw JRP and JB are similar and corresponding to the previous report.31 Both of them contained the absorption bands at 1024 and 1238 cm−1 (C–O stretching), 1439 cm−1 (–C–H bending), 1601 cm−1 (C![[double bond, length as m-dash]](https://www.rsc.org/images/entities/char_e001.gif) C stretching), 1726 cm−1 (C
C stretching), 1726 cm−1 (C![[double bond, length as m-dash]](https://www.rsc.org/images/entities/char_e001.gif) O stretching), 2888 cm−1 (C–H stretching), and 3600–3200 cm−1 (O–H stretching). Compared with the feedstocks, CM and HC also possess OH functional groups (3600–3200 cm−1) as well as aliphatic C–H (3000–2800 cm−1). There is a newly added or intensity increased peak in the FTIR spectra of CM and HC around 875–750 cm−1, assigned to aromatic C–H out-of-plane bending vibrations, indicating that a C–H bond was formed during the hydrothermal carbonization process.18 Moreover, the decrease in the intensity of the sharp band at 1027 cm−1 and the broad band at 3600–3000 cm−1 suggest that dehydration occurred during the hydrothermal carbonization process, confirming the analysis results of H/C versus O/C van Krevelen diagram. Significantly, it was found that the FTIR spectra of CM and HC produced from the same feedstock are similar and they differ only in the intensity of some peaks, indicating CM and HC have the same functional group composition. This is evidence that this kind of CM were formed from the extraction of hydrochar, and it forecasts that the HTC and HTE processes will be effective with different wood feedstocks.
O stretching), 2888 cm−1 (C–H stretching), and 3600–3200 cm−1 (O–H stretching). Compared with the feedstocks, CM and HC also possess OH functional groups (3600–3200 cm−1) as well as aliphatic C–H (3000–2800 cm−1). There is a newly added or intensity increased peak in the FTIR spectra of CM and HC around 875–750 cm−1, assigned to aromatic C–H out-of-plane bending vibrations, indicating that a C–H bond was formed during the hydrothermal carbonization process.18 Moreover, the decrease in the intensity of the sharp band at 1027 cm−1 and the broad band at 3600–3000 cm−1 suggest that dehydration occurred during the hydrothermal carbonization process, confirming the analysis results of H/C versus O/C van Krevelen diagram. Significantly, it was found that the FTIR spectra of CM and HC produced from the same feedstock are similar and they differ only in the intensity of some peaks, indicating CM and HC have the same functional group composition. This is evidence that this kind of CM were formed from the extraction of hydrochar, and it forecasts that the HTC and HTE processes will be effective with different wood feedstocks.
3.4 Exploration of mechanism
Based on the morphologies of HC obtained from JRP and JB, and the high carbon contents of HC and CM compared with the feedstocks, it is sure that HC obtained here are same as those obtained by traditional HTC process, indicating that HTC is an important part in this hydrothermal process. Considering that the elemental compositions and functional groups of CM and HC are similar, it indicates that an extraction process existed together with the HTC process. From the view of combing HTC and HTE processes, a simple mechanism was proposed to explain the production of CM from wood sawdust here, as shown in Fig. 8. In the first step, during the hydrothermal treatment, wood sawdust samples were dewatered and carbonized first, and then some part which can be dissolved in hot water was extracted from hydrochar together with some decarboxylation reactions and the emission of carbon dioxide, passed the filter in the reactor; in the second step, the liquid-phase precursor of CM formed and moved with the flowing water; in the third and last step, during the cooling process, carbonaceous spheres appeared, grew from small to big, and finally became the spheres with micron scale. This research is at the initial stage, thus further confirmation is necessary for this mechanism.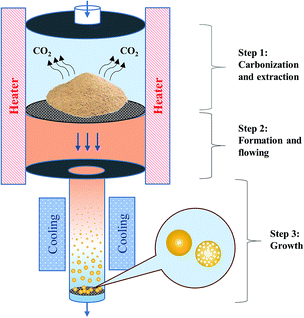 | ||
| Fig. 8 The proposed mechanism for the production of carbonaceous microspheres from wood sawdust by hydrothermal method. | ||
4 Conclusions
Here we described a novel HTC plus HTE process to produce CM from two different wood sawdust. This is the first time to report the production of high-quality CM from crude biomass except carbohydrates. CM obtained from JRP and JB have a uniform spherical morphology, with sizes ranging from 0.1 to 6.9 μm. The yields and carbon percentages of CM are as high as ≥16% and 21%, respectively. The analysis of yields and functional groups on the surface indicates that JRP-CM and JB-CM were formed from the extraction of hydrochar, and it forecasts that the HTC and HTE processes will be effective with different wood feedstocks. Based on the evidence of morphology, yield, elemental composition, and functional groups, an initial mechanism was proposed to explain the production of CM from wood sawdust. During the HTC and HTE process, a liquid-phase precursor of CM formed from the extraction of hydrochar, together with some decarboxylation reactions, and CM appeared and grew during the cooling process. The production of CM from wood sawdust directly by a hydrothermal treatment is sustainable, valuable, and significant for future use of both wood sawdust and CM.Conflicts of interest
There are no conflicts to declare.Notes and references
- E. Mathiowitz, J. S. Jacob, Y. S. Jong, G. P. Carino, D. E. Chickering, P. Chaturvedi, C. A. Santos, K. Vijayaraghavan, S. Montgomery, M. Bassett and C. Morrell, Nature, 1997, 386, 410–414 CrossRef CAS PubMed.
- M. S. Fleming, T. K. Mandal and D. R. Walt, Chem. Mater., 2001, 13, 2210–2216 CrossRef CAS.
- A. Bourlinos, N. Boukos and D. Petridis, Adv. Mater., 2002, 14, 21–24 CrossRef CAS.
- S. Freiberg and X. Zhu, Int. J. Pharm., 2004, 282, 1–18 CrossRef CAS PubMed.
- M. M. Titirici, M. Antonietti and A. Thomas, Chem. Mater., 2006, 18, 3808–3812 CrossRef CAS.
- Q. Lv, L. Nair and C. T. Laurencin, J. Biomed. Mater. Res., Part A, 2009, 91, 679–691 CrossRef PubMed.
- J. Han, Y. Liu and R. Guo, Adv. Funct. Mater., 2009, 19, 1112–1117 CrossRef CAS.
- H. M. Chen, C. H. Deng, Y. Li, Y. Dai, P. Y. Yang and X. M. Zhang, Adv. Mater., 2009, 21, 2200–2205 CrossRef CAS.
- B. Hu, K. Wang, L. H. Wu, S. H. Yu, M. Antonietti and M. M. Titirici, Adv. Mater., 2010, 22, 813–828 CrossRef CAS PubMed.
- P. McKendry, Bioresour. Technol., 2002, 83, 37–46 CrossRef CAS PubMed.
- P. Gallezot, Chem. Soc. Rev., 2012, 41, 1538–1558 RSC.
- A. Funke and F. Ziegler, Biofuels, Bioprod. Biorefin., 2010, 4, 160–177 CrossRef CAS.
- Q. Wang, H. Li, L. Q. Chen and X. J. Huang, Carbon, 2001, 39, 2211–2214 CrossRef CAS.
- X. M. Sun and Y. D. Li, Angew. Chem., Int. Ed., 2004, 43, 597–601 CrossRef PubMed.
- X. M. Sun, J. F. Liu and Y. D. Li, Chem.–Eur. J., 2006, 12, 2039–2047 CrossRef CAS PubMed.
- M. M. Titirici, M. Antonietti and N. Baccile, Green Chem., 2008, 10, 1204–1212 RSC.
- M. Sevilla and A. B. Fuertes, Chem.–Eur. J., 2009, 15, 4195–4203 CrossRef CAS PubMed.
- M. Sevilla and A. B. Fuertes, Carbon, 2009, 47, 2281–2289 CrossRef CAS.
- M. Zhang, H. Yang, Y. N. Liu, X. D. Sun, D. K. Zhang and D. F. Xue, Carbon, 2012, 50, 2155–2161 CrossRef CAS.
- K. Aydincak, T. Yumak, A. Sinag and B. Esen, Ind. Eng. Chem. Res., 2012, 51, 9145–9152 CrossRef CAS.
- F. Salvador, M. J. Senchez-Montero and C. Izquierdo, J. Phys. Chem. C, 2007, 111, 14011–14020 CAS.
- Z. G. Liu and F. S. Zhang, J. Hazard. Mater., 2009, 167, 933–939 CrossRef CAS PubMed.
- Z. G. Liu, F. S. Zhang and J. Z. Wu, Fuel, 2010, 89, 510–514 CrossRef CAS.
- M. Sevilla, A. B. Fuertes and R. Mokaya, Energy Environ. Sci., 2011, 4, 1400–1410 CAS.
- M. Sevilla, J. A. Macia-Agullo and A. B. Fuertes, Biomass Bioenergy, 2011, 35, 3152–3159 CrossRef CAS.
- S. M. Kang, X. H. Li, J. Fan and J. Chang, Ind. Eng. Chem. Res., 2012, 51, 9023–9031 CrossRef CAS.
- M. Morimoto, H. Nakagawa and K. Miura, Energy Fuels, 2009, 23, 4533–4539 CrossRef CAS.
- M. Morimoto, H. Nakagawa and K. Miura, Energy Fuels, 2010, 24, 3060–3065 CrossRef CAS.
- Q. X. Zheng, M. Morimoto, H. Sato and T. Takanohashi, Fuel, 2015, 159, 751–758 CrossRef CAS.
- Q. Zheng, M. Morimoto and T. Takanohashi, Fuel, 2017, 195, 143–150 CrossRef CAS.
- R. Rana, R. Langenfeld-Heyser, R. Finkeldey and A. Polle, Wood Sci. Technol., 2010, 44, 225–242 CrossRef CAS.
| This journal is © The Royal Society of Chemistry 2017 |

