 Open Access Article
Creative Commons Attribution 3.0 Unported Licence
Study on non-isothermal crystallization behavior of isotactic polypropylene/bacterial cellulose composites
Bo Wang ab,
Hai-Rong Zhangb,
Chao Huangb,
Lian Xiongb,
Jun Luo*c and
Xin-de Chen
 *b
*b
aSchool of Chemistry and Chemical Engineering, Taiyuan University of Science and Technology, Taiyuan, Shanxi 030024, China
bKey Laboratory of Renewable Energy, Guangzhou Institute of Energy Conversion, Chinese Academy of Sciences, Guangzhou 510640, China. E-mail: cxd_cxd@hotmail.com
cGuangzhou Fibre Product Testing and Research Institute, Guangzhou 510220, China. E-mail: luoj@gtt.net.cn
First published on 30th August 2017
Abstract
Bacterial cellulose (BC) has great potential to be used as a new filler in reinforced isotactic polypropylene (iPP) due to its characteristics of high crystallinity, biodegradability and efficient mechanical properties. But the compatibility between BC and iPP is poor. The esterification modified BC (CO) and addition of maleic anhydride grafted polypropylene (MAPP) as a compatibilizer were both used to improve interfacial compatibility of iPP and BC to prepare iPP/BC composites, and the non-isothermal crystallization behavior of isotactic polypropylene/bacterial cellulose composites was discussed. The results showed that with the addition of CO or MAPP, the compatibility of iPP/BC composites greatly improved. Moreover, BC addition was found to enhance iPP crystallization due to homogeneous and heterogeneous nucleation effects. In non-isothermal crystallization kinetics, it was found that the Jeziorny method and ϕ–t analysis are more accurate to describe non-isothermal crystallization behavior of iPP/BC composites. The results showed that the non-isothermal crystallization rates increase in the order of iPP/BC2, iPP, iPP/CO2, and M-iPP/BC3, indicating that the compatibility of iPP/BC composites. Moreover, the cooling rate have greatly influence on non-isothermal crystallization behavior of iPP/BC composites.
1. Introduction
Isotactic polypropylene (iPP) is a kind of general purpose resin widely used in packaging, construction and other industrial applications.1 It has many excellent properties such as relatively low cost, low density, and chemical resistance. However, its poor impact properties, especially at low temperature, limit its extensive use in industries.2–4In order to broaden the scope of application of iPP, many modifications have been proposed, such as physical modification (blending modification) and chemical modification.5 Among them, blending modification has advantages such as convenient operation and good modification effect and is economical.6,7
Bacterial cellulose (BC) is a kind of synthetic biodegradable polymer which was widely used in materials, food, and medicine.8 BC has a superfine fiber network and has many advantageous properties such as high purity, high crystallinity, high Young's modulus, and good mechanical properties.9 Based on these advantages, BC has great application value as a filler for reinforced iPP. But the incompatibility between polar BC and non-polar iPP affects the dispersion of BC in iPP and overall homogeneity of the composite structure. In our previous research, esterification-modified BC (CO) and maleic anhydride grafted polypropylene (MAPP) as a compatibilizer have both been used to improve interfacial compatibility of iPP and BC.4,10 The results show that BC enhances mechanical properties of iPP and the effect of MAPP addition is better than that of esterification-modified BC.
As is known, mechanical properties of crystalline polymers are closely related to their crystallization behavior.11–14 Generally, the study of crystallization of polymers is an idealized isothermal condition, which greatly simplifies mathematical analysis but fails to explain different cooling rates and temperatures typically encountered within the polymer in application. However, the study of crystallization in a variable-temperature environment is more practical because industrial processes generally occur under non-isothermal conditions.15 At present, extensive research has been conducted on non-isothermal crystallization kinetics of iPP composites.16,17 Basically, isothermal crystallization is taken as a starting point, and a partial correction is then made according to the characteristics of non-isothermal crystallization in the DSC data. The commonly used methods include the Jeziorny method,18 the Ozawa method,19 and ϕ–t analysis.20
In this study, iPP/BC composites were prepared using a twin-screw extruder. FT-IR and SEM measurements were used for compatibility analysis of iPP/BC. The Jeziorny method, Ozawa method, and ϕ–t analysis were incorporated and compared in order to study the non-isothermal crystallization kinetics of iPP/BC composites from differential scanning calorimetry (DSC) measurements. Melting behavior after non-isothermal crystallization process was also discussed.
2. Materials and methods
2.1 Feedstock sources
iPP (S1003), with a melt flow index (MFI) of 3.6 g/10 min, Mw = 3.2 × 10⁵ was supplied by Sinopec Beijing Yanshan Company (China). MAPP (CMG9801), 1% grafting was purchased from Nantong Sunny Polymer New Material Technology Co., Ltd (China). A BC film (Hainan Yida Food Industry Co., Ltd. China) was flushed with deionized water till neutral, freeze-dried, and then milled into a powder (20–200 nm). Pyridine and caprylyl chloride were purchased from Aladdin Industrial Corporation, Shanghai, China.2.2 Preparation of CO
First, the BC powder and pyridine (w/w, 1![[thin space (1/6-em)]](https://www.rsc.org/images/entities/char_2009.gif) :
:![[thin space (1/6-em)]](https://www.rsc.org/images/entities/char_2009.gif) 20) were dispersed in a flask with a stir bar at room temperature for 30 min, and the temperature of the system was then increased to 80 °C. When the temperature of the system stabilized, the caprylyl chloride (with a mass ratio of BC 30
20) were dispersed in a flask with a stir bar at room temperature for 30 min, and the temperature of the system was then increased to 80 °C. When the temperature of the system stabilized, the caprylyl chloride (with a mass ratio of BC 30![[thin space (1/6-em)]](https://www.rsc.org/images/entities/char_2009.gif) :
:![[thin space (1/6-em)]](https://www.rsc.org/images/entities/char_2009.gif) 1) was added dropwise through a dropping funnel. After 7 h, the solid product of the system was washed with ethyl alcohol and deionized water to neutralize the product and dried in an air-oven for 12 h to obtain CO. Under this condition, the esterification degree of CO was 2.32.4
1) was added dropwise through a dropping funnel. After 7 h, the solid product of the system was washed with ethyl alcohol and deionized water to neutralize the product and dried in an air-oven for 12 h to obtain CO. Under this condition, the esterification degree of CO was 2.32.4
2.3 Preparation of iPP/BC composites
The mixing weight ratio of the composites is shown in Table 1. Each component was mixed in a high-speed mixer (SHR-5A, Laizhou Shenglong Chemical Machinery CO., Ltd., China) for 5 min at a speed of 2000 rpm. The pellets of the composites were prepared using a twin-screw extruder (SHJ-20, Nanjing Jieya Extrusion Equipment CO., Ltd., China). The temperatures of divisions were set to 170, 185, 195, and 200 °C. At last, the pellets were dried at 80 °C for 12 h and iPP/BC composites were obtained.| Sample | iPP (g) | BC (g) | CO (g) | MAPP (g) |
|---|---|---|---|---|
| iPP | 1000 | — | — | — |
| iPP/BC2 | 1000 | 20 | — | — |
| iPP/CO2 | 1000 | — | 20 | — |
| M-iPP/BC3 | 1000 | 30 | — | 70 |
2.4 Characterization of iPP/BC composites
Thermal analysis was carried out on a DSC (Q2000, TA Company, USA). The temperature and heat capacity were calibrated by pure indium standard material. For non-isothermal crystallization, the samples were first heated to 220 °C at a rate of 10 °C min−1, maintained at 220 °C for 5 min to erase thermal history and cooled to 50 °C at three preset cooling rates of 5, 10, and 30 °C min−1. Then, the samples were subsequently heated to 220 °C at 10 °C min−1. The heat flows during both crystallization and melting processes were recorded for subsequent data analysis.X-ray diffraction spectra were recorded from 2θ of 0° to 40° with an XRD diffraction instrument (Rigaku D/max-250, PANalytical Company, Netherlands), with a Cu Kα radiation source at λ of 0.154 nm (10 kV, 100 mA).
For FT-IR, the samples were pressed into slices (100 μm) by a heat press (170 °C, 12 MPa) for 3 min. FT-IR tests were performed on an infrared spectrometer (NICOLET iS50, Thermo Scientific Company, USA), taking 64 scans for each sample.
SEM photographs were obtained on a scanning electron microscope (S-4800, Hitachi, Japan) at an accelerated voltage of 10 kV in order to observe the compatibility of the composites.
3. Results and discussion
3.1 FT-IR of iPP/BC composites
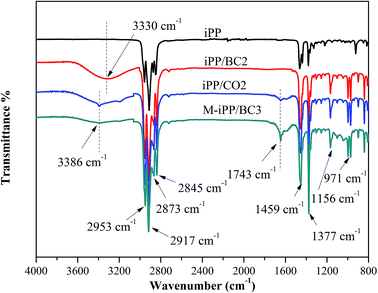
FT-IR spectra of iPP/BC composites is shown in Fig. 1. All samples showed characteristic absorption peaks of iPP such as stretching, deformation and rocking vibration of –CH3 (2953 cm−1, 2873 cm−1, 1377 cm−1, 1156 cm−1 and 971 cm−1) and stretching and flexural vibration of –CH2 (2917 cm−1, 2845 cm−1 and 1459 cm−1). The O–H stretching vibration absorption peak was shown in the FT-IR spectra of iPP/BC composites. Especially, a new C![[double bond, length as m-dash]](https://www.rsc.org/images/entities/char_e001.gif) O group vibration appeared at 1743 cm−1 for iPP/CO2, M-iPP/BC3. The effect of BC esterification and addition of MAPP was confirmed by this absorption peak. Besides, compared to iPP/BC2, the O–H stretching vibration absorption peak of iPP/CO2 and M-iPP/BC3 moved to a higher wavenumber (3330–3386 cm−1), peak intensity weakened, and peak width narrowed, indicating that the hydrogen bond structure of BC molecules was weakened and some hydroxyl groups were substituted after modification.4
O group vibration appeared at 1743 cm−1 for iPP/CO2, M-iPP/BC3. The effect of BC esterification and addition of MAPP was confirmed by this absorption peak. Besides, compared to iPP/BC2, the O–H stretching vibration absorption peak of iPP/CO2 and M-iPP/BC3 moved to a higher wavenumber (3330–3386 cm−1), peak intensity weakened, and peak width narrowed, indicating that the hydrogen bond structure of BC molecules was weakened and some hydroxyl groups were substituted after modification.4
3.2 SEM photographs of iPP/BC composites
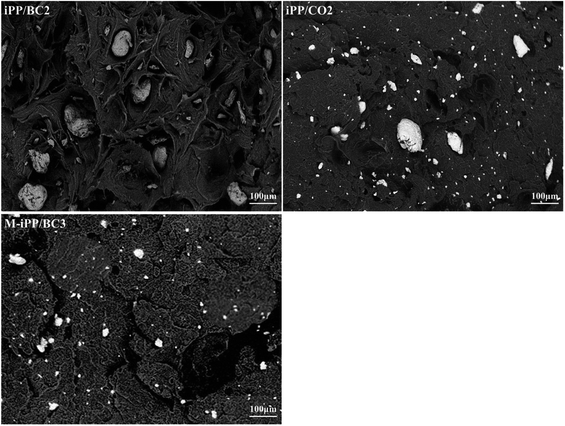
SEM photographs of the composites are shown in Fig. 2. It can be seen that particle size of BC in iPP/BC2 is larger. This reflects the poor dispersion of BC in iPP. However, on BC esterification or addition of MAPP, the particle size of BC and remaining holes become smaller, thus improving compatibility. The particle size of BC in M-iPP/BC3 composites is smaller than in iPP/CO2. This proves that the increasing order of contribution to compatibility of the composites is iPP/BC2 iPP/CO2, and M-iPP/BC3.3.3 Non-isothermal crystallization process of iPP/BC composites
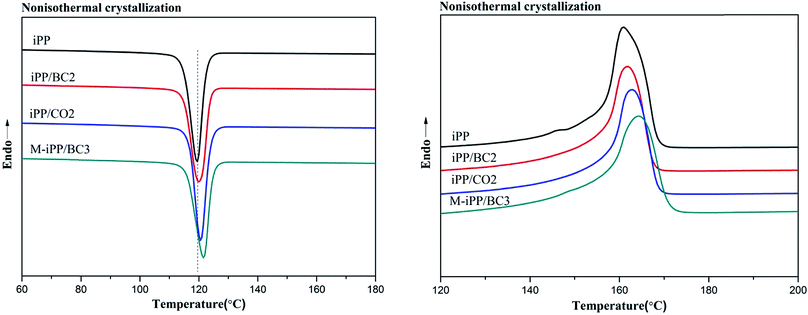
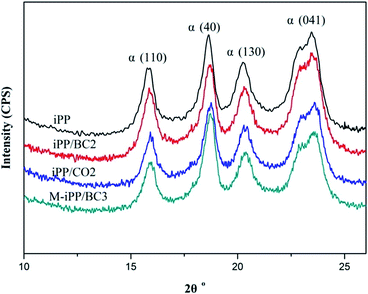
Non-isothermal crystallization DSC curves of iPP/BC composites are shown in Fig. 3. It can be observed that BC can promote crystallization of iPP, which is demonstrated by the shift of non-isothermal crystallization curves of the sample towards higher temperatures. This indicates that the addition of BC promotes crystallization of the composites. Meanwhile, all samples have only one crystallization exothermic peak. In general, homogeneous nucleation and heterogeneous nucleation are common in crystalline polymers or their mixtures. However, iPP and BC are completely incompatible in the molten state of the system under study. Thus, we can speculate that BC-induced iPP crystallization can only be obtained by heterogeneous nucleation.The crystallization peak parameters of composites were listed in Table 2. Compared to iPP, the peak temperature (Tp) of the iPP/BC composites increase by 0.9 °C (iPP/BC2), 0.94 °C (iPP/CO2), and 2.01 °C (M-iPP/BC3), respectively. Meanwhile, peak width slightly narrows, indicating that the addition of BC effectively shortens the induction time of iPP crystals and increases crystallization rate of the composites. The order of contribution to crystallinity of the composites is BC < CO < MAPP as the compatibilizers, which conforms to the effects of the two modification methods on the mechanical performance of the composites, as mentioned in our previous research.4,10 In addition, the crystallinity enthalpy rates of the composites indicate that the crystallinity of the samples are not quite different, which can also be seen from Fig. 4. Moreover, it can be noted that only α-crystals can be produced by the induction of iPP regardless of the method of modification.
| Sample | Ton (°C) | Tp (°C) | ΔH (J g−1) |
|---|---|---|---|
| iPP | 122.53 | 119.07 | 97.23 |
| iPP/BC2 | 123.86 | 119.97 | 95.82 |
| iPP/CO2 | 122.47 | 120.10 | 96.82 |
| M-iPP/BC3 | 124.19 | 121.08 | 92.65 |
3.4 Non-isothermal crystallization kinetics analysis of iPP/BC composites
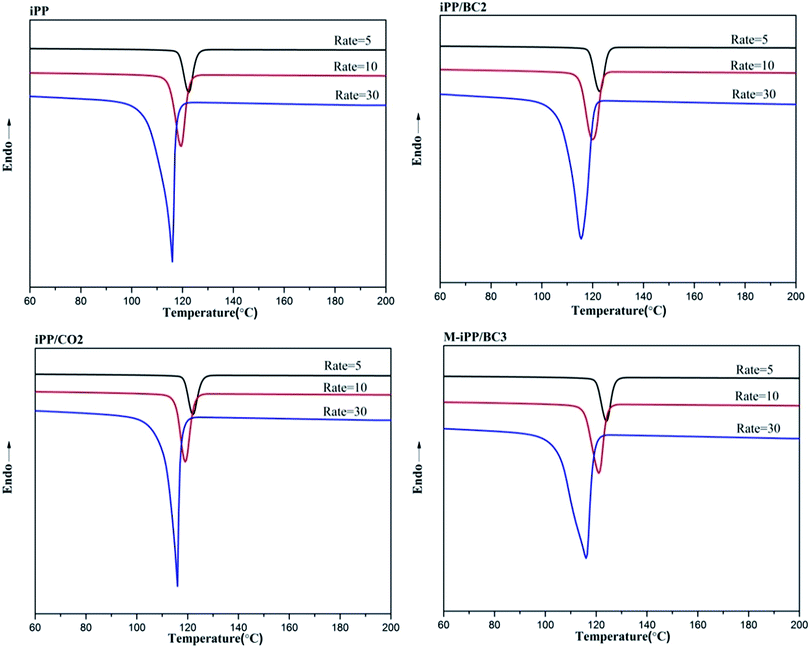
Non-isothermal crystallization curves at sample cooling rates of 5 °C min−1, 10 °C min−1, and 30 °C min−1 are shown in Fig. 5. It can be seen from Fig. 5 that as the cooling rate increases, crystallization temperature (Tp) decreases and the crystallization peak widens. The main reason for this phenomenon is molecular chain activity at a relatively low temperature is poor, which causes the formation of crystal imperfections. Hence, the crystal can crystallize at low temperature (Tp value decrease), the perfection of crystallization is different, and the range of melting temperatures becomes larger (crystallization peak becomes wider).In order to further analyze non-isothermal crystallization, crystallization kinetics of iPP/BC composites were compared. Based on the assumption that the evolution of crystallinity is linearly proportional to the evolution of heat released during crystallization, the relative degree of crystallinity, Xw(t), was calculated by integration of exothermal peaks from eqn (1).
 | (1) |
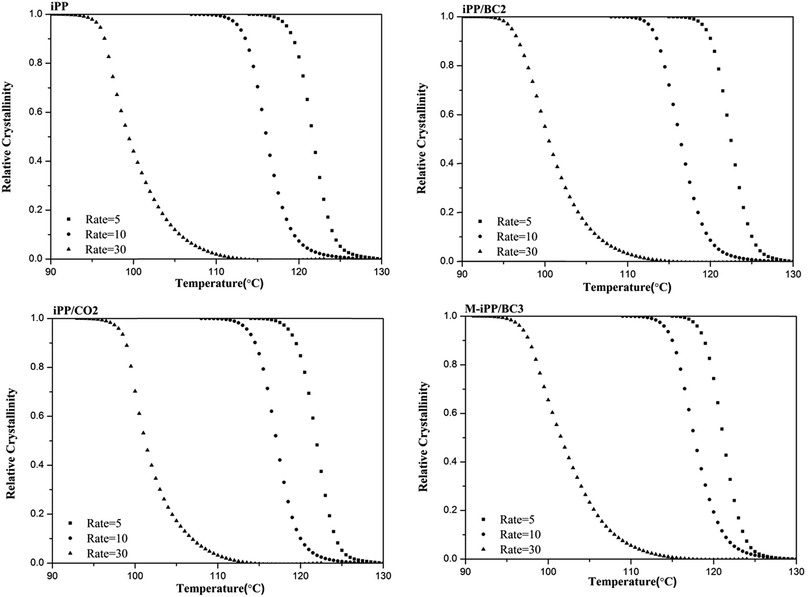 | ||
| Fig. 6 Relationship between relative crystallization and crystallization temperature of iPP/BC composites during non-isothermal crystallization. | ||
The relationship between crystallinity X(t) and temperature T can be converted to that between crystallinity X(t) and time t, as shown in Fig. 7 via eqn (2).
| t = (T0 − T)/ϕ | (2) |
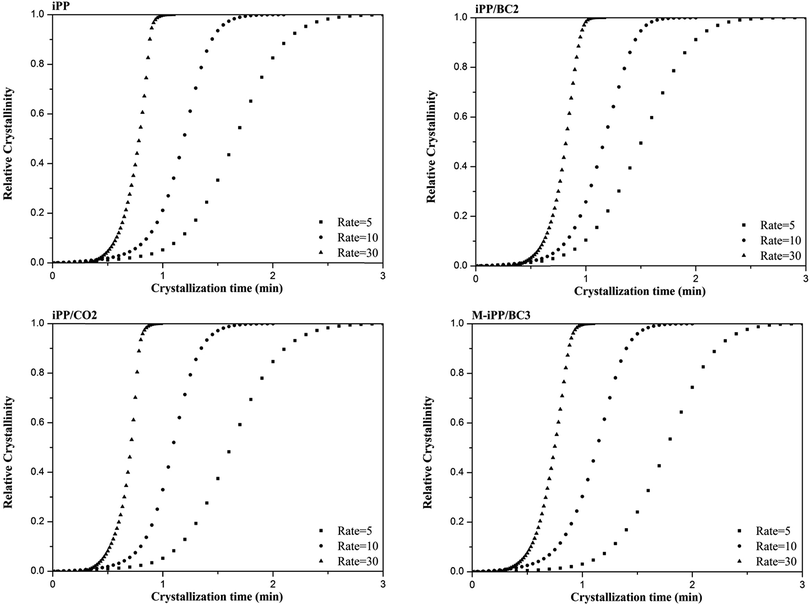 | ||
| Fig. 7 Relationship between relative crystallization and crystallization time of iPP/BC composites during non-isothermal crystallization. | ||
| X(t) = 1 − exp(−Ktn) | (3) |
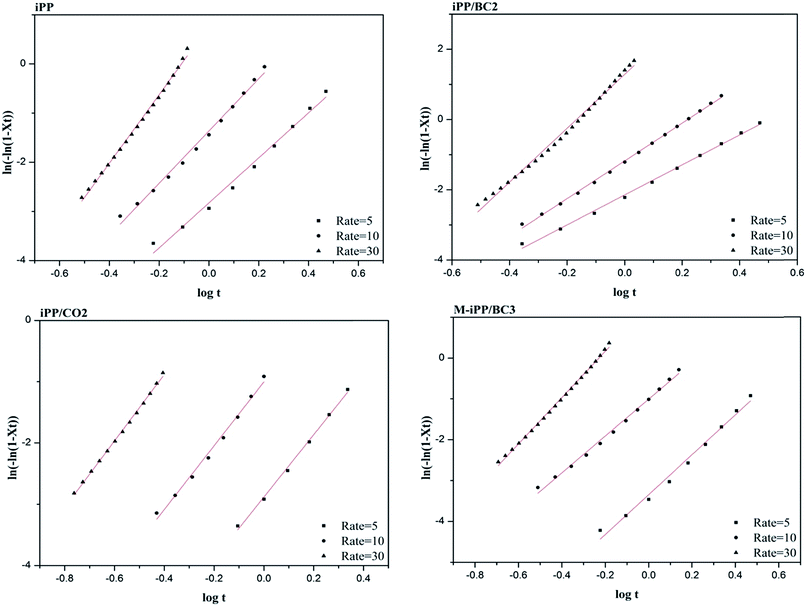
Eqn (3) is typically rearranged in a linear form as double logarithm eqn (4):
log[−ln(1 − X(t))] = n![[thin space (1/6-em)]](https://www.rsc.org/images/entities/char_2009.gif) log log![[thin space (1/6-em)]](https://www.rsc.org/images/entities/char_2009.gif) t + log t + log![[thin space (1/6-em)]](https://www.rsc.org/images/entities/char_2009.gif) K K
| (4) |
The Jeziorny method modifies the Avrami equation to describe non-isothermal crystallization kinetics of polymers. The Jeziorny method is a direct method to apply the Avrami equation to non-isothermal crystallization. It calibrates parameters by taking non-isothermal crystallization as isothermal crystallization, so that non-isothermal crystallization mechanism of the polymer is determined.18
A corrected form of the rate term (K) used in the Avrami equation assuming a constant cooling/heating rate is proposed. The relative crystallinity at a set cooling rate (R) is a function of crystallization temperature (T).
The plot of log[−ln(1 − X(t))] against log(t) is obtained based on eqn (4). The Avrami index n is obtained from the slope, and log![[thin space (1/6-em)]](https://www.rsc.org/images/entities/char_2009.gif) K can be obtained from the intercept. Correction of cooling rate ϕ is made for the obtained K (eqn (5)).
K can be obtained from the intercept. Correction of cooling rate ϕ is made for the obtained K (eqn (5)).
log![[thin space (1/6-em)]](https://www.rsc.org/images/entities/char_2009.gif) Kc = (log Kc = (log![[thin space (1/6-em)]](https://www.rsc.org/images/entities/char_2009.gif) K)/ϕ K)/ϕ
| (5) |
Fig. 8 and Table 3 are obtained by processing the data in Fig. 6 using the Jeziorny method. It can be seen from Table 3 that the n values are around 3 and the n value of iPP is larger than of other samples. This indicates that the composites follow a three-dimensional growth pattern and due to the addition of BC, homogeneous nucleation and heterogeneous nucleation coexist in the composites.
| Sample | ϕ | Tp (°C) | Ton (°C) | ΔH (J g−1) | n | k | t1/2 (min) |
|---|---|---|---|---|---|---|---|
| iPP | 5 | 122.41 | 125.64 | 96.95 | 3.9 | 0.0001 | 1.66 |
| 10 | 119.07 | 122.53 | 97.23 | 3.8 | 0.0044 | 1.19 | |
| 30 | 116.26 | 116.76 | 97.09 | 3.7 | 0.1963 | 0.78 | |
| iPP/BC2 | 5 | 122.74 | 126.06 | 96.48 | 3.5 | 0.0003 | 1.62 |
| 10 | 119.97 | 123.86 | 95.82 | 3.4 | 0.0066 | 1.16 | |
| 30 | 115.46 | 120.36 | 94.17 | 3.7 | 0.6499 | 0.72 | |
| iPP/CO2 | 5 | 122.06 | 125.48 | 97.38 | 3.6 | 0.0007 | 1.57 |
| 10 | 120.10 | 122.47 | 96.82 | 3.7 | 0.0098 | 1.09 | |
| 30 | 116.24 | 116.53 | 97.46 | 3.4 | 0.6599 | 0.71 | |
| M-iPP/BC3 | 5 | 124.05 | 127.20 | 93.52 | 3.3 | 0.0014 | 1.46 |
| 10 | 121.08 | 124.19 | 92.65 | 3.1 | 0.0100 | 1.03 | |
| 30 | 116.15 | 118.85 | 92.81 | 3.4 | 0.6651 | 0.65 |
Table 3 also prove that Kc value of the samples increases with cooling rate, while semi-crystallization time (t1/2) of the sample decreases, which shows that crystallization rate of the composites is proportional to cooling rate. This is because at a low cooling rate, the transition speed from melting state to crystalline state of the composites is slow and the impact of cooling rate on crystallization is weak. At the same cooling rate, Kc values of the samples increase gradually, which indicates that BC promotes crystallization of the composites.
| 1 − X(T) = exp(1 − Z(T))/ϕ | (6) |
Logarithmic transformation of eqn (6) produces eqn (7):
log[−ln(1 − X(T))] = log(1 − Z(T)) − m![[thin space (1/6-em)]](https://www.rsc.org/images/entities/char_2009.gif) log log![[thin space (1/6-em)]](https://www.rsc.org/images/entities/char_2009.gif) ϕ ϕ
| (7) |
![[thin space (1/6-em)]](https://www.rsc.org/images/entities/char_2009.gif) ϕ against log
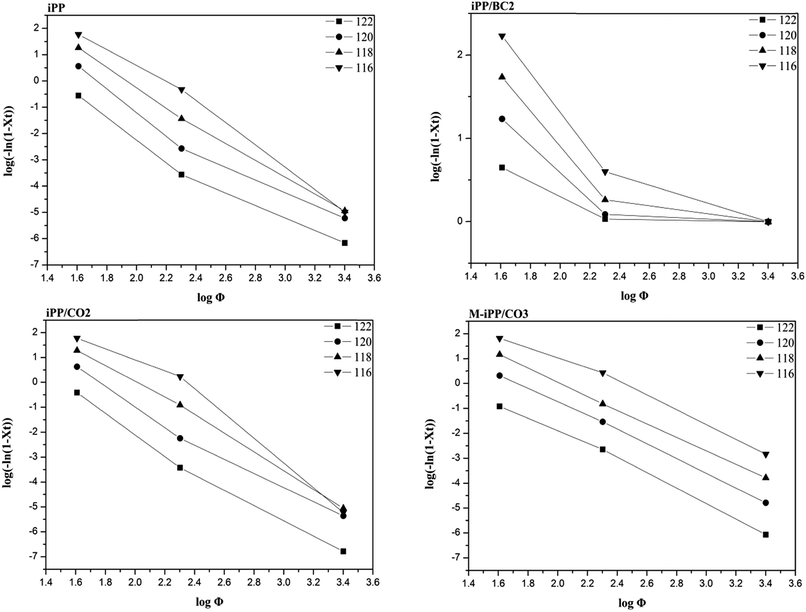
ϕ against log![[thin space (1/6-em)]](https://www.rsc.org/images/entities/char_2009.gif) [−ln(1 − X(T))] in eqn (7) at a certain temperature. The slope of the straight line equals the Ozawa index m and the intercept equals the kinetics parameter Z(T).
[−ln(1 − X(T))] in eqn (7) at a certain temperature. The slope of the straight line equals the Ozawa index m and the intercept equals the kinetics parameter Z(T).
The non-isothermal data of each sample were processed using Ozawa analysis, and the results obtained are shown in Fig. 9 and Table 4. It can be seen that non-isothermal crystallization kinetics curves are linear for iPP, iPP/CO2, and M-iPP/BC3, but not for iPP/BC2. The Z(T) value of the sample shows a tendency to decrease as temperature increases, except iPP/BC2. The Z(T) value of the modified sample are higher than of pure iPP, which also indicates that the interfacial compatibility of the material is improving and thus its crystallinity. However, regularity has not been shown in the Z(T) value of the iPP/BC2 sample, which indicates that poor interface compatibility affects nucleation and growth of the composites.
| T (°C) | iPP | iPP/BC2 | iPP/CO2 | M-iPP/B3 | ||||
|---|---|---|---|---|---|---|---|---|
| m | Z(T) | M | Z(T) | m | Z(T) | m | Z(T) | |
| 116 | −3.16 | 3.82 | −1.18 | 5.28 | −4.00 | 6.21 | −2.63 | 8.69 |
| 118 | −3.06 | 2.87 | −0.90 | 4.04 | −3.56 | 5.57 | −2.76 | 7.11 |
| 120 | −3.82 | 1.99 | −0.64 | 8.13 | −3.30 | 5.01 | −2.86 | 5.72 |
| 122 | −3.44 | 1.04 | −0.33 | 6.68 | −3.51 | 3.84 | −2.89 | 4.96 |
log![[thin space (1/6-em)]](https://www.rsc.org/images/entities/char_2009.gif) ϕ = log ϕ = log![[thin space (1/6-em)]](https://www.rsc.org/images/entities/char_2009.gif) F(T) − a F(T) − a![[thin space (1/6-em)]](https://www.rsc.org/images/entities/char_2009.gif) log log![[thin space (1/6-em)]](https://www.rsc.org/images/entities/char_2009.gif) t t
| (8) |
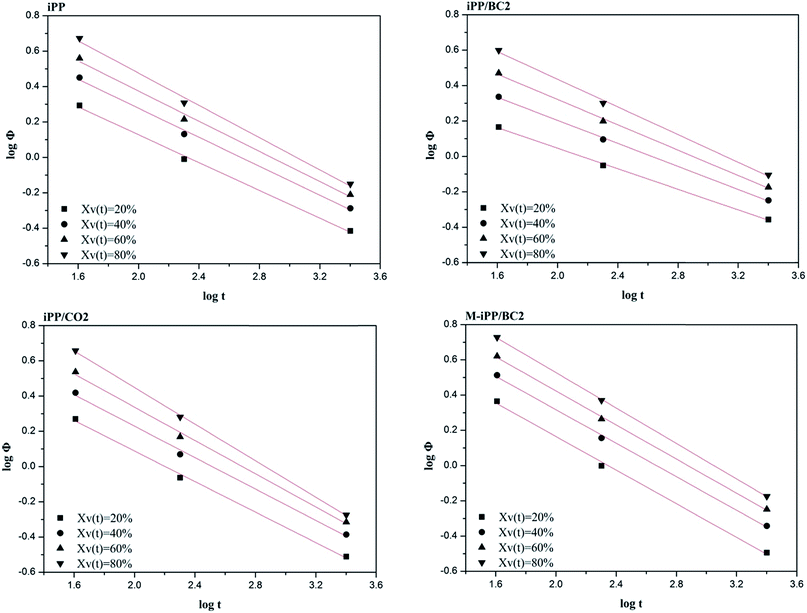
Using ϕ–t analysis, non-isothermal crystallization kinetics curves of each sample are obtained by plotting log![[thin space (1/6-em)]](https://www.rsc.org/images/entities/char_2009.gif) ϕ against log
ϕ against log![[thin space (1/6-em)]](https://www.rsc.org/images/entities/char_2009.gif) t, as shown in Fig. 10. It can be seen that log
t, as shown in Fig. 10. It can be seen that log![[thin space (1/6-em)]](https://www.rsc.org/images/entities/char_2009.gif) ϕ of each sample analyzed by the ϕ–t method shows a good linear relationship with log
ϕ of each sample analyzed by the ϕ–t method shows a good linear relationship with log![[thin space (1/6-em)]](https://www.rsc.org/images/entities/char_2009.gif) t. The kinetics parameters a and F(T) are obtained using the slope and intercept of the straight line, as shown in Table 5.
t. The kinetics parameters a and F(T) are obtained using the slope and intercept of the straight line, as shown in Table 5.
| Sample | X(t) (%) | F(T) | a |
|---|---|---|---|
| iPP | 20 | 0.91 | 0.39 |
| 40 | 1.10 | 0.41 | |
| 60 | 1.23 | 0.43 | |
| 80 | 1.39 | 0.46 | |
| iPP/BC2 | 20 | 0.63 | 0.29 |
| 40 | 0.85 | 0.32 | |
| 60 | 1.04 | 0.36 | |
| 80 | 1.22 | 0.39 | |
| iPP/CO2 | 20 | 0.95 | 0.43 |
| 40 | 1.12 | 0.45 | |
| 60 | 1.28 | 0.47 | |
| 80 | 1.49 | 0.52 | |
| M-iPP/BC3 | 20 | 1.12 | 0.48 |
| 40 | 1.27 | 0.48 | |
| 60 | 1.39 | 0.48 | |
| 80 | 1.53 | 0.50 |
As shown in Table 5, the F(T) and a values of the samples increase with crystallinity. This indicates that crystallinity of the composites can be increased by accelerating the cooling rate and the degree of crystal refinement increases as crystallization progresses.
However, the a values of samples for same crystallinity in ascending order are iPP/BC2, iPP, iPP/CO2, and M-iPP/BC3, and the a value of iPP/BC2 is lower than that of the others at the same crystallinity, showing that the poor compatibility of the iPP/BC2 sample leads to a lowered crystallization rate.
4. Conclusion
iPP/BC composites were successfully prepared using a twin-screw extruder. The compatibility and crystallization behavior of the composites was studied by FT-IR, SEM, XRD and DSC. With BC esterification or MAPP addition, compatibility of iPP/BC composites was greatly improved. The addition of BC was found to enhance crystallization of iPP due to homogeneous and heterogeneous nucleation effects. In non-isothermal crystallization kinetics, it was found that the Jeziorny method and ϕ–t analysis were more accurate to describe non-isothermal crystallization behavior of iPP/BC composites. The result of non-isothermal crystallization kinetics analysis of the composites showed that non-isothermal crystallization rates increase in the order of iPP/BC2, iPP, iPP/CO2, and M-iPP/BC3, indicating that the compatibility of iPP/BC composites and the cooling rate have considerable influence on non-isothermal crystallization behavior of iPP/BC composites.Conflicts of interest
There are no conflicts to declare.Acknowledgements
The authors acknowledge the financial support of the CAS Key Laboratory of Renewable Energy (No. Y707k91001), the Doctoral Startup Project of Taiyuan University of Science and Technology (20162013) and the National Natural Science Foundation of China (51303181).References
- M. Kontopoulou, W. Wang, T. Gopakumar and C. Cheung, Polymer, 2003, 44, 7495–7504 CrossRef CAS.
- Y. Pang, X. Dong, Y. Zhao, C. C. Han and D. Wang, Polymer, 2007, 48, 6395–6403 CrossRef CAS.
- W. Weng, W. Hu, A. H. Dekmezian and C. J. Ruff, Macromolecules, 2002, 35, 3838–3843 CrossRef CAS.
- B. Wang, D. Yang, H. R. Zhang, C. Huang, L. Xiong, J. Luo and X. D. Chen, Polymers, 2016, 8, 129 CrossRef.
- C. Giavarini, P. D. Filippis, M. L. Santarelli and M. Scarsella, Fuel, 1996, 75, 681–686 CrossRef CAS.
- W. Qiu, T. Endo and T. Hirotsu, J. Appl. Polym. Sci., 2006, 102, 3830–3841 CrossRef CAS.
- T. Semba, K. Kitagawa, M. Nakagawa, U. S. Ishiaku and H. Hamada, J. Appl. Polym. Sci., 2005, 98, 500–508 CrossRef CAS.
- C. Huang, X. Y. Yang, L. Xiong, H. J. Guo, J. Luo, B. Wang, H. R. Zhang, X. Q. Lin and X. D. Chen, Appl. Biochem. Biotechnol., 2015, 175, 1678–1688 CrossRef CAS PubMed.
- C. R. Clark, N. Baril, M. Kunicki, N. Johnson, J. Soukup, K. Ferguson, S. Lipsitz and J. Bigby, Cellulose, 2009, 16, 1033–1045 CrossRef.
- B. Wang, H. R. Zhang, C. Huang, L. Xiong, J. Luo and X. D. Chen, Polymer, 2017, 41, 460–464 CAS.
- A. Salazar, A. Rico, S. Rodríguez, J. M. Navarro and J. Rodríguez, Polym. Eng. Sci., 2012, 52, 805–813 CAS.
- B. Suksut and C. Deeprasertkul, J. Polym. Environ., 2011, 19, 288–296 CrossRef CAS.
- A. Misra and S. N. Garg, J. Polym. Sci., Part B: Polym. Phys., 1986, 24, 999–1008 CrossRef CAS.
- R. Hemanth, B. Suresha and M. Sekar, J. Compos. Mater., 2015, 49, 2217–2229 CrossRef CAS.
- M. L. D. Lorenzo and C. Silvestre, Prog. Polym. Sci., 1999, 24, 917–950 CrossRef.
- A. I. Isayev and B. F. Catignani, Polym. Eng. Sci., 1997, 37, 1526–1539 CAS.
- P. Supaphol and J. E. Spruiell, Polymer, 2001, 42, 699–712 CrossRef CAS.
- A. Jeziorny, Polymer, 1978, 19, 1142–1144 CrossRef CAS.
- T. Ozawa, Polymer, 1971, 12, 150–158 CrossRef CAS.
- T. Liu, Z. Mo, S. Wang and H. Zhang, Polym. Eng. Sci., 1997, 37, 568–575 CAS.
- K. M. Seven, J. M. Cogen and J. F. Gilchrist, Polym. Eng. Sci., 2016, 56, 541–554 CAS.
- M. Joshi and B. S. Butola, J. Appl. Polym. Sci., 2010, 105, 978–985 CrossRef.
- M. Avrami, J. Chem. Phys., 1939, 7, 1103–1112 CrossRef CAS.
| This journal is © The Royal Society of Chemistry 2017 |

