 Open Access Article
Creative Commons Attribution 3.0 Unported Licence
Isotope geochemistry, hydrochemistry, and mineralogy of a river affected by acid mine drainage in a mining area, South China†
Di Xiaa,
Han Yea,
Yingying Xiea,
Chengfang Yanga,
Meiqin Chenb,
Zhi Dangac,
Xiaoyun Yiac and
Guining Lu *ad
*ad
aSchool of Environment and Energy, South China University of Technology, Guangzhou 510006, China. E-mail: GNLu@foxmail.com
bSchool of Environmental and Biological Engineering, Guangdong University of Petrochemical Technology, Maoming 525000, China
cThe Key Laboratory of Pollution Control and Ecosystem Restoration in Industry Clusters, Ministry of Education, South China University of Technology, Guangzhou 510006, China
dGuangdong Provincial Engineering and Technology Research Center for Environmental Risk Prevention and Emergency Disposal, South China University of Technology, Guangzhou 510006, China
First published on 7th September 2017
Abstract
The Hengshi River is a classic example of an acid mine drainage (AMD)-affected river located in the Dabaoshan mining area in southern China. This work utilized stable isotopes (δ34S and δ18O) and hydrochemical data of surface water samples as well as the mineralogical composition of sediment samples to evaluate the processes that affect the sulfate content in water of the Hengshi River. High concentrations of heavy metals (e.g. Fe: >347.78 mg L−1; Zn: >96.48 mg L−1) in the mud impoundment and relatively stable S isotope values (δ34S: −1.53‰ ∼ −0.88‰) in the upper stream suggested that most of the sulfates were derived from sulfide oxidation. Dilution and mineralization could decrease SO42− concentration, but had no significant influence on the isotope composition of SO42−. However, δ34S and δ18O increased with the decrease of SO42− concentration, accompanied by the elevation of pH and adequate organic matter being available, suggesting that bacterial (dissimilatory) sulfate reduction played an important role in the transformation of sulfate downstream. The methods used in this study can also be used in other natural systems. Furthermore, it is important to understand the causes of environmental pollution and to help environmental remediation.
1. Introduction
Mining activity is a main source of hazardous elements and can produce acid mine drainage (AMD), which poses a major threat to the surrounding environment and human health.1,2 Sulfate is an essential component in AMD whose transformation plays a key role in the hydrochemical development of rivers in mining areas.3–5 Sulfate is predominantly caused by the oxidation of pyrite, accompanied by the liberation of acid, and metals.6–8 Pyrite can be oxidized by dissolved molecular oxygen and ferric iron. Pyrite oxidation by Fe3+ has been shown to be 18 to 170 times more rapidly than by O2.9 However, this step is limited by the rate of ferrous iron oxidation. The slow abiotic reaction which produces ferric iron can be catalyzed primarily by Fe-oxidizing bacteria like Acidithiobacillus ferrooxidans and Acidithiobacillus thiooxidans.10,11Bacterial (dissimilatory) sulfate reduction (BSR) is an invertible process that can produce alkalinity and generate iron sulphide minerals,12–15 thereby potentially resulting in an effective neutralization of the river affected by AMD. Sulfate reducing bacteria are anaerobes, which prefer anaerobic environment with sufficient availability of organic matter.16,17 So BSR is often occurring in sediments, but it also can occur in the water column and the water–sediment interface.18 In AMD area, BSR often occurs in association with microbial ferric reduction.19–21 And the reaction can be summarized in the eqn (1):22
| 15〈CH2O〉 + 6FeOOH + 7SO42− + 14H+ → 15CO2 + 6FeS + S(0) + 25H2O | (1) |
Sulfur and oxygen isotopes are powerful tools to track SO42− sources and assess S cycling in watersheds. According to field samples and experimental studies,23–25 the sulfur isotope composition of sulfate is very close to its major bedrock sources of S (like sulfides, evaporates, etc.) participating in water–rock interaction. But the oxygen isotope composition of sulfate can be affected by the oxidation mechanisms because of the difference between the oxygen isotopic composition of water (δ18O generally <0‰) and atmospheric oxygen (δ18O = 23.5 ± 0.3‰ (ref. 26)). Once formed, the sulfur and oxygen isotopic composition of sulfate tends to remain stable, because the isotopic exchange between water and sulfate is slow (360 years at pH 1.0 and 25 °C).27,28 However, BSR is a complex process which involves large kinetic fractionation effects on both sulphur and oxygen isotopes.29–31 During the BSR, bacteria preferentially break 32S and 16O containing bonds and the residual dissolved sulfate becomes isotopically enriched in 34S and 18O.32–34 Therefore, the sulfur and oxygen isotope ratio of sulfate combined with their physical and chemical properties could be useful to identify bacterial reduction processes.
Even though there has been a great deal of work focused on the species distribution, migration and transformation in the water of AMD-affected river,35–43 less attention has been paid to identify the source of sulfate. Thus, by means of characterizing water and sediments from Hengshi River affected by the AMD, the major objectives of this study are: (1) to identify the sources of dissolved sulfate; (2) to evaluate the processes that control spatial variation of concentrations and isotope compositions of dissolve SO42− along the Hengshi River.
2. Materials and methods
2.1 Study site
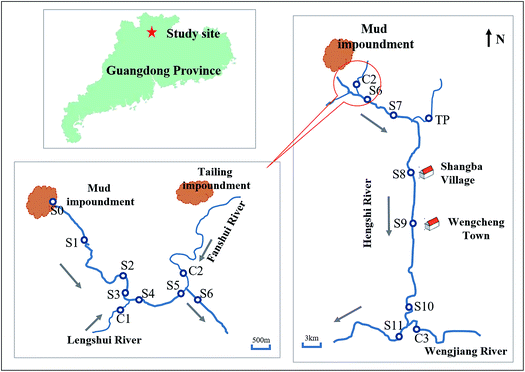
The study site (Fig. 1) is located at the Dabaoshan Mining area (24°34′ 28′′N, 113°43′42′′E) near the largest poly-metallic sulfide mine of Guangdong Province in southern China.44,45 Because of the mining activities for many years, there are large amounts of mining wastes left on the land surface. These wastes contain large amounts of sulfide minerals. The sulfide minerals could be oxidized and leading to the formation of AMD, which formed an acidic reservoir intercepted by a dam wall.46 The water of the reservoir contains high concentrations of sulfate (>4008.04 mg L−1) and iron (>347.78 mg L−1) with low pH values (<2.98) during the investigation period. With the accumulation of water and sediments, the reservoir was rapidly filled up, and then the acidic water continuously flowed into the Hengshi River for years. The Hengshi River runs through Shangba Village and Wengcheng Town, joined by several tributaries, including the Lengshui River, the Fanshui River and the Taiping River, and enters into the Wengjiang River finally. It's worth noting that a sewage treatment plant was built in 2.5 km downstream (S2) from the dam after January 2016, in order to control the pollution.2.2 Sampling and pretreatment
In January, August and November of 2016, surface water and sediment samples were collected from these sites of Hengshi River (Fig. 1), the same with the previous studied sites in our group.47 S1 ∼ S11 were set along the Hengshi River, from the river's headwaters (S1) to the Wengjiang River (S11). S0 represents the acidic lake of the mud impoundment. S8 and S9 are close to the residential area of Shangba Village and Wengcheng Town, respectively. In August 2016, we found that there were some domestic sewage from Shangba Village flowed into the Hengshi River in S8, which was observed only in this season. It was a pity that we didn't collect the samples of S2 because the sewage treatment plant covered S2. Also we didn't get the samples of S5 and C2 in August due to the geography changing.In addition, C1, C2, C3 and TP served as control sites which were located in the four major tributaries, including Lengshui, Fanshui, Wengjiang and Taiping Rivers respectively. These tributaries flowed to Hengshi River. The Lengshui River and Taiping River were unpolluted, but the water of C2 also had been polluted by the AMD from the tailing impoundment.
In all locations, the water samples were filtered in the field with a 0.22 μm nylon syringe filter into 15 mL centrifuge tubes. One portion of water was acidified with 1 mL 3 N HCl to analyze Fe2+ concentration. The second portion was acidified with 1 mL high-purity concentrated HNO3 for cation analysis, and the third portion was left untreated for anion analysis. Unfiltered surface water samples were collected in plastic bottles for S and O isotope analysis. Surface-sediment samples were collected at the same place also using plastic bottles. Each sample was made in triplicate. Water samples were stored at 4 °C while sediment samples were stored at −20 °C before analysis.
2.3 Chemical analysis
0.5 g sediment was used for the determination of water soluble sulfate (WS) and exchangeable sulfate (ExS) separately. The sediment extracted by deionized water (sediment![[thin space (1/6-em)]](https://www.rsc.org/images/entities/char_2009.gif) :
:![[thin space (1/6-em)]](https://www.rsc.org/images/entities/char_2009.gif) water = 1
water = 1![[thin space (1/6-em)]](https://www.rsc.org/images/entities/char_2009.gif) :
:![[thin space (1/6-em)]](https://www.rsc.org/images/entities/char_2009.gif) 20 w/w) was sampled to determine WS and that extracted by phosphate solution (0.032 M sodium dihydrogen phosphate, pH adjusted to 6) was used to determine ExS. After shaking (150 rpm, 25 °C) 2 h, the supernatant was filtered and analyzed about the concentration of SO42− by ion chromatography.48,49
20 w/w) was sampled to determine WS and that extracted by phosphate solution (0.032 M sodium dihydrogen phosphate, pH adjusted to 6) was used to determine ExS. After shaking (150 rpm, 25 °C) 2 h, the supernatant was filtered and analyzed about the concentration of SO42− by ion chromatography.48,49
A semiquantitative estimate of the mineralogical composition of the samples was taken by powder X-ray diffraction (XRD) analysis using a Bruker XRD machine (Cu-Kα radiation, D8 Advance, Bruker Co. Ltd., Germany). Scan parameters used were 5°–80° 2θ, with a step size of 0.02° 2θ and 0.1 s acquisition time.
| δ (‰) = (Rsample − Rstandard)/Rstandard × 1000 | (2) |
3. Results and discussion
3.1 Water chemistry
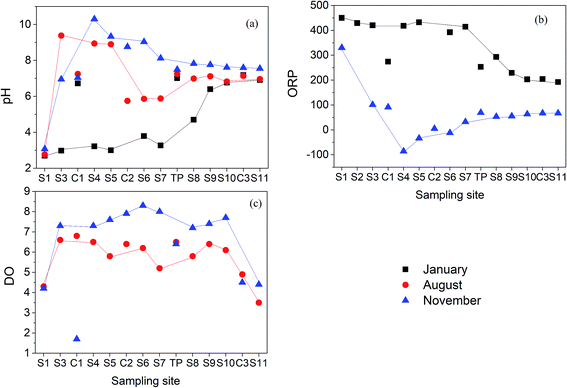
Physicochemical properties of the water at each site are shown in Fig. 2. In January 2016, pH values gradually increased along the Hengshi River (Fig. 2(a)), which was consistent to the previous study.47 However, due to the sewage treatment plant built in S2, pH value of S3 was rapidly raised to 9.38 (in August) and 6.95 (in November), respectively. The highest pH value can reach to 10.3 (in November) in S4, and then gradually decreased to neutral pH in S11 (pH = 7.55). The dilution of water by tributaries (C1) and rainfall may result in the decrease of pH from S4–S7 sites. Phase transformation of metastable secondary minerals in the sediments with the release of H+ such as the transformation of schwertmannite to goethite as shown in eqn (3) may also play some roles on the decreased pH values.| Fe8O8(OH)6SO4(s) + 2H2O → 8FeOOH(s) + SO42− + 2H+ | (3) |
In January, the ORP (Fig. 2(b)) ranged from +192 to +442 mV in the Hengshi River, while the value ranged from −86 to +332 mV in November. Changes of ORP was closely connected with pH changes from January to November. The DO values (Fig. 2(c)) in the Hengshi River were above 3.5 mg L−1, with further elevation in the winter (November).
S1 was seriously polluted by AMD and an area with high concentrations of sulfate (>4008.04 mg L−1) and heavy metals (e.g. Fe > 347.78 mg L−1; Zn > 96.48 mg L−1) (Fig. 3). In all investigated seasons, the concentration of SO42− decreased with the increased distance from the headwater region. Concentrations of most of the major cations decreased from the S1 to S11 in January, including total Fe (from 646.13 to 0.10 mg L−1), Zn (from 116.82 to 0.02 mg L−1), Cu (from 11.89 to 0.01 mg L−1), Mg (from 230.54 to 3.11 mg L−1), but the concentration of Ca increased in S3, which might be attributed to the addition of CaCO3 from the sewage plant. Furthermore, the concentrations of heavy metals decreased to extremely low in S3 (e.g. Fe: 0.21 mg L−1; Cu: 0.02 mg L−1; Zn: 0.36 mg L−1) of the samples collected in August and November with the elevated pH.
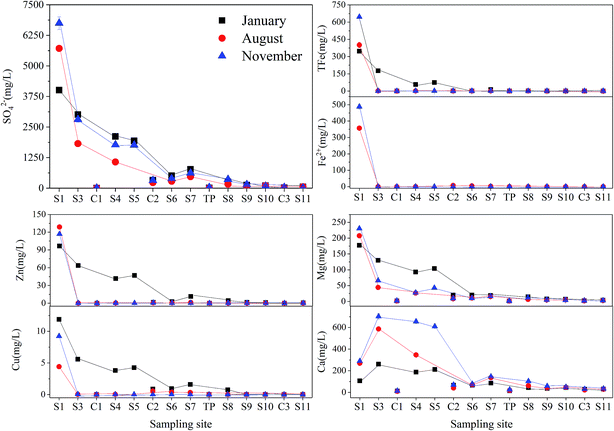 | ||
| Fig. 3 Concentrations of major ions, including SO42−, total Fe, Fe2+, Zn, Cu, Mg and Ca, in Hengshi River in Jan/Aug/Nov 2016. | ||
Statistical analysis of surface-water chemistry results (Table 1) confirmed the relationship between sulfide (such as pyrite and sphalerite etc.) oxidation and heavy metals concentrations. High concentrations of Fe (646.13 mg L−1) and Zn (128.87 mg L−1) with relatively lower concentrations of Ca (24.30 mg L−1) in the mud impoundment (S0, data are not shown) suggested that most of the sulfate was derived from sulphide oxidation, rather than the dissolution of sulfate minerals, such as gypsum.51
| pH | ORP | δ34S | δ18O | SO42− | Fe | Cu | Zn | Mn | Ca | Mg | |
|---|---|---|---|---|---|---|---|---|---|---|---|
| pH | 1.000 | ||||||||||
| ORP | −0.957 | 1.000 | |||||||||
| δ34S | 0.326 | −0.348 | 1.000 | ||||||||
| δ18O | 0.657 | −0.676 | 0.889 | 1.000 | |||||||
| SO42− | −0.623 | 0.478 | −0.504 | −0.372 | 1.000 | ||||||
| Fe | −0.628 | 0.516 | −0.302 | −0.288 | 0.893 | 1.000 | |||||
| Cu | −0.580 | 0.478 | −0.318 | −0.264 | 0.659 | 0.617 | 1.000 | ||||
| Zn | −0.776 | 0.659 | −0.392 | −0.338 | 0.903 | 0.846 | 0.678 | 1.000 | |||
| Mn | −0.732 | 0.573 | −0.391 | −0.368 | 0.829 | 0.716 | 0.818 | 0.930 | 1.000 | ||
| Ca | 0.152 | −0.210 | −0.474 | −0.359 | 0.479 | 0.153 | 0.044 | 0.158 | 0.121 | 1.000 | |
| Mg | −0.712 | 0.605 | −0.468 | −0.371 | 0.973 | 0.924 | 0.643 | 0.930 | 0.811 | 0.351 | 1.000 |
pH values are inversely correlated to the concentration of most dissolved metals and SO42− (Table 1), indicating the link of sulfuric acid generation and sulfide oxidation. The correlation may due to the pH-dependent complexing of components between the precipitated solid phases and metals dissolved in AMD liquid phases. These components at different pH may cause pH-induced sorption and/or precipitation reactions and decrease of solubility.2,52 The clear positive relationship between heavy metals and SO42− may indicate the dominated migration of SO42− associated with the co-precipitation of secondary minerals with heavy metals.50
3.2 Sediments chemistry
As shown in Fig. 4(a), the concentrations of the sediment organic matter (OM) slightly increased along the river. Particularly in August, OM increased significantly at S8 due to the addition of the domestic sewage from Shangba Village. Furthermore, the concentrations of OM were always lower in the November than that in the August. Concentrations of WS and ExS at these sites (from S3 to S7) (Fig. 4(b)) changed a lot with the seasonal variation. In August, ExS at S7 reached to 12.93 mg g−1, which can be explained by the formation of secondary minerals like schwertmannite or jarosite. In November, WS and ExS at S4 increased to 6.63 and 15.96 mg g−1, respectively, which may be a result from the precipitation of gypsum.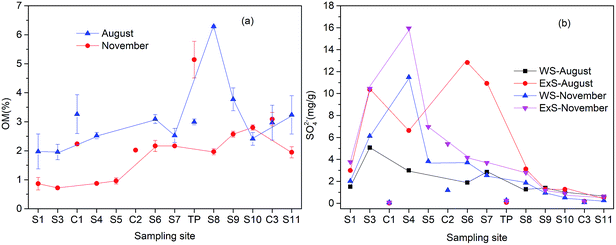 | ||
| Fig. 4 Concentration distributions of organic matter (OM) (a), water soluble sulfate (WS) and exchangeable sulfate (ExS) (b) in sediment samples along the Hengshi River. | ||
XRD results (Fig. 5) indicate that surface sediments at S1, S4 and S7 were mainly composed of kaolinite, gismondine, quartz and iron oxides (mainly in forms of goethite and ferrihydrite). Schwertmannite were also observed at S7 through SEM analysis, which was corresponding to the high concentration of ExS detected at S7 in August. Similar results were previously divulgated by others authors.53–55 The present study helps to demonstrate the importance of geochemistry. Therefore the present study is of great importance for the advancement of science.
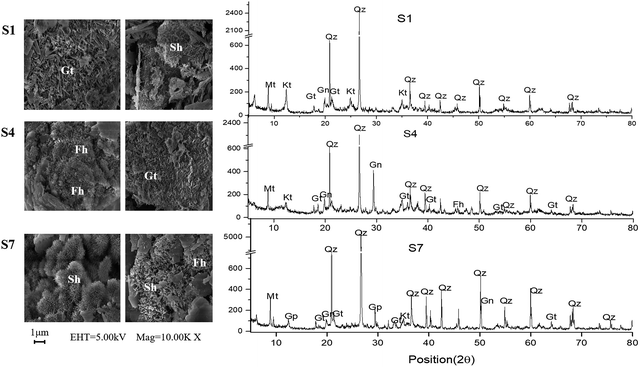 | ||
| Fig. 5 XRD and SEM of surface sediments in the river in August (Mt – muscovite, Qz – quartz, Kt – kaolinite, Gn – gismondine, Gp – gypsum, Gt – goethite, Sh – schwertmannite, Fh – ferrihydrite). | ||
3.3 S and O isotope compositions of dissolved sulfate
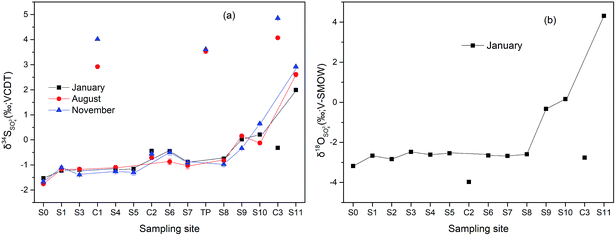
Variations of δ34S and δ18O of dissolved SO42− along the Hengshi River are shown in Fig. 6. In Jan/Nov/Dec 2016, the δ34S of dissolved SO42− in the Hengshi River gradually increased from −1.23‰ to +1.99‰ from the headwater region (S1) to the Wengjiang River (S11). Similarly, δ18O values (only in January) of dissolved SO42− gradually increased from −2.66‰ to +4.31‰ along the river. The water of mud impoundment (S0) had the lowest value of δ34S of −1.53‰. Results showed (Fig. 6) the relatively stable values for S and O isotope before S8 (−1.53‰ ∼ −0.88‰ and −3.18‰ ∼ −2.68‰, respectively) and the increasingly values after S8 (−0.88‰ ∼ +1.99‰, and −2.68‰ ∼ +4.31‰, respectively). However, there was a slight increase of δ34S at S6, which may be caused by the heterogeneous mixture of water from C2 and S5 because S6 was sited near the intersection. The collected surface water of C2, polluted by the AMD from the tailing impoundment, showed similar values (δ34S = −0.44‰, δ18O = − 3.97‰) with observed in the upper stream. Nevertheless, S isotope values of water collected from the unpolluted river (C1, C3 and TP) were much higher than that collected from the polluted river. One tributary sample (C3) taken in January has a significantly lower concentration of δ34S compared with other samples that were taken from August and November. In addition, other samples did not display any obvious season-related effects.It is well-known that oxidation of sulfides to SO42− is generally accompanied by only a minimal fractionation essentially retaining the original isotopic composition of the sulfide minerals.56 Accordingly, the stable values for S isotope at S0 (−1.75‰ ∼ −1. 53‰) may suggested that most sulfate in the upper stream is derived from sulphide oxidation which typically has negative δ34S values.57 However, sulfate could also be influenced by other processes, which mainly included: (1) mixing of sulfate resulted from human activities and tributaries, (2) atmospheric deposition, (3) precipitated as secondary mineral, (4) bacterial (dissimilatory) sulfate reduction.58–61
In order to calculate the average enrichment factors for 34S and 18O during bacterial sulfate reduction, we use Rayleigh equations64 (eqn (4) and (5)) as follows:
δ34SSO42− = δ34SSO42− − initial + ε![[thin space (1/6-em)]](https://www.rsc.org/images/entities/char_2009.gif) ln ln![[thin space (1/6-em)]](https://www.rsc.org/images/entities/char_2009.gif) f f
| (4) |
δ18OSO42− = δ18OSO42− − initial + ε![[thin space (1/6-em)]](https://www.rsc.org/images/entities/char_2009.gif) ln ln![[thin space (1/6-em)]](https://www.rsc.org/images/entities/char_2009.gif) f f
| (5) |
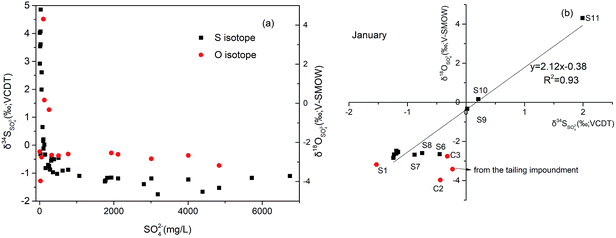
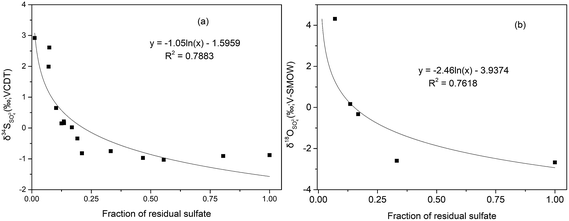
Due to the fact that BSR usually occur in downstream, we can assume that the initial value of SO42− concentration (770.46 mg L−1) at S7 in January as the highest measured sulfate concentration to calculate the fraction of the residual sulfate (f = CSO42− − measured/CSO42− − initial) from S7 to S11. From these logarithmic functions in Fig. 8, the enrichment factors for sulfur and oxygen were calculated to be −1.05‰ (ε34S) and −2.46‰ (ε18O), with correlation coefficient (R2) of 0.79 and 0.76, respectively. However compared with other study on sulfur isotope enrichment factors for BSR in nature, our ε34S value is relatively low (e.g.: Schroth et al., 2001: −21.5‰,66 Spence et al., 2001: −9.4‰,67 Bolliger et al., 2001: −23.5‰ (ref. 68)), but not unusual (e.g. Mandernack et al., 2000: −2.6‰ (ref. 69)). Similarly, the value of ε18O was smaller than that calculated in the study which is −3.6‰.64 The low isotope enrichment factors of S and O could be attributed to dilution, which can decrease the concentration of SO42−, then lower the value of fraction of residual sulfate, but have no effect on the values of δ34SSO42−.
4. Conclusions
Mining activities in Dabaoshan Mine area have produced large amount of AMD, characterized by extremely low pH values (2.63–2.98), and high concentrations of heavy metals (e.g. Fe: >347.78 mg L−1; Zn: >96.48 mg L−1) and SO42− (>4008.04 mg L−1) which is isotopically depleted in both 34S and 18O. According to the regional distribution of concentrations and isotope ratios of sulfate, sulfide oxidation is the major source in upper stream, followed by precipitating as iron hydroxides (like jarosite, schwertmannite) along the river. Dilution by tributary water (C1 and TP) and precipitation of SO42− minerals decreases the concentration of SO42−, and results in a minimal fractionation on the S and O isotope composition on sulfate. On the other hand, the pattern of δ34S of soluble sulfates shows no substantial seasonal variations during the investigation, which indicates that atmospheric deposition through raining also failed to exert an obvious on the δ34S values.Because of the suitable environment (e.g. neutral pH, and adequate organic materials available) in the downstream, the extent of bacterial sulfate reduction increased gradually in the direction of river flow, which was in consistent with the rapid positive shift in the sulfur and oxygen isotope composition of the dissolved sulfate in the downstream. From the relationship between the fraction of the residual sulfate and the δ34S and δ18O values in the downstream (after S7), the enrichment factors for sulfur and oxygen isotope were calculated to be −1.05‰ and −2.46‰, respectively.
In general, S and O isotope investigations are found to be useful tools to identify the sources and transformations of sulfur as well as the influence by bacterial sulfate reduction, which will lay a foundation for the remediation strategies of AMD.
Conflicts of interest
We have read your policy on Conflict of interest and confirm that there are no conflicts to declare.Acknowledgements
This work was financially supported by National Natural Science Foundation of China (No.41330639 and 41720104004), the National Key Technology Support Program (No. 2015BAD05B05), and the Guangdong Natural Science Funds for Distinguished Young Scholar (No. 2015A030306005).References
- C. Wisskirchen, B. Dold, K. Friese, J. E. Spangenberg, P. Morgenstern and W. Glaesser, Appl. Geochem., 2010, 25, 1107–1119 CrossRef CAS.
- M. Edraki, S. Golding, K. Baublys and M. Lawrence, Appl. Geochem., 2005, 20, 789–805 CrossRef CAS.
- P. Swedlund and J. Webster, Appl. Geochem., 2001, 16, 503–511 CrossRef CAS.
- P. J. Swedlund, J. G. Webster and G. M. Miskelly, Appl. Geochem., 2003, 18, 1671–1689 CrossRef CAS.
- K. Fukushi and D. A. Sverjensky, Geochim. Cosmochim. Acta, 2007, 71, 1–24 CrossRef CAS.
- B. K. Saikia, A. C. Dalmora, R. Choudhury, T. Das, S. R. Taffarel and L. F. Silva, Ultrason. Sonochem., 2016, 32, 147 CrossRef CAS PubMed.
- M. Civeira, M. L. S. Oliveira, J. C. Hower, D. M. Agudelo-Castañeda, S. R. Taffarel, C. G. Ramos, R. M. Kautzmann and L. F. O. Silva, Environ. Sci. Pollut. Res., 2015, 23, 6535–6545 CrossRef PubMed.
- M. S. Civeira, C. G. Ramos, M. L. Oliveira, R. M. Kautzmann, S. R. Taffarel, E. C. Teixeira and L. F. Silva, Chemosphere, 2016, 145, 142–147 CrossRef CAS PubMed.
- D. K. Nordstrom and C. N. Alpers, Environmental Geochemistry of Mineral Deposits, 1999, 6, 133–160 Search PubMed.
- S. L. Simpson, S. C. Apte and C. M. Davies, Environ. Chem., 2005, 2, 49–55 CrossRef CAS.
- M. Gleisner, R. B. Herbert and P. C. F. Kockum, Chem. Geol., 2006, 225, 16–29 CrossRef CAS.
- D. W. Schindler, R. Wagemann, R. B. Cook, T. Ruszczynski and J. Prokopowich, Int. J. Bifurcation Chaos Appl. Sci. Eng., 1979, 8, 173–178 Search PubMed.
- K. A. Brown, Soil Biol. Biochem., 1985, 17, 39–45 CrossRef CAS.
- J. W. M. Rudd, C. A. Kelly and A. Furutani, Limnol. Oceanogr., 1986, 31, 1281–1291 CrossRef CAS.
- M. Koschorreck, FEMS Microbiol. Ecol., 2008, 64, 329–342 CrossRef CAS PubMed.
- P. A. Trudinger, Early Organic Evolution, 1992, pp. 367–377 Search PubMed.
- B. B. Jørgensen, Mccarthy, 1982, 296, 643–645 Search PubMed.
- H. Sass, H. Cypionka and H. D. Babenzien, FEMS Microbiol. Ecol., 1997, 22, 245–255 CrossRef CAS.
- D. E. Canfield and R. Raiswell, in Taphonomy: Releasing the Data Locked in the Fossil Record, ed. P. A. Allison and D. E. G. Briggs, PlenumPress, 1991, pp. 337–38 Search PubMed.
- R. A. Berner, Am. J. Sci., 1970, 268, 1–23 CrossRef CAS.
- M. A. Vile and R. K. Wieder, Water, Air, Soil Pollut., 1993, 69, 425–441 CrossRef CAS.
- A. Fauville, B. Mayer, R. Frommichen, K. Friese and J. Veizer, Chem. Geol., 2004, 204, 325–344 CrossRef CAS.
- R. S. Thurston, K. W. Mandernack and W. C. Shanks III, Chem. Geol., 2010, 269, 252–261 CrossRef CAS.
- A. Szynkiewicz, M. Modelska, S. Buczyński, D. M. Borrok and J. P. Merrison, Geochim. Cosmochim. Acta, 2013, 106, 326–343 CrossRef CAS.
- M. Junghans and M. Tichomirowa, Appl. Geochem., 2009, 24, 2034–2050 CrossRef CAS.
- P. Kroopnick and H. Craig, Science, 1972, 175, 54 CAS.
- R. Seal, Environmental Aspects of Mine Wastes, 2003, vol. 31, pp. 303–334 Search PubMed.
- H. Chiba and H. Sakai, Geochim. Cosmochim. Acta, 1985, 49, 993–1000 CrossRef CAS.
- A. V. Turchyn, V. Brüchert, T. W. Lyons, G. S. Engel, N. Balci, D. P. Schrag and B. Brunner, Geochim. Cosmochim. Acta, 2010, 74, 2011–2024 CrossRef CAS.
- K. Knöller, C. Vogt, H. H. Richnow and S. M. Weise, Environ. Sci. Technol., 2006, 40, 3879–3885 CrossRef.
- B. Brunner, S. M. Bernasconi, J. Kleikemper and M. H. Schroth, Geochim. Cosmochim. Acta, 2005, 69, 4773–4785 CrossRef CAS.
- D. E. Canfield, Geochim. Cosmochim. Acta, 2001, 65, 1117–1124 CrossRef CAS.
- M. E. Böttcher, B. Thamdrup and T. W. Vennemann, Geochim. Cosmochim. Acta, 2001, 65, 1601–1609 CrossRef.
- B. Brunner and S. M. Bernasconi, Geochim. Cosmochim. Acta, 2005, 69, 4759–4771 CrossRef CAS.
- P. Zhuang, M. B. Mcbride, H. Xia, N. Li and Z. Li, Sci. Total Environ., 2009, 407, 1551–1561 CrossRef CAS PubMed.
- C. Lin, Y. Wu, W. Lu, A. Chen and Y. Liu, J. Hazard. Mater., 2007, 142, 199–207 CrossRef CAS PubMed.
- A. Chen, C. Lin, W. Lu, Y. Wu, Y. Ma, J. Li and L. Zhu, Chemosphere, 2007, 70, 248–255 CrossRef CAS PubMed.
- F. Yuan and B. Mayer, Chem. Geol., 2012, 291, 13–22 CrossRef CAS.
- K. Martinello, M. L. Oliveira, F. A. Molossi, C. G. Ramos, E. C. Teixeira, R. M. Kautzmann and L. F. Silva, Sci. Total Environ., 2014, 470–471, 444–452 CrossRef CAS PubMed.
- D. B. K. Saikia, Int. J. Coal Geol., 2014, 121, 26–34 CrossRef.
- D. Arenas-Lago, F. A. Vega, L. F. O. Silva, M. Lago-Vila and L. Andrade, Fresenius Environ. Bull., 2014, 23, 1025–1035 CAS.
- C. M. N. L. Cutruneo, M. L. S. Oliveira, C. R. Ward, J. C. Hower, I. A. S. D. Brum, C. H. Sampaio, R. M. Kautzmann, S. R. Taffarel, E. C. Teixeira and L. F. O. Silva, Int. J. Coal Geol., 2014, 130, 33–52 CrossRef CAS.
- F. H. T. Osório, L. F. O. Silva, L. D. S. Piancini, A. C. B. Azevedo, S. Liebel, F. Y. Yamamoto, V. P. Philippi, M. L. S. Oliveira, C. F. Ortolani-Machado and F. F. Neto, Environ. Sci. Pollut. Res. Int., 2014, 21, 9145–9160 Search PubMed.
- H. Zhao, B. Xia, C. Fan, P. Zhao and S. Shen, Sci. Total Environ., 2012, 417, 45–54 CrossRef PubMed.
- P. Zhuang, M. B. McBride, H. Xia, N. Li and Z. Li, Sci. Total Environ., 2009, 407, 1551–1561 CrossRef CAS PubMed.
- J. Liao, Z. Wen, X. Ru, J. Chen, H. Wu and C. Wei, Ecotoxicol. Environ. Saf., 2016, 124, 460–469 CrossRef CAS PubMed.
- M. Chen, G. Lu, C. Guo, C. Yang, J. Wu, W. Huang, N. Yee and Z. Dang, Chemosphere, 2015, 119, 734–743 CrossRef CAS PubMed.
- C. Boukhalfa, Desalination, 2010, 250, 428–432 CrossRef CAS.
- C. Yang, G. Lu, M. Chen, Y. Xie, C. Guo, J. Reinfelder, X. Yi, H. Wang and Z. Dang, Geoderma, 2016, 281, 21–29 CrossRef CAS.
- M. E. E. Madden, A. S. Madden, J. D. Rimstidt, S. Zahrai, M. R. Kendall and M. A. Miller, Geochim. Cosmochim. Acta, 2012, 91, 306–321 CrossRef.
- C. G. Hubbard, S. Black and M. L. Coleman, Chem. Geol., 2009, 265, 321–334 CrossRef CAS.
- Y. Xie, G. Lu, H. Ye, C. Yang, X. Yi and Z. Dang, J. Environ. Qual., 2017 DOI:10.2134/jeq2017.03.0122.
- J. Ribeiro, S. R. Taffarel, C. H. Sampaio, D. Flores and L. F. O. Silva, Int. J. Coal Geol., 2013, 109–110, 15–23 CrossRef CAS.
- J. Sanchis, D. Bozovic, M. Farre, A. N. Al-Harbi and F. L. Silva, Anal. Bioanal. Chem., 2013, 405, 5915–5923 CrossRef CAS PubMed.
- L. F. O. Silva, F. O. D. Vallejuelo, I. Martinez-Arkarazo, K. Castro, M. L. S. Oliveira, C. H. Sampaio, I. A. S. D. Brum, F. B. D. Leão, S. R. Taffarel and J. M. Madariaga, Sci. Total Environ., 2013, 447, 169–178 CrossRef CAS PubMed.
- C. H. Gammons, T. E. Duaime, S. R. Parker, S. R. Poulson and P. Kennelly, Chem. Geol., 2010, 269, 100–112 CrossRef CAS.
- T. W. Butler, Appl. Geochem., 2007, 22, 1416–1426 CrossRef CAS.
- A. Szynkiewicz, D. M. Borrok, G. Skrzypek and M. S. Rearick, Chem. Geol., 2015, 411, 323–335 CrossRef CAS.
- M. L. W. Tuttle, G. N. Breit and I. M. Cozzarelli, Chem. Geol., 2009, 265, 455–467 CrossRef CAS.
- A. V. Turchyn, E. T. Tipper, A. Galy, J.-K. Lo and M. J. Bickle, Earth Planet. Sci. Lett., 2013, 374, 36–46 CrossRef CAS.
- C. H. Gammons, A. Brown, S. R. Poulson and T. H. Henderson, Appl. Geochem., 2013, 31, 228–238 CrossRef CAS.
- G. Antler, A. V. Turchyn, V. Rennie, B. Herut and O. Sivan, Geochim. Cosmochim. Acta, 2013, 118, 98–117 CrossRef CAS.
- R. Frömmichen, S. Kellner and K. Friese, Environ. Sci. Technol., 2003, 37, 1414–1421 CrossRef.
- K. Knoller, A. Fauville, B. Mayer, G. Strauch, K. Friese and J. Veizer, Chem. Geol., 2004, 204, 303–323 CrossRef CAS.
- X. Li, Y. Gan, A. Zhou, Y. Liu and D. Wang, Appl. Geochem., 2013, 35, 99–109 CrossRef CAS.
- M. H. Schroth, J. Kleikemper, C. Bolliger, S. M. Bernasconi and J. Zeyer, J. Contam. Hydrol., 2001, 51, 179–195 CrossRef CAS PubMed.
- M. J. Spence, S. H. Bottrell, S. F. Thornton and D. N. Lerner, J. Contam. Hydrol., 2001, 53, 285–304 CrossRef CAS PubMed.
- C. Bolliger, M. H. Schroth, S. M. Bernasconi, J. Kleikemper and J. Zeyer, Geochim. Cosmochim. Acta, 2001, 65, 3289–3298 CrossRef CAS.
- K. W. Mandernack, L. Lynch, H. R. Krouse and M. D. Morgan, Geochim. Cosmochim. Acta, 2000, 64, 3949–3964 CrossRef CAS.
Footnote |
| † Electronic supplementary information (ESI) available. See DOI: 10.1039/c7ra07809a |
| This journal is © The Royal Society of Chemistry 2017 |

