
 Open Access Article
 This Open Access Article is licensed under a
 Creative Commons Attribution 3.0 Unported Licence
Facile fabrication of ultra-light and highly resilient PU/RGO foams for microwave absorption†
Chunmei Zhang‡
a,
Hua Li‡ *ab,
Zhangzhi Zhuoc,
Roberto Dugnanid,
Chongyang Suna,
Yujie Chen*a and
Hezhou Liuab
*ab,
Zhangzhi Zhuoc,
Roberto Dugnanid,
Chongyang Suna,
Yujie Chen*a and
Hezhou Liuab
aState Key Laboratory of Metal Matrix Composites, School of Materials Science and Engineering, Shanghai Jiao Tong University, Dongchuan Road No. 800, Shanghai 200240, China. E-mail: lih@sjtu.edu.cn; yujiechen@sjtu.edu.cn
bCollaborative Innovation Center for Advanced Ship and Deep-Sea Exploration, Shanghai Jiao Tong University, China
cWuHu State-Owned Factory of Machining, Jiujiang District Wanli Village No. 99, WuHu 241000, China
dUniversity of Michigan–Shanghai Jiao Tong University Joint Institute, China
First published on 23rd August 2017
Abstract
Using commercial polyurethane foams as templates, PU/RGO foams were prepared by a simple dip-coating method, which is economical and suitable for industrialized production. The formation of RGO was studied using X-ray diffraction (XRD), X-ray photoelectron spectroscopy (XPS), Raman spectroscopy, and scanning electron microscopy (SEM). The microwave absorption properties of the PU/RGO foams were investigated and the results show that for composites with a RGO loading of 31.3 wt%, the minimum reflection loss of the PU/RGO foam can reach −50.8 dB at 12.9 GHz, and the frequency bandwidth at less than −10 dB is from 10.75 to 15.95 GHz at a thickness of 2.5 mm. In addition, the results of cyclic compression tests and twisting experiments indicated that the PU/RGO composite was highly resilient. Moreover, the measured density of the foam material is just approximately 0.027 g cm−3 which is considerably smaller compared with most commercial wave-absorbing materials. The fabricated PU/RGO foams can be used as good microwave absorbing commercial cladding materials, with particularly lightweight and highly elastic properties.
1. Introduction
Microwave absorbing materials are becoming increasingly important due to the extensive use of wireless communication devices.1–3 Microwave absorbing materials with low density, superior mechanical performance, and good wave-absorption ability are in high demand in various fields, such as civil, military and aerospace applications.4,5 Graphene is essentially a two-dimensional (2D) sheet composed of sp2-bonded carbon atoms which is extensively researched due to its excellent electrical, thermal, mechanical properties and high specific surface area.6–8 Recently graphene has been widely used in applications such as super capacitors,9–11 oil absorption materials,12–14 sensors,15–17 and polymer composites.18–21Good electrical conductivity is harmful for EM wave absorption according to the impedance match mechanism, and due to the high conductivity, graphene has a strong dielectric loss but a weak attenuation to microwaves. However, chemically reduced graphene oxide (RGO) with residual defects and functional groups possesses considerably lower conductivity and improved impedance-match characteristics. Wang et al.22 found that besides dielectric loss, defect polarization relaxation and functional groups' electronic dipole relaxation were also introduced into RGO, which was beneficial for the improvement of microwave absorbing properties of the material. Recently, graphene-containing materials play an important role in electromagnetic wave absorbers. Zhang et al.23 synthesized RGO/CuS/PVDF composites and with a filler loading of 5 wt%, the maximum loss was −32.7 dB at 10.7 GHz with a thickness of just 2.5 mm. Pan et al.24 studied the microwave absorption properties of Fe3O4@SiO2@RGO nanocomposites with a maximum reflection loss up to −26.6 dB at 9.7 GHz and the bandwidth below −10 dB being from 4.4 to 17.3 GHz. Wang et al.25 fabricated RGO/Co3O4/poly(vinylidene fluoride) composites, and with a filler loading of 10 wt%, the composite showed excellent microwave absorbing properties with reflection loss low to −25.05 dB at 11.6 GHz at a thickness of 4 mm. Guo et al.26 prepared rGO@MoS2/PVDF composites, and the maximum reflection loss can reach −43.1 dB at 14.48 GHz with a filling rate of only 5.0 wt%, and the frequency bandwidth below −10 dB was 3.6–17.8 GHz with a thickness of 1–5 mm. Guo et al.27 fabricated rGO@barium titanate/poly(vinylidene fluoride) (PVDF) composite exhibiting the highest reflection coefficients up to −33.2, −45.3, −32.9 and −22.8 dB with filler amounts of 10, 15, 20 and 25 wt% at thicknesses of 1–5 mm. Luo et al.28 synthesized a ternary composite composed of reduced graphene oxide, Fe3O4 porous nanospheres and polyaniline with a reflection loss reaching −29.51 dB at 14.69 GHz. Kowsari et al.29 prepared magnetic functional graphene oxide (MFGO)/epoxy resin composite and it showed excellent microwave absorption property in the range of 8.0–12.0 GHz with a maximum reflection loss reaching −25.21 dB at 8.62 GHz. The graphene-containing composites mentioned above exhibited excellent microwave absorption properties, however, the polymers and the magnetic metals used result in high weight penalty particularly for applications on airborne systems. Also, the fabrication process are complicated and the prepared materials can't be deformed or fabricated into specific shape easily according to some specific usage requirements.
In this work, lightweight and highly elastic three-dimentional porous PU/RGO foams were fabricated by a simple dip-coating method using commercial polyurethane foams as template. The microwave absorption properties of the foams were measured and the possible mechanisms were briefly discussed in the paper.
2. Experimental
2.1 Materials
The polyurethane foams we used were purchased from Sichuan Hongchang Plastics Industrial Co., Ltd., China (brand name is “Maryya”) without additional processing. Hydrazine hydrate (H4N2·xH2O, AR, ≥85.0%), sodium nitrate (NaNO3, AR, ≥99.0%), potassium permanganate (KMnO4, AR, ≥99.5%), concentrated sulfuric acid (H2SO4, AR, 95.0–98.0%), hydrochloric acid (HCl, AR, 36.0–38.0%), and hydrogen peroxide (H2O2, AR, ≥30.0%) were purchased from Sinapharm Chemical Reagent Co., Ltd., China. The graphite powder used was bought from Qingdao Huatai Graphite Co., Ltd., China. Graphene oxide (GO) was prepared by a modified Hummers' method.30 It was shown in Fig. 1 that in the presence of reducing agents and under hydrothermal treatment, GO could be reduced to graphene and self-assembled onto the skeletons of PU foam. The driving forces for the self-assembly were believed to be hydrophobic interactions and π–π stacking between graphene sheets. | ||
| Fig. 1 The schematic fabrication process of PU/RGO foams. | ||
2.2 Fabrication of PU/RGO foams
The schematic fabrication process of PU/RGO foams was shown in Fig. 1. Typically, 150 mg of GO were dispersed into 50 ml of water (i.e., concentration of 3 mg ml−1) and sonicated for 30 min at room temperature to obtain a clear solution. Hydrazine hydrate (375 μl) was added to the GO solution and stirred vigorously for 15 min until mixed uniformly with GO. A commercial PU foam (approximately 30 cm3 in volume) was put into the solution, and after a repeatedly squeezing and a vacuum degassing procedure, the composite was transferred into a 50 ml Teflon vessel. Subsequently, the vessel was sealed and placed in an oven heated to 95 °C for 12 h. After heating in the oven, the resulting monolithic gel-like product was taken out and washed with ethanol and deionized water several times to remove impurities and redundant RGO sheets attached on the foam surface. After dried in an oven at 60 °C for 12 h, the PU/RGO foam named S-3 was obtained. Samples with different GO mass (300, 450, 600, 750 mg) were manufactured as described above and were named as S-6, S-9, S-12 and S-15 (GO concentration of 6, 9, 12 and 15 mg ml−1), respectively. Moreover, the calculated RGO loadings of sample S-3, S-6, S-9, S-12 and S-15 are about 7.16, 15.7, 23.5, 31.3 and 40.8 wt%, respectively. The measured density of sample S-3, S-6, S-9, S-12 and S-15 were about 0.020, 0.023, 0.025, 0.027 and 0.029 g cm−3, respectively. The amount of hydrazine hytrate used was always 2.5 times the amount of GO by weight. In addition, the solution volume we use was 50 ml which was excessive for the 30 cm3 foam to make the foam fully saturated with the GO solution and avoid nonuniform distribution.2.3 Characterizations
The reduction process was characterized by X-ray diffraction (XRD), X-ray photoelectron spectroscopy (XPS) and Raman. Graphene oxide (GO) was prepared by a modified Hummers' method and then grinded into powder for test. Hydrazine hydrate was used to reduce GO into RGO. As described above, typically, a uniform solution of GO and hydrazine hydrate (the amount of hydrazine hytrate used being 2.5 times the amount of GO by weight) was transferred into a 50 ml Teflon vessel and placed in an oven heated to 95 °C for 12 h. The product was then washed with ethanol and deionized water several times and dried in an oven at 60 °C for 12 h to obtain the RGO sheets. Finally the RGO sheets were grinded into powder for test. X-ray diffraction (XRD) spectra were acquired by D/MAX2550/PC using Cu Kα radiation from 8° to 80° at a scan rate of 5° min−1 under 35 kV and 200 mA. X-ray photoelectron spectroscopy (XPS) was recorded using a Kratos Axis Ultra DLD spectrometer. Raman spectra were taken on a SENTERRA R200 Raman spectrometer with a 532 nm laser excitation. Scanning electron microscopy (SEM) images were obtained on a Hitachi S-4800 field-emission SEM operated at 10 kV. The composite samples used for microwave absorption measurement were prepared using two punchers (one with an inner diameter of 7.00 mm and the other one with an outer diameter of 3.04 mm) to obtain toroidal-shaped samples (φout, 7.00 mm; φin, 3.04 mm). Compression tests were carried out on a universal testing machine (BTC-T1-FR020 TN. A50, Zwick, GER). Rectangle blocks (50 × 30 × 20 mm) were tested at a constant load/unload speed of 6 mm min−1 with a maximum strain of 50% by 100 compression cycles. In addition, a twist experiment and compression tests with a maximum strain of 90% were also conducted to test its elastic deformation restorability in high stress.3. Results and discussion
As shown in Fig. 1, hydrazine hydrate was used to reduce GO and after hydrothermal reduction, RGO self-assembled spontaneously onto the skeletons of polyurethane sponges to form PU/RGO foam. The reduction process was proved by XRD patterns, XPS and Raman spectra. As shown in Fig. 2(a), the XRD pattern of GO exhibits a feature diffraction peak at about 10.3°. For RGO, this peak disappears and a relatively broad peak at about 25° is observed, which indicates that GO has been transformed into reduced graphene with significantly less functionalities.31,32 Fig. 2(b) shows the C 1s XPS spectra of GO, and the four different peaks centered at 284.8, 286.6, 287.6 and 289.1 eV corresponding to C![[double bond, length as m-dash]](https://www.rsc.org/images/entities/char_e001.gif) C/C–C, C–O, CO and O–CO are observed. For RGO, the intensity of the peaks corresponding to oxygen-containing groups decrease dramatically especially for C–O peak as shown in Fig. 2(c), demonstrating a considerable reduction of GO.33 The results confirm the removal of oxygen groups after reduction and indicate that the delocalized π conjugation is restored in our RGO sample. The Raman spectra of GO and RGO are shown in Fig. 2(d). The peak centered at 1346 cm−1 is assigned to the D band, which is associated with the structural imperfections caused by the defects and functional groups. The peak located at 1576 cm−1 is attributed to the G band, which is characteristic of the sp2-hybridized carbon–carbon bonds.34 The peak area ratio of the D band to the G band for RGO is increased from 1.58 to 2.10 when compared with that of GO. According to previous reports, the increase in the ratio of A(D)/A(G) indicates that more numerous but smaller sp2 carbon domains have partially recovered after the reduction.35 The results gained from XRD, XPS and Raman spectroscopy strongly suggest that GO is effectively reduced to RGO by hydrazine hydrate.
C/C–C, C–O, CO and O–CO are observed. For RGO, the intensity of the peaks corresponding to oxygen-containing groups decrease dramatically especially for C–O peak as shown in Fig. 2(c), demonstrating a considerable reduction of GO.33 The results confirm the removal of oxygen groups after reduction and indicate that the delocalized π conjugation is restored in our RGO sample. The Raman spectra of GO and RGO are shown in Fig. 2(d). The peak centered at 1346 cm−1 is assigned to the D band, which is associated with the structural imperfections caused by the defects and functional groups. The peak located at 1576 cm−1 is attributed to the G band, which is characteristic of the sp2-hybridized carbon–carbon bonds.34 The peak area ratio of the D band to the G band for RGO is increased from 1.58 to 2.10 when compared with that of GO. According to previous reports, the increase in the ratio of A(D)/A(G) indicates that more numerous but smaller sp2 carbon domains have partially recovered after the reduction.35 The results gained from XRD, XPS and Raman spectroscopy strongly suggest that GO is effectively reduced to RGO by hydrazine hydrate.
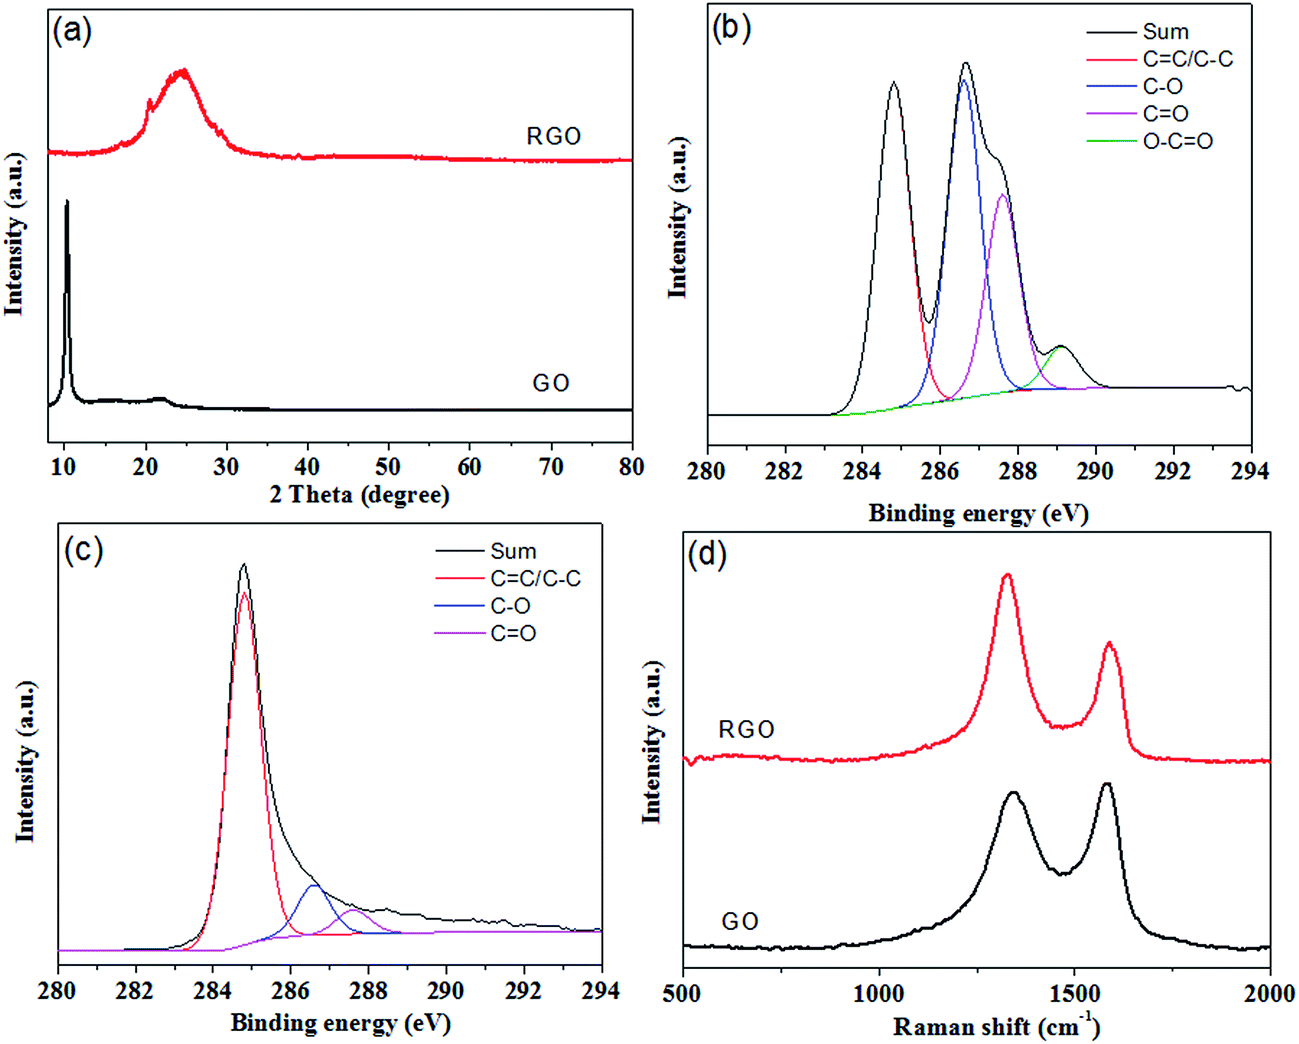 | ||
| Fig. 2 (a) XRD patterns of GO and RGO. (b) C 1s XPS spectra of GO. (c) C 1s XPS spectra of RGO. (d) Raman spectra of GO and RGO. | ||
The internal structure and the surface morphology of the prepared PU/RGO foams with different GO loadings were observed by scanning electron microscope and the SEM images with different magnifications were shown in Fig. 3 and S1,† respectively. It can be seen that the PU foam template possesses a three-dimensional highly porous structure with uniform pore size approximately several hundred micrometers. Being the PU foam highly absorbent, the solution of GO and hydrazine hydrate can be effectively diffused into the foams by repeatedly squeezing. Then after the reduction and drying process, it is found that the RGO sheets could be attached tightly on the skeletons or pores of the PU foams. From the SEM pictures of sample S-3 (Fig. 3(c) and (d)), it can be found that RGO sheets are distributed scatteredly on the skeleton of the PU foam. For sample S-6, the skeleton of the PU foam is mostly covered with RGO sheets and some pores can also be blocked by some RGO sheets (Fig. 3(e) and (f)). For sample S-9 with a RGO loading of 23.5 wt%, most of the pores of the PU foam are covered with RGO sheets and more RGO sheets stack on the skeletons as shown in Fig. 3(g) and (h). As the GO loading continues increasing to 31.3 wt% (i.e., S-12), more aggregates of RGO stacks are found, and the skeletons of the PU foam are slightly distorted (Fig. 3(i) and (j)). For sample S-15 with RGO loading of about 40.8 wt%, the RGO sheets stacks are severe and the skeletons of the PU foam are obviously deformed (Fig. 3(k) and (l)). Fig. S2† is the photographs of the prepared PU/RGO samples with different GO contents. It can be found that sample S-3, S-6 and S-9 all retain the original structure and shape of the PU template, while sample S-12 exhibits slight volume shrinkage, and sample S-15 shows severe volume shrinkage. This is because that in the hydrothermal reduction process, the oxygen-containing functional groups of the GO sheets are removed, and it is reduced into hydrophobic RGO sheets. With increasing RGO content, stronger van der Waals' force is generated through π–π complexation interactions of RGO sheets, which make the framework of the foam shrink to some extent.
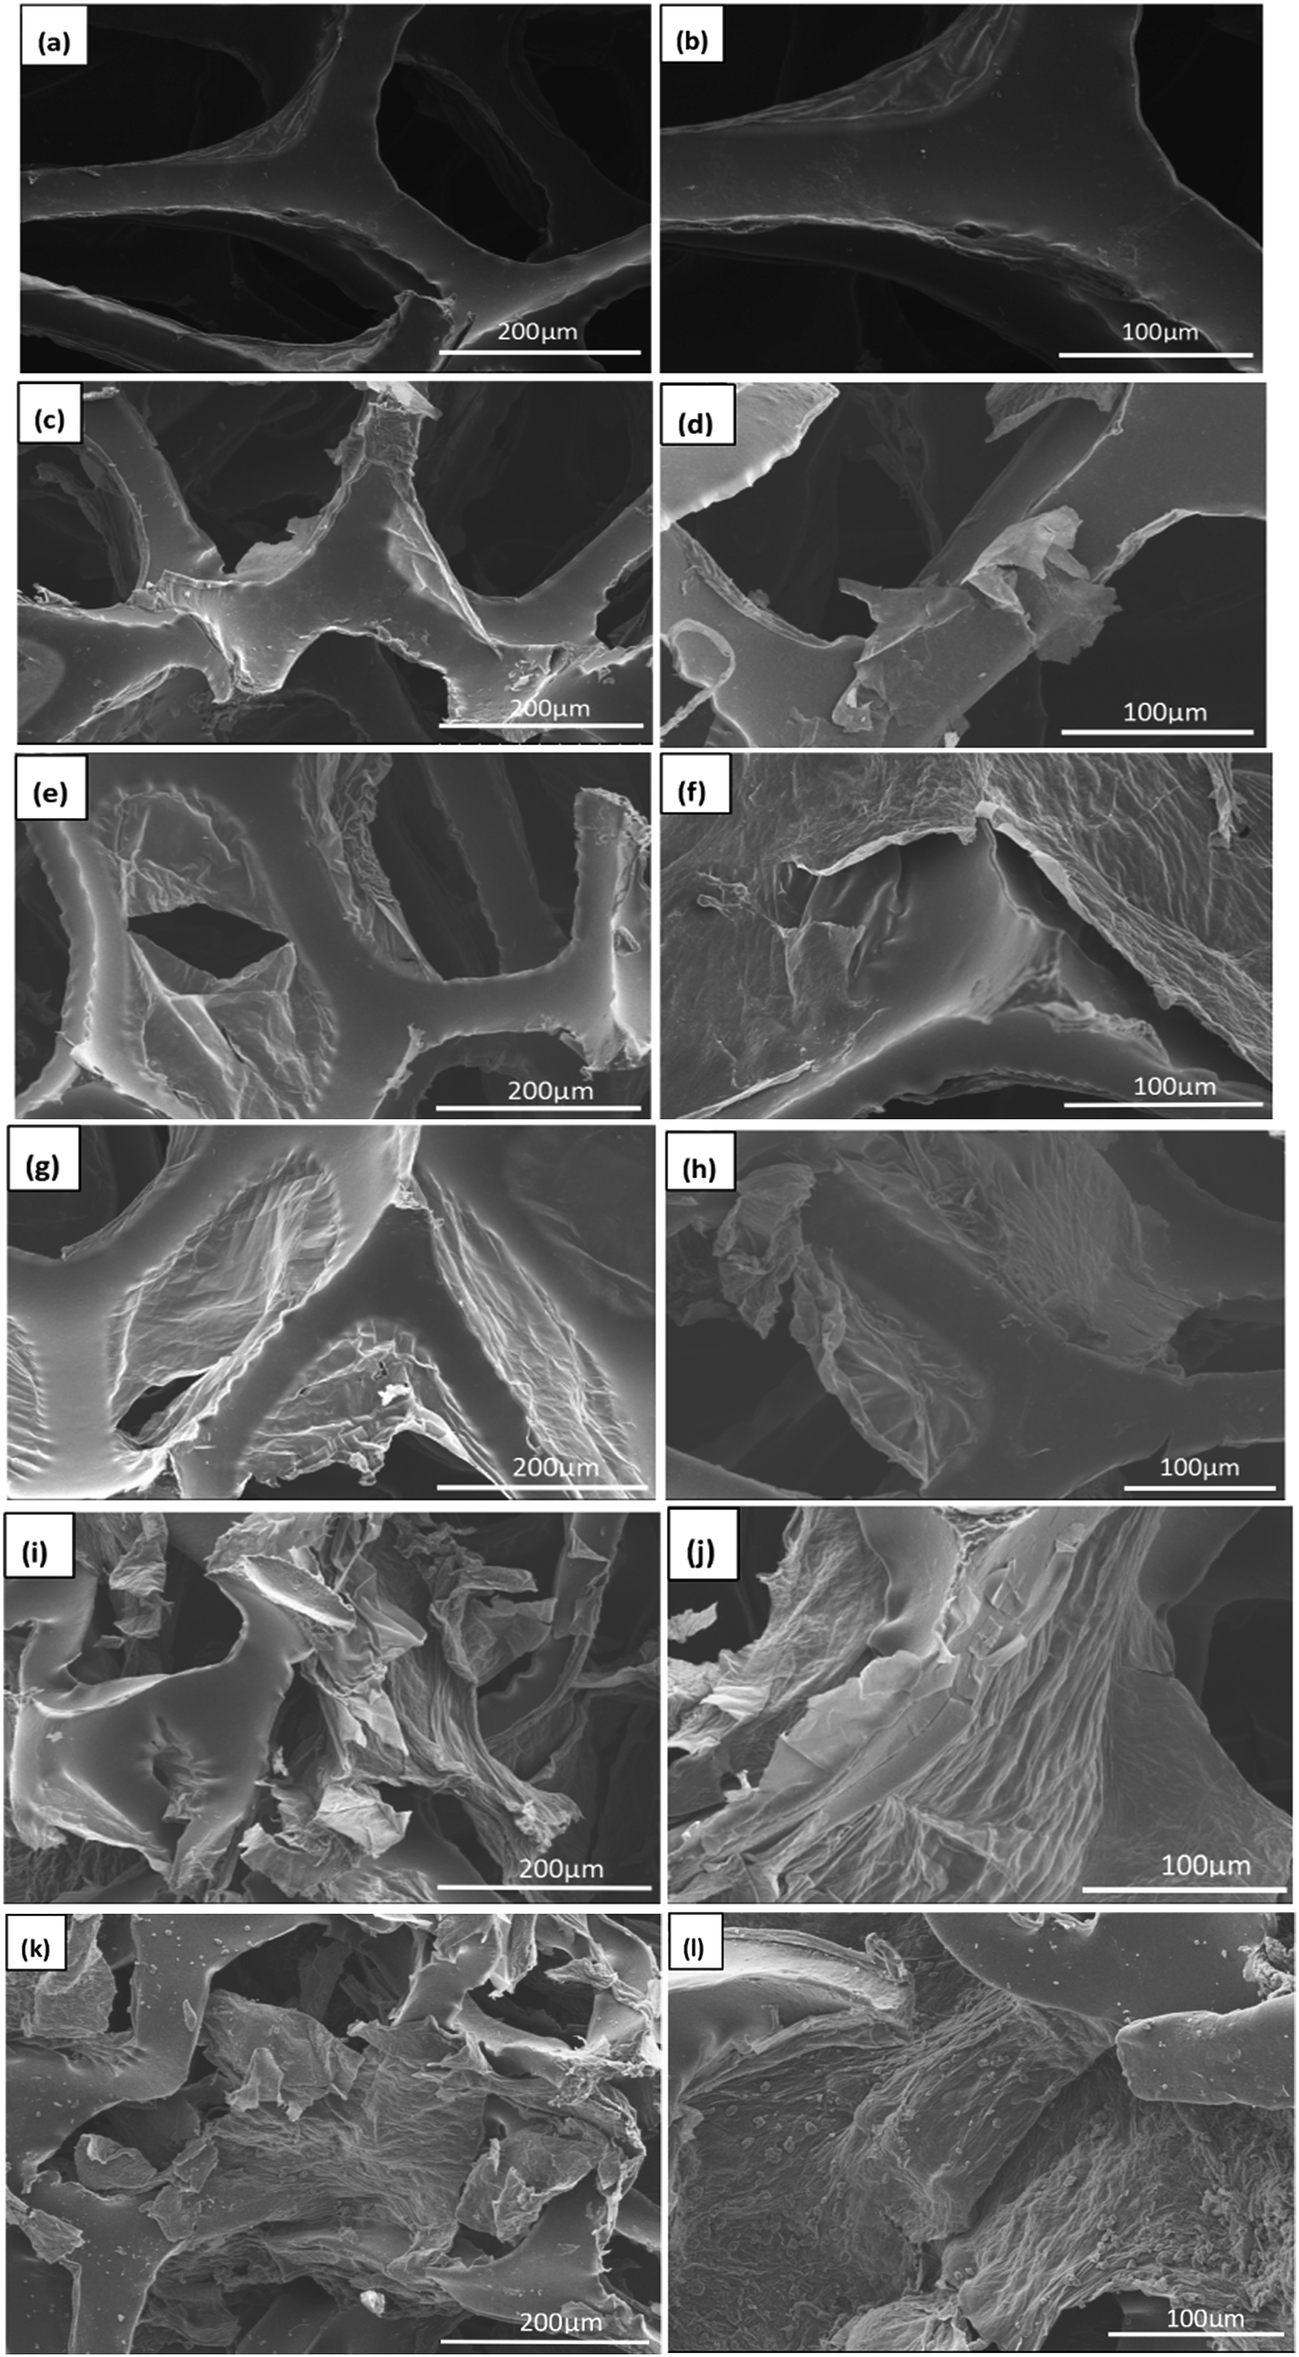 | ||
| Fig. 3 SEM images of (a and b) polyurethane foam; PU/RGO foams of (c and d) S-3, (e and f) S-6, (g and h) S-9, (i and j) S-12, and (k and l) S-15. | ||
According to the transmission line theory, when an electromagnetic wave transmits through a medium, its reflection is affected by many factors, such as permittivity, permeability, sample thickness, the specific surface area and the frequency of the electromagnetic wave.36,37 To measure the electromagnetic wave absorption properties of the PU/RGO composite, PU/RGO foams with different loadings of RGO were prepared. Since the composite foams don't contain any magnetic substance, the main microwave absorbing mechanism of PU/RGO foam is dielectric loss. Fig. 4 showed the frequency dependence of the real part (ε′), imaginary part (ε′′) and loss tangent of the complex permittivity for PU/RGO foams with different RGO amounts in the frequency range of 2–18 GHz.
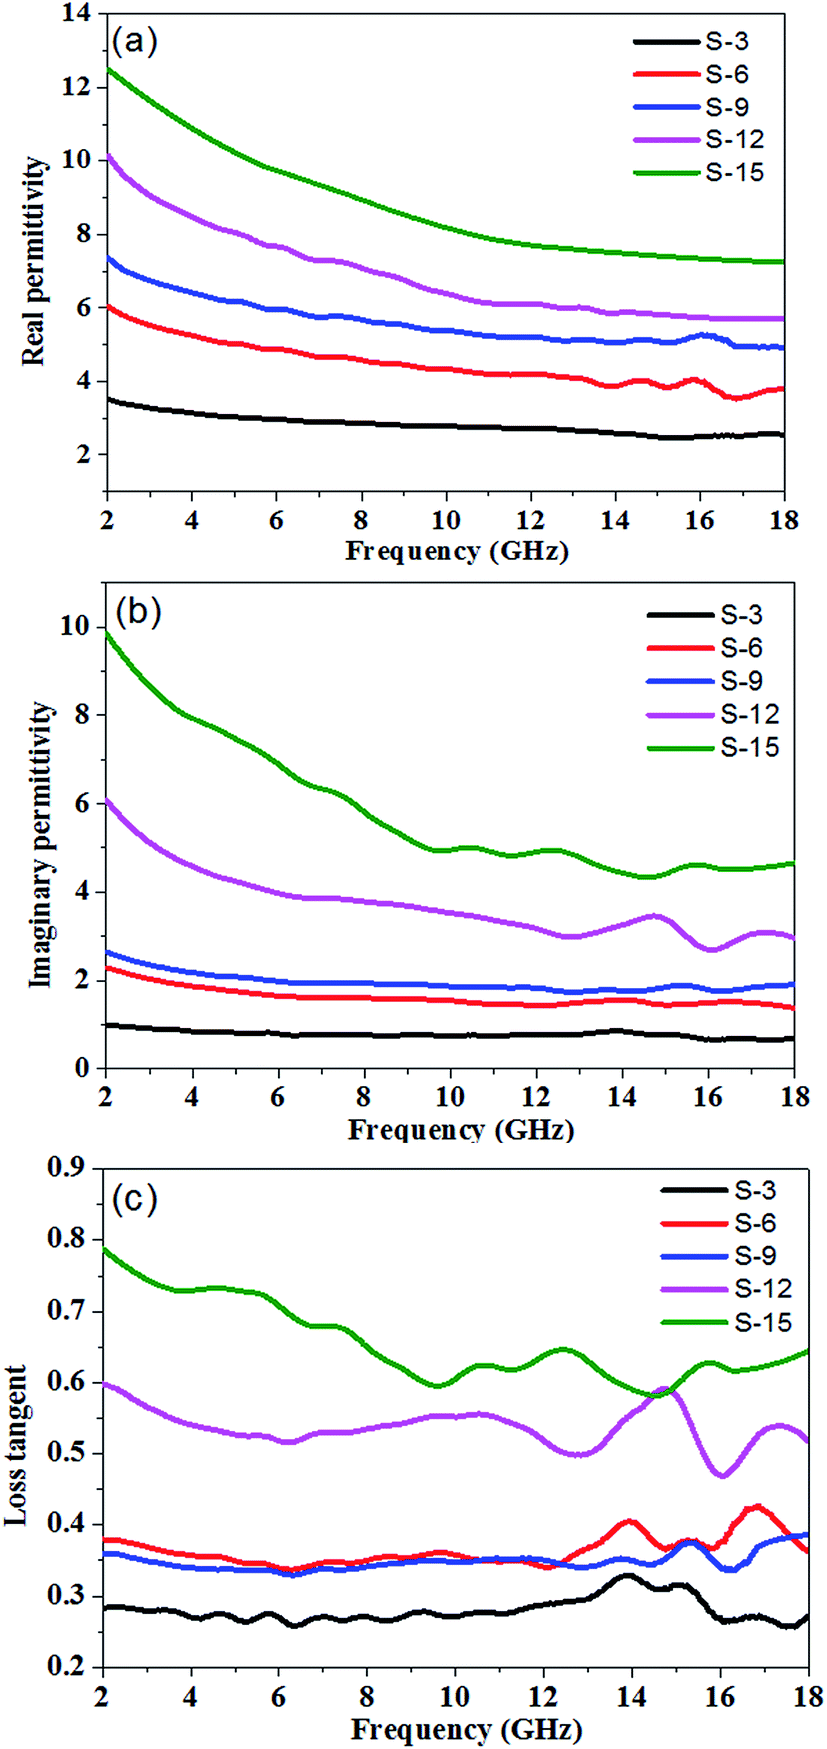 | ||
| Fig. 4 (a) Real part (ε′r), (b) imaginary part (ε′′r), (c) loss tangent of permittivity for PU/RGO foams with different loading levels of RGO in the range 2–18 GHz. | ||
The real part of the complex permittivity (ε′) represents the storage ability of the EM energy. As shown in Fig. 4(a), for sample S-3, S-6, S-9, S-12, and S-15, the values of ε′ decrease with increasing frequency from 3.51 to 2.54, 6.05 to 3.78, 7.37 to 4.93, 10.16 to 5.72, and 12.50 to 7.24, respectively in the range 2.0–18.0 GHz, which may be related to a resonance behavior.22 The ε′ values of the PU/RGO foams obviously increase with the increasing amounts of RGO sheets. This can be explained by the fact that the larger number of RGO sheets may increase the electric polarization and electric conductivity of PU/RGO composites, since ε′ is an expression of the polarizability of a material, which consists of dipolar polarization and electric polarization at microwave frequency.38,39 Furthermore, the ε′ values of all these samples is not so high, which is beneficial to the impedance match and could result in weak reflection and strong absorption.22 The imaginary part (ε′′) of the complex permittivity is related to the energy dissipation, and high values of ε′′ indicate strong dielectric loss to the EM wave.40,41 As shown in Fig. 4(b), for sample S-3, S-6, S-9, S-12, and S-15, the imaginary part of the complex permittivity (ε′′) decrease with increasing frequency with small fluctuations from 0.99 to 0.69, 2.30 to 1.37, 2.65 to 1.90, 6.08 to 2.96, and 9.85 to 4.34, respectively in the range of 2.0–18.0 GHz. Moreover, the ε′′ values also increase with the increasing loadings of RGO in the PU/RGO foams. The loss tangent (tan![[thin space (1/6-em)]](https://www.rsc.org/images/entities/char_2009.gif) δ = ε′′/ε′) indicates the inherent dissipation of EM energy for dielectric material, and higher values of tanδ exhibit that more EM energy will be consumed.42 As shown in Fig. 4(c), the values of tanδ fluctuate in the range of 0.33–0.26, 0.43–0.34, 0.39–0.33, 0.60–0.47, and 0.79–0.58 for sample S-3, S-6, S-9, S-12, and S-15, respectively; it can clearly be seen that the values of tanδ exhibit very complex nonlinear behavior in the measured frequency range of 2–18 GHz.
δ = ε′′/ε′) indicates the inherent dissipation of EM energy for dielectric material, and higher values of tanδ exhibit that more EM energy will be consumed.42 As shown in Fig. 4(c), the values of tanδ fluctuate in the range of 0.33–0.26, 0.43–0.34, 0.39–0.33, 0.60–0.47, and 0.79–0.58 for sample S-3, S-6, S-9, S-12, and S-15, respectively; it can clearly be seen that the values of tanδ exhibit very complex nonlinear behavior in the measured frequency range of 2–18 GHz.
The reflection loss (RL) of the electromagnetic wave of the PU/RGO foams under the normal incidence of an electromagnetic field can be calculated from the measured complex relative permittivity and permeability data for a given frequency and absorber thickness using the following equations:
 | (1) |
 | (2) |
RL at a given sample thickness is expected to be as low as possible. The calculated theoretical RL of the PU/RGO foams with different thicknesses (2–5 mm) in the range of 2–18 GHz were shown in Fig. 5. At a thickness of 2.5 mm, the minimum RL values of sample S-3, S-6, S-9, S-12, and S-15 are −10.9, −14.3, −14.6, −50.8, and −15.6 dB at 17.15, 17.1, 15.1, and 12.9, and 11.0 GHz, respectively, and the bandwidth of RL below −10 dB are 1.70, 3.25, 5.05, 5.20, and 3.90 GHz in the range of 16.3–18.0, 14.75–18.0, 12.95–18.0, 10.75–15.95, and 9.2–13.1 GHz, respectively. For sample S-9, S-12 and S-15, the minimum RL values could reach up to −18.8, −46.2 and −20.4 dB at 16.9, 16.55 and 15.45 GHz, respectively at a thickness of 2 mm. For sample S-15, the microwave absorption properties decrease when compared with S-12, which maybe due to that higher RGO contents lead to impedance mismatch, and thus less incident electromagnetic waves are dissipated.
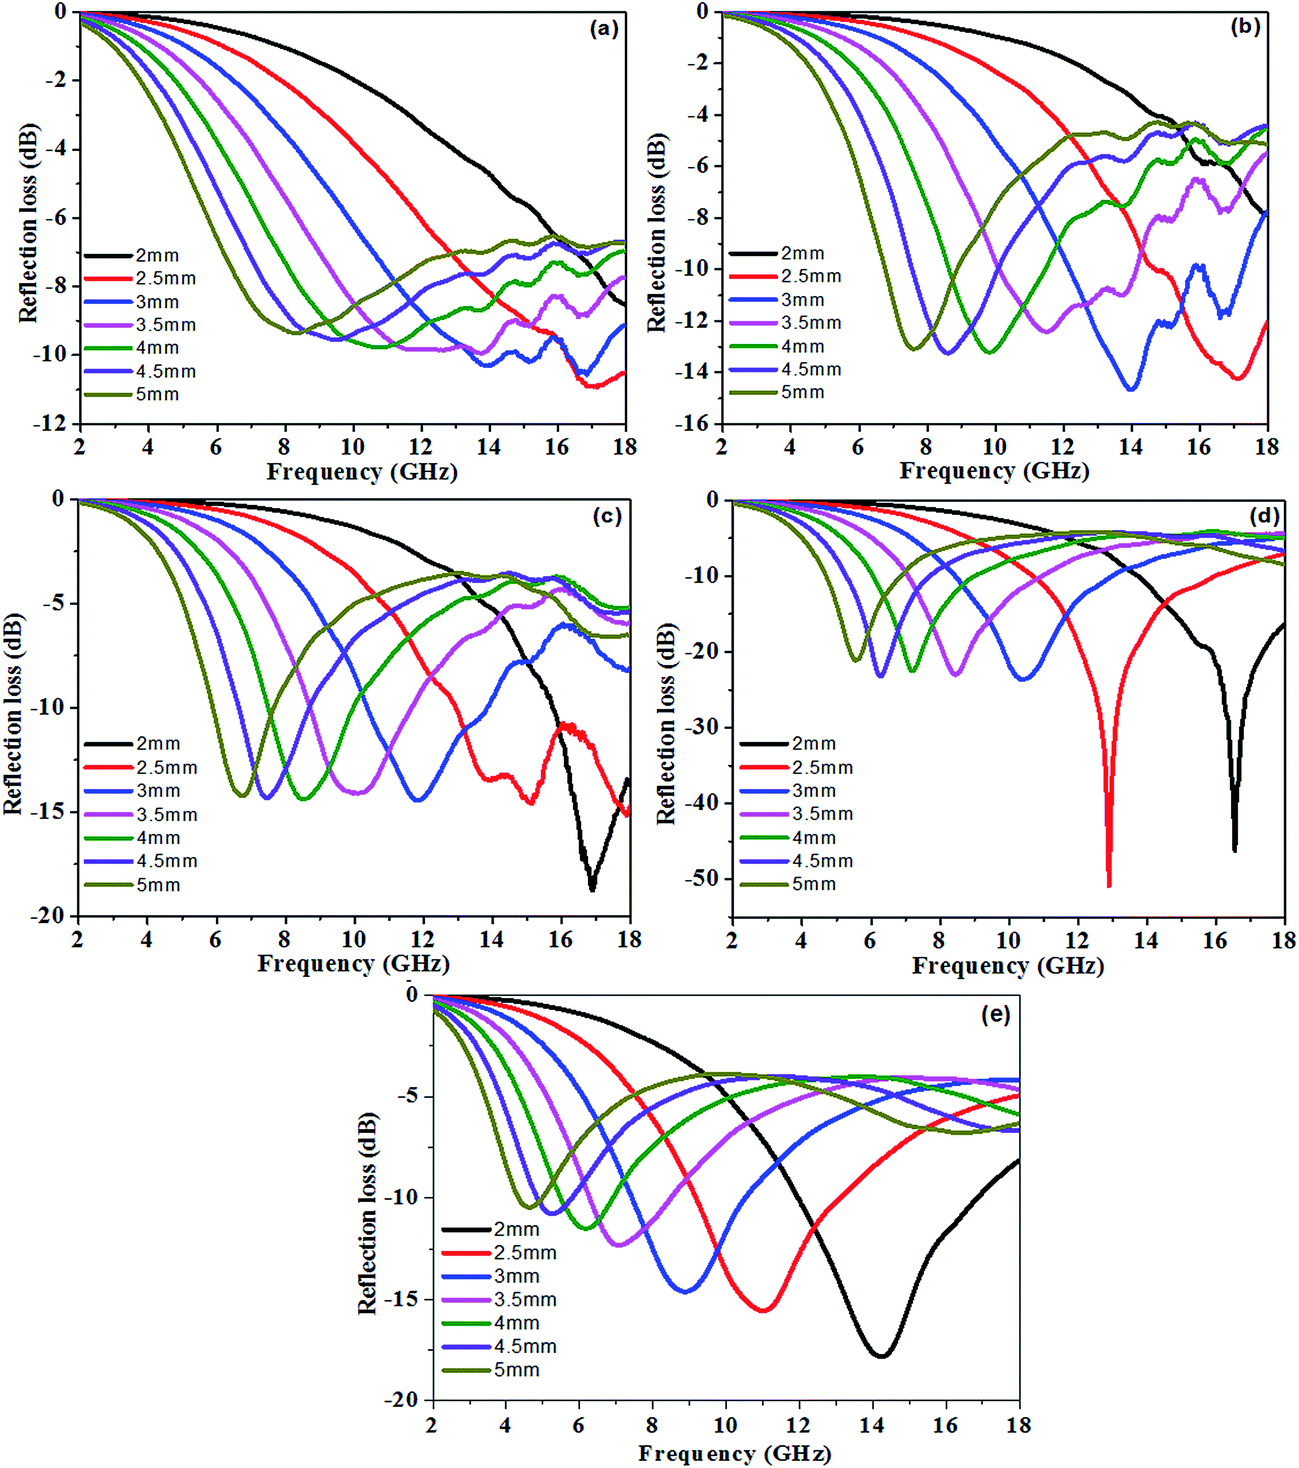 | ||
| Fig. 5 The reflection loss curves of sample (a) S-3, (b) S-6, (c) S-9, (d) S-12, and (e) S-15 at different thicknesses from 2 to 5 mm in the frequency range of 2–18 GHz. | ||
We can clearly see that the absorption peak value is enhanced and shifts to lower frequency on increasing the loadings of the RGO sheets in the PU/RGO foams. In addition, for all samples, it can be observed that the thickness of the absorbers has a great influence on the microwave absorbing properties, and the minimum RL, corresponding to the maximum absorption, gradually appears at different frequencies and shifts towards lower frequency with increasing thickness, so the microwave absorption properties can be tuned easily by varying the loading mass percentage and the layer thickness of the samples.39
The incident electromagnetic wave is dissipated into heat by the three-dimentional porous PU/RGO foam as shown schematically in Fig. S3.† The EM wave absorbing capabilities of the PU/RGO foams are mainly attributed to dielectric relaxation, polarization relaxation arising from defects and groups on the RGO sheets and interfacial polarization relaxation. As we know, relaxation processes are usually caused by a delay in molecular polarization with respect to a changing electric field in a dielectric medium.39 When EM waves are propagated within the PU/RGO foams, the dielectric relaxation process that caused by the lag of induced charges occurs and transfers the electromagnetic energy into heat energy, so the microwave is attenuated.42 The defects and functional groups introduced into RGO sheets cause the polarization relaxation. First, defects acting as polarization centers would generate polarization relaxation under the alternating electromagnetic field, resulting in a profound effect on the loss of the EM wave. Second, there are residual oxygen-containing chemical bonds such as CO, C–O in RGO, and the different ability to catch electrons between carbon atom and oxygen atom results in electric dipole polarization, so the microwave is attenuated.22,42 In the composite, the existence of interfaces between the polyurethane polymer and the RGO sheets gives rise to interfacial polarization, resulting in further losses of incident electromagnetic wave.35,39,43 Moreover, the 2D structure and high aspect ratio of RGO sheets in PU/RGO foams are beneficial for multiple reflections. The microwaves suffer multiple reflections, thereby increasing their propagation path in the absorber, which leads to more attenuation of electromagnetic energy.37,42 Furthermore, the electromagnetic interference (EMI) shielding effectiveness of PU/RGO foams are also measured and the Results and discussion are shown in the ESI (Fig. S4).†
Compression tests were performed to evaluate the mechanical performance of the PU/RGO foams. Compression tests revealed that the prepared composite foams exhibited excellent elasticity and flexibility. Fig. 6 show the cycles of loading and unloading of the 1st, 10th, and 100th compressive cycles at a maximum strain of 50% for sample S-3, S-6, S-9, and S-12, respectively, and the cyclic compression test results of sample S-15 are shown in Fig. S5(f).† It can be found that the stress–strain relationship is initially linear with approximately a Young's modulus of 1.35, 2.75, 3.20, 4.00, and 4.12 kPa for sample S-3, S-6, S-9, S-12, and S-15, respectively. When the foam is unloaded from 50% strain, the strain retraces its path with a considerable hysteresis, which is a sign of viscoelastic behavior of polyurethane foam.44,45 The maximum stress at a 50% strain for sample S-3, S-6, S-9, S-12, and S-15 were 4.58, 12.1, 20.2, 47.6, and 62.8 kPa, respectively. For all samples, it can be found that the maximum stress at 50% strain remains almost the same after 100 compressive cycles, which indicates that deformation is viscoelastic and there would be no permanent strain under enough time. Furthermore, few RGO sheets were observed flaking off from the foam during this compression process, which indicates that the RGO sheets adhere well to the skeleton of PU foams.
 | ||
| Fig. 6 The cyclic stress–strain curves of PU/RGO foams with different RGO loading levels at 50% strain: (a) sample S-3, (b) S-6, (c) S-9, and (d) S-12. (e) Compressing and releasing process of sample S-9 showing that PU/RGO foams recover their original shape after compression by more than 90% strain. | ||
In addition, the compression tests with a maximum strain of 90% were performed on the prepared PU/RGO foams as shown in Fig. S5,† and the results indicate that all samples restore to its original shape under certain time after unloading the stress. Moreover, as shown in Fig. S6,† the PU/RGO foam itself could be twisted or deformed into any shape easily and restored to its original shape rapidly. The measured density of sample S-3, S-6, S-9, S-12, and S-15 were about 0.020, 0.023, 0.025, 0.027 and 0.029 g cm−3, respectively. On account of the above merits, the prepared PU/RGO foams can be used as commercials cladding microwave absorption materials on account of its facile fabrication, low cost, lightweight, and good microwave absorbing properties.
4. Conclusions
In summary, lightweight and highly elastic PU/RGO foams with obviously enhanced microwave absorption properties were prepared by a simple dip-coating method. At a thickness of 2.5 mm, for sample S-9 with a RGO loading of about 23.5 wt%, the PU/RGO foam showed a minimum reflection loss reaching −14.6 dB at 15.1 GHz, with a bandwidth of RL value below −10 dB up to 5.05 GHz, and in the case of sample S-12 with a RGO loading of 31.3%, the PU/RGO foam showed a maximum reflection loss reaching −50.8 dB at 12.9 GHz, with a bandwidth of RL value below −10 dB up to 5.20 GHz. The EM wave absorbing capabilities of the PU/RGO foams are mainly attributed to dielectric relaxation, polarization relaxation and interfacial polarization relaxation. The cyclic compression and twist tests exhibit that the PU/RGO foams can restore its original shape after a large deformation, so it can be fabricated into the specific shape easily according to the usage requirements due to the high resilience. On account of the simple and economical preparation process, the manufactured PU/RGO foams can be used as good commercial cladding wave-absorbing materials emphasizing lightweight and highly resilient properties.Conflicts of interest
There are no conflicts to declare.Acknowledgements
This work is supported by the Natural Science Foundation of China (No. 51373096), Basic Research Field of Shanghai Science and Technology Innovation Program (No. 16JC1401500) and Shanghai Sailing Program (No. 16YF1406100). Instrumental Analysis Center of Shanghai Jiao Tong University and National Engineering Research Center for Nanotechnology are gratefully acknowledged for assisting with relevant analyses.Notes and references
- R. Dosoudil, M. Usakova, J. Franek, J. Slama and V. Olah, J. Magn. Magn. Mater., 2006, 304, 755–757 CrossRef.
- G. B. Sun, B. X. Dong, M. H. Cao, B. Q. Wei and C. W. Hu, Chem. Mater., 2011, 23, 1587–1593 CrossRef CAS.
- H. B. Zhang, Q. Yan, W. G. Zheng, Z. X. He and Z. Z. Yu, ACS Appl. Mater. Interfaces, 2011, 3(3), 918–924 CAS.
- J. R. Liu, M. Itoh, T. Horikawa, E. Taguchi, H. Mori and K. Machida, Appl. Phys. A: Mater. Sci. Process., 2006, 82, 509–513 CrossRef CAS.
- X. Zheng, J. Feng, Y. Zong, H. Miao, X. Hu, J. Bai and X. Li, J. Mater. Chem. C, 2015, 3, 4452–4463 RSC.
- C. Hu, J. Xue, L. Dong, Y. Jiang, X. Wang, L. Qu and L. Dai, ACS Nano, 2016, 10(1), 1325–1332 CrossRef CAS PubMed.
- A. Kaniyoor, T. T. Baby and S. Ramaprabhu, J. Mater. Chem., 2010, 20, 8467–8469 RSC.
- P. Blake, E. W. Hill, A. H. Castro Neto, K. S. Novoselov, D. Jiang, R. Yang, T. J. Booth and A. K. Geim, Appl. Phys. Lett., 2007, 91, 063124 CrossRef.
- D. Pullini, V. Siong, D. Tamvakos, B. Lobato Ortega, M. F. Sgroi, A. Veca, C. Glanz, I. Kolaric and A. Pruna, Compos. Sci. Technol., 2015, 112, 16–21 CrossRef CAS.
- Y. Zhu, S. Murali, M. D. Stoller, K. J. Ganesh, W. Cai, P. J. Ferreira, A. Pirkle, R. M. Wallace, K. A. Cychosz, M. Thommes, D. Su, E. A. Stach and R. S. Ruoff, Science, 2011, 332, 1537–1541 CrossRef CAS PubMed.
- Y. Shao, M. F. El-Kady, L. J. Wang, Q. Zhang, Y. Li, H. Wang, M. F. Mousavi and R. B. Kaner, Chem. Soc. Rev., 2015, 44, 3639–3665 RSC.
- Y. He, Y. Liu, T. Wu, J. Ma, X. Wang, Q. Gong, W. Kong, Y. Liu and J. Gao, J. Hazard. Mater., 2013, 260, 796–805 CrossRef CAS PubMed.
- K. Sohn, Y. J. Na, H. Chang, K.-M. Roh, H. D. Jang and J. Huang, Chem. Commun., 2012, 48, 5968–5970 RSC.
- X. Dong, J. Chen, Y. Ma, J. Wang, M. B. Chan-Park, X. Liu, L. Wang, W. Huang and P. Chen, Chem. Commun., 2012, 48, 10660–10662 RSC.
- H. J. Yoon, D. H. Jun, J. H. Yang, Z. Zhou, S. S. Yang and M. M.-C. Cheng, Sens. Actuators, B, 2011, 157, 310–313 CrossRef CAS.
- F. Schedin, A. K. Geim, S. V. Morozov, E. W. Hill, P. Blake, M. I. Katsnelson and K. S. Novoselov, Nat. Mater., 2007, 6, 652–655 CrossRef CAS PubMed.
- G. Lu, L. E. Ocola and J. Chen, Nanotechnology, 2009, 20, 445502 CrossRef PubMed.
- I. Zaman, T. T. Phan, H.-C. Kuan, Q. Meng, L. T. B. La, L. Luong, O. Youssf and J. Ma, Polymer, 2011, 52, 1603–1611 CrossRef CAS.
- C. Vallés, A. M. Abdelkader, R. J. Young and I. A. Kinloch, Compos. Sci. Technol., 2015, 111, 17–22 CrossRef.
- X. Ji, L. Cui, Y. Xu and J. Liu, Compos. Sci. Technol., 2015, 106, 25–31 CrossRef CAS.
- R. Verdejo, M. M. Bernal, L. J. Romasanta and M. A. Lopez-Manchado, J. Mater. Chem., 2011, 21, 3301–3310 RSC.
- C. Wang, X. Han, P. Xu, X. Zhang, Y. Du, S. Hu, J. Wang and X. Wang, Appl. Phys. Lett., 2011, 98, 072906 CrossRef.
- X.-J. Zhang, G.-S. Wang, Y.-Z. Wei, L. Guo and M.-S. Cao, J. Mater. Chem. A, 2013, 1, 12115–12122 CAS.
- Y.-F. Pan, G.-S. Wang and Y.-H. Yue, RSC Adv., 2015, 5, 71718–71723 RSC.
- G.-S. Wang, Y. Wu, Y.-Z. Wei, X.-J. Zhang, Y. Li, L.-D. Li, B. Wen, P.-G. Yin, L. Guo and M.-S. Cao, ChemPlusChem, 2014, 79, 375–381 CrossRef CAS.
- A.-P. Guo, X.-J. Zhang, S.-W. Wang, J.-Q. Zhu, L. Yang and G.-S. Wang, ChemPlusChem, 2016, 81, 1305–1311 CrossRef CAS.
- A.-P. Guo, X.-J. Zhang, J.-K. Qu, S.-W. Wang, J.-Q. Zhu, G.-S. Wang and L. Guo, Mater. Chem. Front., 2017 10.1039/C7QM00204A.
- J. Luo, Y. Xu, W. Yao, C. Jiang and J. Xu, Compos. Sci. Technol., 2015, 117, 315–321 CrossRef CAS.
- E. Kowsari and M. Mohammadi, Compos. Sci. Technol., 2016, 126, 106–114 CrossRef CAS.
- S. Gilje, S. Han, M. Wang, K. L. Wang and R. B. Kaner, Nano Lett., 2007, 7(11), 3394–3398 CrossRef CAS PubMed.
- I. K. Moon, J. Lee, R. S. Ruoff and H. Lee, Nat. Commun., 2010, 1, 73 Search PubMed.
- O. C. Compton, D. A. Dikin, K. W. Putz, L. C. Brinson and S. T. Nguyen, Adv. Mater., 2010, 22, 892–896 CrossRef CAS PubMed.
- X. Zhang, Z. Sui, B. Xu, S. Yue, Y. Luo, W. Zhan and B. Liu, J. Mater. Chem., 2011, 21, 6494–6497 RSC.
- A. Gupta, G. Chen, P. Joshi, S. Tadigadapa and P. C. Eklund, Nano Lett., 2006, 6, 2667–2673 CrossRef CAS PubMed.
- X.-J. Zhang, G.-S. Wang, W.-Q. Cao, Y.-Z. Wei, M.-S. Cao and L. Guo, RSC Adv., 2014, 4, 19594–19601 RSC.
- S. K. Pillalamarri, F. D. Blum, A. T. Tokuhiro and M. F. Bertino, Chem. Mater., 2005, 17(24), 5941–5944 CrossRef CAS.
- V. K. Singh, A. Shukla, M. K. Patra, L. Saini, R. K. Jani, S. R. Vadera and N. Kumar, Carbon, 2012, 50, 2202–2208 CrossRef CAS.
- H.-L. Xu, H. Bi and R.-B. Yang, J. Appl. Phys., 2012, 111, 07A522 CrossRef.
- D. Chen, G.-S. Wang, S. He, J. Liu, L. Guo and M.-S. Cao, J. Mater. Chem. A, 2013, 1, 5996–6003 CAS.
- X.-J. Zhang, G.-S. Wang, W.-Q. Cao, Y.-Z. Wei, J.-F. Liang, L. Guo and M.-S. Cao, ACS Appl. Mater. Interfaces, 2014, 6, 7471–7478 CAS.
- D. Micheli, C. Apollo, R. Pastore and M. Marchetti, Compos. Sci. Technol., 2010, 70, 400–409 CrossRef CAS.
- W. Liu, H. Li, Q. Zeng, H. Duan, Y. Guo, X. Liu, C. Sun and H. Liu, J. Mater. Chem. A, 2015, 3, 3739–3747 CAS.
- X. F. Zhang, P. F. Guan and X. L. Dong, Appl. Phys. Lett., 2010, 96, 223111 CrossRef.
- H. X. Zhu, N. J. Mills and J. F. Knott, J. Mech. Phys. Solids, 1997, 11(12), 1875–1904 CrossRef.
- C. Hou, K. Czubernat, S. Y. Jin, W. Altenhof, E. Maeva, I. Seviaryna, S. Bandyopadhyay-Ghosh, M. Sain and R. Gu, Int. J. Fatigue, 2014, 59, 76–89 CrossRef CAS.
Footnotes |
| † Electronic supplementary information (ESI) available. See DOI: 10.1039/c7ra07794g |
| ‡ These authors contributed equally to this work. |
| This journal is © The Royal Society of Chemistry 2017 |