 Open Access Article
Creative Commons Attribution 3.0 Unported Licence
Effect of Ti compositions for efficiency enhancement of CaTiO3:Er3+,Ni2+ broadband-sensitive upconverters†
Hom Nath Luitel *,
Shintaro Mizuno,
Takamasa Nonaka,
Toshihiko Tani and
Yasuhiko Takeda*
Toyota Central Research and Development Laboratories, Inc., 41-1, Yokomichi, Nagakute, Aichi 480-1192, Japan. E-mail: e1698@mosk.tytlabs.co.jp; takeda@mosk.tytlabs.co.jp; Fax: +81 952 288548; Tel: +81 956 717134
First published on 24th August 2017
Abstract
Improving the efficiency of upconversion (UC) materials is a hot topic in recent days due to the important applications of UC materials in photovoltaics, photonics devices, photocatalysts, sensors, biological imaging, and therapeutics. Recently, we have reported a broadband-sensitive UC emission in Ni2+, Er3+-codoped perovskites. However, the applications of these perovskites are limited due to their low conversion efficiency. Herein, we realized highly improved UC efficiency in the CaTiO3:Er3+,Ni2+ upconverter as compared to those of the previously reported CaZrO3 and La(Ga,Sc)O3 upconverters. Ti composition plays important roles in stabilizing divalent nickel (Ni2+) in an octahedral coordination, which is the key point for sensitization to Er3+ emitters. Furthermore, oxygen vacancies and consequently tetrahedral Ni2+ ions, which kill the luminescence, are suppressed, and as a result, the UC emission intensity is dramatically increased. The 0.1 mole Ti-deficient sample with the (Ca0.8Er0.10Li0.10)(Ti0.894Ni0.002Nb0.004)O2.8 composition exhibited the most intense broadband-sensitive UC emission, which was 264-fold stronger than that of the stoichiometric sample and more than 12 folds as compared to that of the previously reported CaZrO3:Er,Ni and La(Ga,Sc)O3 upconverters. The highest UC quantum yield of ∼2.53% was realized in the optimized CaTiO3:Er3+,Ni2+ upconverter under 1490 nm laser excitation of ∼1000 W m−2.
1. Introduction
Utilization of solar radiation is one of the hot topics of the present research for sustainable technology. The mainstream of the research is focussed on engineering materials that can convert sunlight into electricity via the photovoltaic effect although there is significant interest in photochemical hydrogen production and photocatalytic decomposition of contaminations using solar radiation.1,2 Efficiency improvement of photovoltaics is of utmost importance to fulfil the energy demand of the present society. Semiconductors used in solar cell devices cannot absorb photons of energies below the bandgap of these semiconductors; this makes a large fraction of the solar radiation unused. Even with the optimized silicon semiconductor, 30% of the incident photons are not absorbed, but simply transmitted through a present silicon solar cell; this limits the maximum conversion efficiency of single-junction silicon solar cells to nearly 33%. The limiting conversion efficiency of a single-junction silicon solar cell, which is the mainstream of the present photovoltaics, can be surpassed if the NIR solar radiation above the absorption edge is properly utilized.3 Upconverters that absorb two or more low-energy photons with subsequent emission of a single higher-energy photon are good candidates for improving the conversion efficiency of the present solar cells.3,4 An upconversion (UC) layer can be placed at the back of a bifacial solar cell, and by converting a part of the transmitted NIR photons to the wavelengths that can be efficiently absorbed by the solar cell, a remarkable enhancement of the solar cell efficiency is possible.Due to the ladder-like discrete energy levels arising in 4fn electrons of rare-earth ions, these ion-doped upconverters exhibit a superior UC performance.5 Thus, rare-earth ion-doped UC materials with a strong luminescence in the NIR to visible ranges have been extensively investigated in recent years due to their various potential applications.4,6–11 However, the discreteness inevitably leads to sharp absorption peaks, leading to narrow sensitivity ranges; hence, only a small fraction of solar radiation can be utilized for the present solar cells.12,13 For example, Er3+-doped upconverters absorb photons of 1450–1600 nm wavelength and upconvert to the emission wavelength of 980 nm, which is perfectly suitable for c-Si solar cells.13 However, a broad excitation range above the absorption edge of silicon is highly desirable such that a sufficiently large amount of solar radiation can be utilized.
Recently, we have successfully demonstrated a broadband-sensitive UC using Ni2+ sensitizers and Er3+ emitters in the ABO3 type perovskites, such as CaZrO3 and La(Ga,Sc)O3, that can absorb photons at 1100–1600 nm wavelengths range and efficiently upconvert to the c-Si solar cell absorption range.14–16 Moreover, six-coordinated Ni2+ ions located at the centre of the BO6 octahedra of the ABO3 type perovskites harvest photons of 1100–1400 nm wavelength range and transfer the energies to the nearby Er3+ ions. Consequently, Er3+ ions upconvert to 980 nm that is within the c-Si absorption range. In addition, Er3+ ions themselves absorb 1450–1600 nm photons and upconvert at 980 nm. Thus, the combination of Er3+ and Ni2+ in these perovskites covers a wide sensitivity range (1100–1600 nm) as compared to the conventional Er3+-only doped upconverters. If 1100–1600 nm photons are perfectly upconverted to 980 nm, about 6.3 mA cm−2 current density gain for a c-Si solar cell is possible that accounts for ∼3.2% efficiency improvement considering the ∼26% conversion efficiency of the optimised c-Si solar cells.17
However, the efficiency of the abovementioned broadband-sensitive upconverters is quite low at present. To improve the solar cell performance, a highly efficient upconverter is essential to realize UC under non-coherent sunlight. Recently, we have reported the guidelines for the efficient broadband-sensitive UC in the Ni2+, Er3+-codoped perovskites.18,19 In brief, the efficiency of these upconverters depends on the absorption extent of the active ions (Ni2+ and Er3+), ET extent from the Ni2+ sensitizers to the Er3+ emitters, and UC efficiency of Er3+ itself. We have realized the efficient Ni2+ → Er3+ ET in the CaZrO3 and La(Ga,Sc)O3 perovskites by optimizing the active ion concentrations and tuning the Ni–O bond length; this remarkably intensified the UC emission.15,18 The absorption extent of the active ions used to harvest the excitation energy is highly dependent on the host matrix. When the host crystal structure is more distorted, the forbidden f–f transitions of the 4fn configuration are partially allowed; this makes the absorption and emission more intense.5 Herein, we selected a CaTiO3 host that is a member of the ABO3 type perovskites with a distorted orthorhombic crystal structure. The CaTiO3 crystal structure is more distorted as compared to those of CaZrO3 and LaGaO3 due to a larger A/B ionic radius ratio resulting in tilted TiO6 octahedra to fit in the dodecahedral CaO8 cavities.20,21 Thus, more pronounced f–f transitions of the 4fn configuration of Er3+ ions are expected.
Herein, we report many folds enhanced UC emission intensity in the CaTiO3:Ni2+,Er3+ as compared to that of the previously reported upconverters, and it can be explained on the basis of (1) increased absorption of active ions in the more distorted CaTiO3 host as compared to that in the previously reported CaZrO3 and LaGaO3 hosts, (2) a narrow Ni2+ emission band with larger Stokes shift in CaTiO3, which facilitates forward ET from Ni2+ to Er3+ and suppresses the energy back transfer (EBT), i.e. unidirectional ET, and (3) increased emission efficiency of Er3+ itself in the more distorted CaTiO3 host. Importantly, when Ti-deficiency was introduced, the emission efficiencies of Ni2+ and Er3+ dramatically increased. Ni valence, Ni-associated defects, and Er3+ emission efficiency played significant roles in the improvement of the UC emission intensity. The detailed mechanism of the UC emission intensification with the Ti-compositions has been discussed.
2. Experiments
2.1 Synthesis of samples
We synthesized the powder samples of CaTiO3 codoped with Er and Ni, and the control samples doped with Ni or Er only. Because Er3+ ions substitute the Ca2+ sites and Ni2+ ions substitute the Ti4+ sites, the monovalent Li+ ions with equivalent amount to Er3+ ions and Nb5+ ions in a double amount to Ni2+ ions were incorporated, unless otherwise stated. All the doped ions were subtracted from the host ions to be substituted. We varied Ti contents in a range 0.8 ≤ Ti ≤ 1.15 to prepare various Ti-compositions, while keeping all other parameters constant. The samples are termed as Ti-deficient when the ratio of the B-site ions (Ti + Ni + Nb) to the A-site ions (Ca + Er + Li) is lower than unity, whereas if the ratio is higher than unity, the samples are termed as Ti-excess compositions. The powder samples were synthesized using metal–oxide or carbonate precursor powders using a solid state reaction method. Appropriate amounts of oxide/carbonate (Kojundo Kagaku, Japan) precursor powders were mixed well using a small amount of ethanol and dried at room temperature to evaporate the solvent. Then, the dry powders were heat-treated at 1300 °C for 6 h in air for reaction and crystallization. Thus, the powders of the target materials were synthesized. As the synthesized powders might contain a mixture of Ni2+ and Ni3+, post-annealing of the powder samples was carried out at 800 °C in a N2 gas flow to convert Ni3+ ions to Ni2+ ions. We did not observe Ni3+-related absorption bands in all the samples after N2-reduction process; this confirmed that most of the doped Ni stabilized as Ni2+ ions.2.2 Material characterization and optical measurements
The crystalline structure was identified by XRD using Cu-Kα line and a θ–2θ method. The JADE software was used for structural identifications and refinements. XANES spectra were obtained to identify the valence of the host ions and their structural geometries in the Toyota beamline BL33XU at SPring-8 light sources.22,23The samples with a sandwich structure of silica glass/powder (0.5 mm in thickness)/silica glass were prepared for optical measurements. The absorption spectra of Er3+ and Ni2+ were investigated by measuring the diffuse reflectance spectra of the samples using an integrating sphere. Stokes and UC emission spectra were obtained under continuous wave (CW) laser diode (emitting at 1180 and 1490 nm) excitations using a suitable bandpass and cut-off filters. An integrating sphere and Si- and InGaAs charged-coupled devices (CCDs) were used to determine the internal quantum yield (QY). The detail of the QY measurements is summarized in the ESI.† To evaluate the ET rates, time-resolved measurements of the emission intensity were carried out. An optical parametric oscillator (OPO) pumped by the third harmonic of a Nd-YAG laser (7 ns pulse duration) was employed for this purpose. Wavelength-dependent UC sensitivities were measured using the same OPO by varying the excitation wavelengths at desired values. Si and InGaAs photodiodes and suitable bandpass filters were used to obtain the emitted photons, and the output signal was accumulated using a storage oscilloscope.
3. Results and discussion
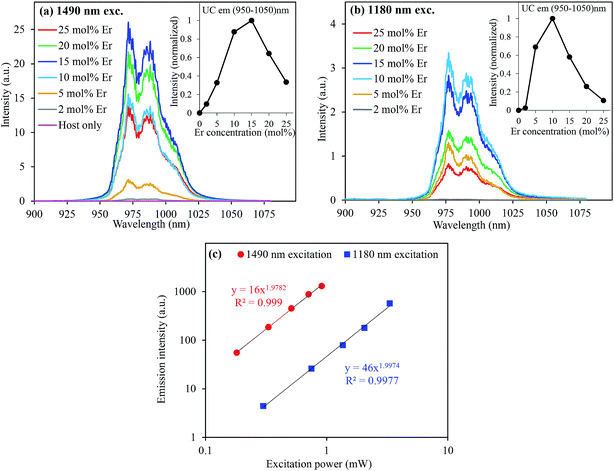
UC emission spectra of CaTiO3:x mol% Er,0.2 mol% Ni excited at 1490 nm (direct Er3+ excitation) and 1180 nm (through indirect Ni2+ excitation) are shown in Fig. 1(a) and (b), respectively. A clear UC emission at around 980 nm, which is the characteristic of Er3+, was observed under both the Er3+ and Ni2+ excitations. Under the 1180 nm excitation, the excitation energies were absorbed by Ni2+ ions and then transferred to Er3+ ions, followed by Er3+ UC at 980 nm.14,15 ET mechanisms have been discussed in details elsewhere in very similar Er3+, Ni2+-codoped upconverters.19,24 The dependence of the UC emission intensity on the Er3+ concentration is also presented in the insets of Fig. 1. It shows that the intensity increased super-quadratically with the Er3+ concentration when the sample was excited at 1490 nm. The absorbance increased with the Er3+ concentration, as shown in Fig. S1 (ESI†), which was equivalent to more intense excitation. Since UC is a two photon process, as clearly seen in Fig. 1(c), the UC intensity would be proportional to the square of the Er3+ concentration. In addition, the probability of the energy transfer UC (ETU) also increases with the Er3+ concentration because energy migration among Er3+ ions (4I11/2 states) is more significant.25,26 The UC emission intensity exhibited super-quadratic relation on the Er3+ concentration; this suggested that the ETU was the dominant process.24 On the other hand, the absorbance was almost constant under the 1180 nm excitation (since Ni2+ concentration was constant). The increased UC intensity with the Er3+ concentration is due to increased Ni → Er ET efficiency (see ESI,† Fig. S2 for the ET efficiency with the Er3+ concentrations) and ETU probability.19 Both were increasing as a function of the Er3+ concentration. Thus, the dependence of the UC emission intensity on the Er3+ concentration was weaker than that under the 1490 nm excitation; hence, the UC emission intensity exhibited the maximum at a lower Er3+ concentration (10 mol%) than that under the 1490 nm excitation (15 mol%). The UC emission intensity also increased with the Ni2+ concentration when the sample was excited at the Ni2+ absorption band, as shown in the ESI, Fig. S3.† It is obvious that the absorbance increases with the Ni2+ concentration (ESI, Fig. S3(c)†); this leads to an increase in the energies transferred to Er3+ ions and hence stronger Er3+ UC emissions. However, Ni ← Er EBT and energy dissipation through defects increased at higher doping concentrations that reduced the UC emission. Thus, these trade-off relationships determined the overall UC emission intensity. We have optimized the doping concentrations of Er and Ni for the most intense UC emission intensity and found ∼15 mol% Er and ∼0.20 mol% Ni for the CaTiO3 host.When the tetravalent Ti4+ ions were substituted by the divalent Ni2+ ions (the substitution of Ti4+ by Ni2+ was confirmed by the XRD data of various Ni-substituted samples where the increased lattice parameters and cell volume were observed when the bigger Ni2+ ions (∼0.69 Å) substituted the smaller Ti4+ ions (0.60 Å), as shown in Fig. S4 (ESI†)), oxygen vacancies were created to maintain charge neutrality, as illustrated in the scheme in Fig. 2  . These oxygen vacancies would cause parasitic absorption and non-radiative relaxation of the excited energies. If the amount of oxygen vacancies is quite large, clustering occurs27 and tetrahedral Ni2+ ions are formed, as shown in Fig. 2(a). Alternatively, to minimize the oxygen vacancies, Ni2+ ions would change to Ni3+ ions.15 The energy levels of Ni3+ and tetrahedral Ni2+ ions are low lying than the 4I13/2 level of Er3+ ions.28,29 This favours rapid relaxation of the excited energies to the ground state within Ni2+ ions rather than the ET to Er3+ ions. Only the energy levels of Ni2+ ions with an octahedral coordination are higher than the I13/2 level of Er3+ ions; hence, Ni2+ ions can transfer the energies to Er3+ ions and contribute to the UC process.15 The appearance of a broad absorption band in the visible range (Fig. 3(a)) for the Er, Ni-codoped samples confirmed that these defects existed. Furthermore, a quite broad absorption band in the entire NIR range suggests the existence of tetrahedral Ni2+ and/or Ni-associated defects.29
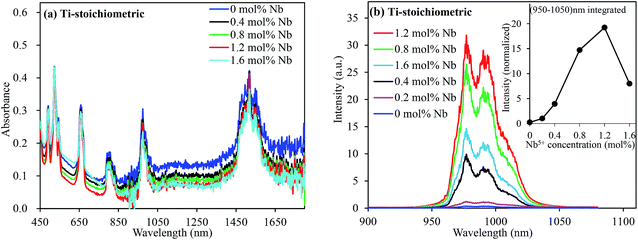
When multivalent charge compensators such as Nb5+ were codoped with Ni2+ ions, these defect-related broad absorption band in the visible range remarkably reduced, as shown in Fig. 3(a); this indicated the depletion of the oxygen vacancies (Ti4+ + 2Ti4+ = Ni2+ + 2Nb5+).30 It has been reported that substitution with cations of a valency higher than that of Ti4+ in SrTiO3 creates Ti3+ species in the vicinity of the multivalent dopants.30 Since Ti3+ ions are electron donor species, their presence in the vicinity of the doped Ni ions stabilizes Ni in its divalent state; furthermore, electrons donated by Ti3+ species occupy the oxygen vacancy sites; this retains the octahedral coordination environment for Ni2+ ions, and Ti4+ ions remain in their original position; otherwise, Ni would change to tetrahedral and other symmetries. The continuous decrease of the absorption bands intensity in the NIR range (Fig. 3(a)) confirmed the suppression of the tetrahedral Ni2+ ions and the associated defects. As a result of the decreased defects, the UC emission was intensified by more than 20 folds, as depicted in Fig. 3(b). However, absorption related to the oxygen vacancies, the tetrahedral Ni2+, and/or Ni-associated defects could not be completely depleted even via codoping with sufficiently large amounts of Nb5+ ions. As seen in Fig. 3(a), the defect-related absorption around 400–750 nm and longer wavelengths remained significant even by codoping 1.6 mol% Nb, which was 8 times larger as compared to that of the doped Ni. Indeed, the UC emission intensity decreased at higher Nb5+ concentrations, exhibiting an adverse effect, as shown in the inset of Fig. 3(b). It is obvious that the segregation and/or pairing of Nb5+ is possible; this leads to other types of defects, as observed by the pronounced absorption in the visible range for the 1.6 mol% Nb-codoped sample, as shown in Fig. 3(a), and undesired Nb-related products (Fig. S5, ESI†).31 Thus, it is essential to find ways to stabilize Ni2+ in its octahedral coordination and completely remove the defects in the Er3+, Ni2+-codoped perovskites to enhance the broadband-sensitive UC emission efficiency.
It has been well reported that alkaline earth titanates, such as SrTiO3, contain oxygen vacancies because they are intrinsic nonstoichiometric compounds, slightly deficient in oxygen as compared to their stoichiometric composition.30,32 A small amount of lattice oxygen is released to the gas phase due to the dissociation of the Ti–O bonds; this leads to the creation of oxygen vacancies along with the release of free electrons in the lattice. In the CaTiO3 host, without any aliovalent ion dopants, a clear appearance of a broad absorption band from around 400 to 800 nm confirmed the existence of oxygen vacancies (ESI, Fig. S6(a)†). The concentration of the oxygen vacancies, to which the absorbance is proportional, remarkably reduces in the Ti-deficit compositions. The low concentration of the oxygen vacancies in the Ti-deficit sample was further confirmed by a smaller weight gain during temperature increase in air, which was at least 7 times smaller than those in the Ti-stoichiometric and Ti-excess samples (ESI, Fig. S6(b)†). In the Ti-deficit compositions, the Ti–O bond becomes stronger, as observed by a shorter Ti–O bond length, as compared to that in the Ti-stoichiometric sample, as shown in Fig. S7 (ESI†). As a result of the stronger Ti–O bond in the Ti-deficit CaTiO3 compositions, it is difficult to dissociate and release oxygen from the CaTiO3 lattice to create oxygen vacancies. Thus, we prepared CaTiO3:Er,Ni samples with various Ti-compositions to remove the intrinsic oxygen vacancies and/or related defects, and their optical properties were studied.
Fig. 4 shows the UC emission spectra of the CaTiO3:Er,Ni samples with various Ti compositions excited at 1490 nm and 1180 nm. With the decreasing Ti content, the UC emission intensity gradually increased up to ∼0.10 mole of Ti deficiency (0.90 Ti); afterwards, it started decreasing. On the other hand, the UC emission intensity remained almost unchanged for the Ti-excess compositions (Ti ≥ 1.00). The maximum UC intensity was observed for the samples with ∼0.10 moles of Ti-deficiency under both the 1490- and 1180 nm excitations. We measured the XRD patterns of these samples with various Ti-compositions, as presented in Fig. S8 (ESI†). No remarkable phase change was observed except the appearance of Er2Ti2O7 pyrochlore phase for the Ti-deficit compositions and a small amount of unreacted TiO2 for the Ti-excess compositions.33,34 Furthermore, with the decreasing Ti content, the Er2Ti2O7 phase gradually increased. It suggested that the CaTiO3 phase remained stable in the wide compositions compensated by the formation of the oxygen rich Er2Ti2O7 pyrochlore phase. We separately prepared Gd2Ti2O7 and TiO2 samples containing 15 mol% Er and Er2Ti2O7 sample to see the effects of these phases on the Er3+ UC emission intensity. All of them exhibited poor Er3+ UC emission intensity (weaker than that of CaTiO3); this indicated that the increased UC emission of Ti-deficit samples was not directly originated from these secondary phases. We also measured the XANES spectra of the Ti-deficit and Ti-stoichiometric samples and compared these with those of the standard TiO2 and Ti2O3 samples, as shown in the Fig. S7 (ESI†). The absorption edge of the titanium atoms in both the Ti-deficit and Ti-stoichiometric samples is very similar to that of the TiO2 standard sample; this confirms that all Ti-atoms exist as Ti4+ ions irrespective of the small variation in Ti-compositions. Thus, the difference in the UC emission intensities of CaTiO3:Er,Ni samples with various Ti compositions was not originated due to the structural variation of the host lattice as well.
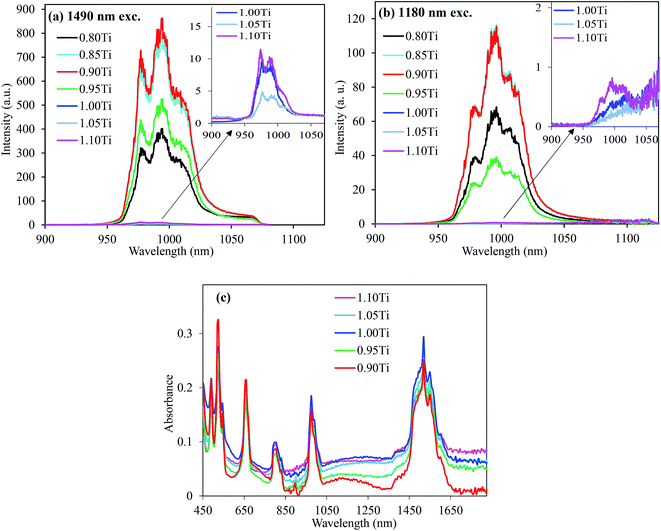 | ||
| Fig. 4 UC emission spectra of the CaTiO3:15 mol% Er,0.2 mol% Ni,0.4 mol% Nb excited at (a) 1490 nm and (b) 1180 nm with different Ti compositions and (c) absorption spectra of the selected samples. | ||
As abovementioned, large concentrations of the intrinsic oxygen vacancies exist in the Ti-stoichiometric and Ti-excess compositions (Fig. S6, ESI†). Ni2+ doping further increased their concentration (CaTi1−xNixO3−δ(VO)δ+x). As a result of a larger concentration of the oxygen vacancies, the pairing of the vacancies around Ni2+ ions was preferred and the concentration of the tetrahedral Ni2+ ions increased. In other words, a fraction of Ni2+ ions with an octahedral coordination decreased. Strong absorption bands in the NIR range for the Ti-stoichiometric and Ti-excess samples in Fig. 4(c) also confirmed the existence of tetrahedral Ni2+ ions.29 As abovementioned, the energy levels of Ni2+ ions in the tetrahedral and other symmetries are low lying than the 4I13/2 energy level of Er3+ ions and do not contribute to the Er3+ UC. On the other hand, the intrinsic defect concentration was quite low (less than 7 folds) in the Ti-deficit compositions, as discussed earlier. Indeed, Ni2+ doping created the oxygen vacancies and might generate the tetrahedral Ni2+ ions. Codoping with a small amount of Nb5+ ions (as charge compensator for the Ni2+ dopant) was enough for the complete removal of the defects; hence, no more tetrahedral Ni2+/defects were observed, as seen by the complete depletion of the NIR absorption band for the 0.4 mol% Nb5+ ion-doped sample (ESI, Fig. S9†). Fig S10 (ESI†) shows the comparison of the UC emission intensities as a function of the Nb5+ concentrations for the Ti-stoichiometric and Ti-deficit samples; the saturation of the UC intensity at smaller doping concentration of Nb5+ for the Ti-deficit samples further suggested that no more defects were present. On the contrary, UC emission monotonically increased with Nb5+ concentrations for the Ti-stoichiometric sample up to 1.2 mol%, and afterwards, it decreased. Furthermore, the UC emission intensity for the Ti-deficit samples was more than 264 folds stronger than that of the Ti-stoichiometric sample (Fig. 5); this suggests that energy dissipation through the Ni-related defects and/or the tetrahedral Ni2+ ions still dominated even after a sufficient amount of Nb5+ was doped in the Ti-stoichiometric and Ti-excess samples. A quite low concentration of these defects in the Ti-deficit samples reduced the defect-related quenching and increased the UC intensity.
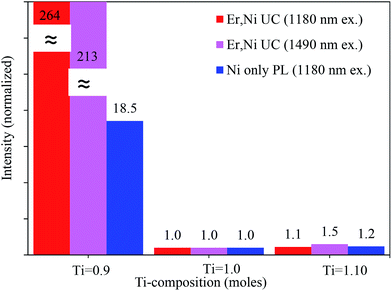 | ||
| Fig. 5 Comparison of the Er3+ UC and Ni2+ Stokes emission intensities of various Ti compositions. The values for each condition are separately normalized with the stoichiometric (Ti = 1.0) sample. | ||
We measured the Ni2+ Stokes emission intensities for these three samples containing 0.2 mol% Ni2+ and 0.4 mol% Nb5+ (without Er3+ codoping), and the integrated emission intensities are presented in Fig. 5 (see Fig. 6 for the Ni2+ emission spectra). It was clear that the Ni2+ emission (only Ni2+ ions with octahedral coordination contributed to 1200–1600 nm emission) was also intensified by more than 18 folds in the Ti-deficit sample as compared to those in the others. This further confirmed that a large fraction of Ni2+ ions in the Ti-stoichiometric and Ti-excess compositions existed as the tetrahedral or other coordination. Furthermore, the defects, which kill the luminescence, decreased not only the Er3+ emission but also the Ni2+ emission.35 Moreover, Fig. 5 shows the comparison of the UC emission intensity of the Er, Ni-codoped samples when they were directly excited at the Er3+ absorption band wavelength (1490 nm). The UC emission for the Ti-deficit sample was 213 folds intense than that of the Ti-stoichiometric and Ti-excess samples; this revealed a very similar trend to that of the Ni2+ excitation at 1180 nm.
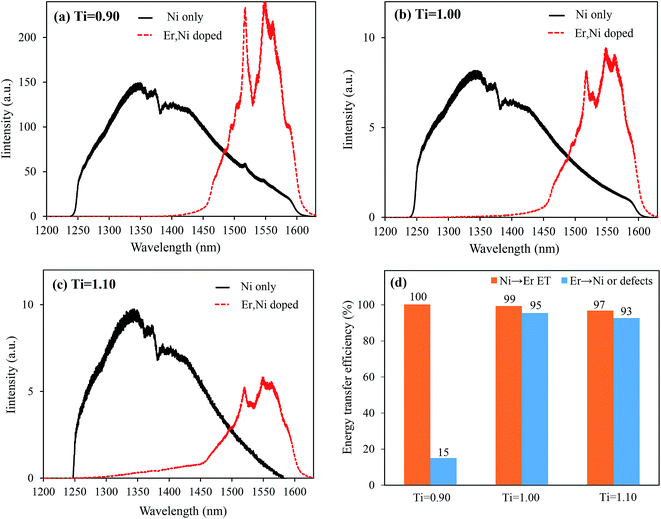
Fig. 6 shows the comparison of the Ni2+ Stokes emission for the Ni-only doped and Ni, Er-codoped samples for different Ti compositions under excitation at 1180 nm. For the Ti-deficit composition, the Ni2+ emission completely disappeared upon introducing Er3+; this confirmed that almost all the energy absorbed by Ni2+ transferred to Er3+, as observed in the time decay measurements in the ESI, Fig. S2.† For the Ti-stoichiometric and Ti-excess compositions, a weak Ni2+ emission still remained, indicating that a small fraction of the energy absorbed by Ni2+ was not transferred to Er3+ ions even with a sufficiently large amount of Er3+ codoping (15 mol%). From the ratio of the integrated emission intensities of the Ni-only doped samples and Er, Ni-codoped samples, the ET efficiencies were estimated and are presented in Fig. 6(d). Nearly 100% Ni → Er ET was realized in the Ti-deficit composition, whereas the ET efficiencies were ∼95% and ∼93% for the Ti-stoichiometric and Ti-excess compositions, respectively. However, these incremental differences in the ET efficiency cannot explain more than 260 folds increased UC emission for the Ti-deficit sample.
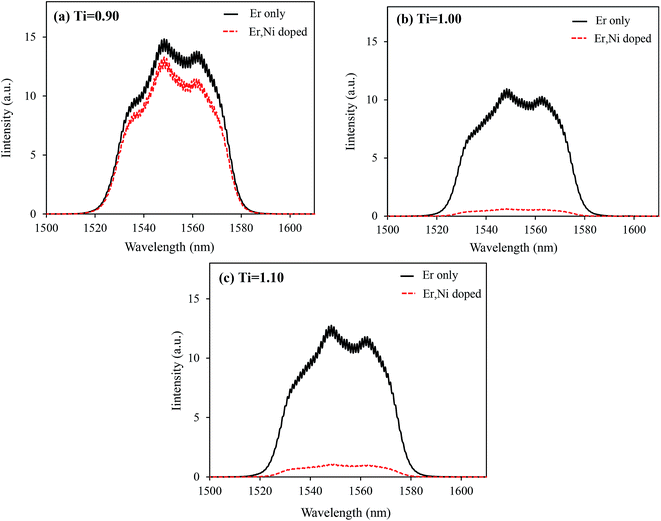
As discussed in our previous reports,19,24 the Ni ← Er EBT and other energy dissipation processes, such as Er3+ → defects energy migration, should influence the UC performance. Fig. 7 shows the Stokes emission spectra of the Er-only doped samples in comparison with those of the Ni, Er-codoped samples under the direct Er3+ excitation at 1490 nm. The Er3+ emission intensities at around 1550 nm were comparable for all the Er-only doped samples. However, by Ni-codoping, they were reduced by different extents. For the Ti-deficit sample, the reduction of the Er3+ emission intensity was as low as 15%, whereas the emission intensities decreased by more than 90% for the Ti-stoichiometric and Ti-excess samples. It suggests that most of the energy stored in the Er3+ emitters (either transferred from the Ni2+ or directly absorbed by themselves) dissipates nonradiatively by Ni-codoping in the Ti-stoichiometric and Ti-excess samples because of the existence of a larger number of oxygen vacancies, which creates larger numbers of tetrahedral Ni2+ ions having lower energy levels. Very similar EBT from Er3+ to Ni2+ is expected in the Ti-deficit composition too, but due to quite low concentration of the oxygen vacancies and, more importantly, due to the absence of tetrahedral Ni2+ ions, marginal energy dissipation occurs.
We have determined the energy dissipation efficiency (ηEr → Ni or defects), which is defined as the ratio of Er3+ emission in the Er-only doped samples to that of the Er, Ni-codoped samples, where ET to the Ni and/or Ni-associated defects are possible, that can be expressed as follows:
 | (1) |
We compared the relative emission intensities of the broadband-sensitive upconverters that have been recently reported,14,24 and the results are presented in Fig. 8. It is clear that the optimized CaTiO3:Er,Ni upconverter is more than 12 folds superior when excited at the Ni2+ absorption band and almost 4 folds stronger when directly excited at the Er absorption band. The increased UC intensity of the CaTiO3:Er,Ni upconverter is due to the following three factors: (1) the increased absorption of the active ions in the more distorted CaTiO3 crystal structure than that in CaZrO3, as shown in the Fig. S11 ESI.† The Er3+ absorption at ∼1490 nm increased by almost two folds in the CaTiO3 sample as compared to that in the CaZrO3; this is due to the higher f–f transitions probabilities of Er3+ ions in the more distorted CaTiO3 host.5 Since UC is a two photon process, increase in absorption increases the UC emission in a quadratic way that results in 4-fold increased UC emission intensity. (2) The larger ET extent from Ni2+ to Er3+ that reached nearly 100% in the optimized CaTiO3:Er,Ni upconverter as compared to only ∼86% in the CaZrO3:Er,Ni sample14 and the minimum energy dissipation through the EBT to Ni2+ and/or the defects.18 (3) The enhanced Er3+ UC efficiency itself in the more distorted CaTiO3 sample as compared to those of CaZrO3 and LaGaO3. The f–f transition probabilities in the emission state (4I11/2 to 4I15/2 transition) of Er3+ ions also intensified in the more distorted hosts. Thus, further higher UC emission intensity is expected in the CaTiO3 sample.
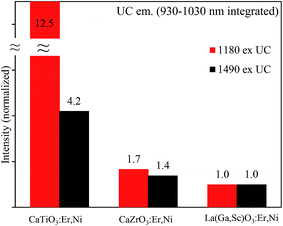 | ||
| Fig. 8 Comparison of the integrated UC emission intensities for various broadband-sensitive upconverters developed. | ||
Fig. 9 presents the absorption, the excitation, and the upconverted emission spectra of the CaTiO3:15 mol% Er,0.2 mol% Ni sample. The excitation spectrum was obtained from the integrated UC intensities normalized by the square of the excitation intensities. The upconverter developed herein exhibited a broadband sensitivity and could efficiently upconvert the energies of 1060–1630 nm range to 980 nm, which was efficiently absorbed by c-Si solar cells. If all photons in the Er3+ absorption band ranging from 1450 to 1630 nm are perfectly upconverted, the improvement in the short-circuit current density (JSC) is 2.4 mA cm−2 under the AM1.5G 1 sun illumination.36 The introduction of Ni2+ (absorption range 1060 to 1450 nm) contributes an additional gain of 5.4 mA cm−2 that is nearly 3 times larger than that originating from the Er3+ absorption alone. The present optimal c-Si solar cell conversion efficiency is ∼26% with a JSC ∼ 40 mA cm−2.17 Speculating a perfect UC, the newly developed CaTiO3:Ni2+,Er3+ broadband-sensitive upconverter can improve the conversion efficiency by ∼4.8% (absolute) for the present c-Si solar cells. We measured the absolute quantum yield of the optimized CaTiO3:Er,Ni sample excitated at 1490 nm (direct Er3+ excitation) and 1180 nm (indirect Ni2+ excitation), and it was estimated to be 2.53% and 0.86%, respectively. As abovementioned, the lower value for the Ni2+ excitation is due to the dissipation of excitation energies through the Ni-related defects. The detail of the UC QY measurements is summarized in Fig. S12 and S13 (ESI†) and also explained in the ESI.† Although quite high QY values (5–8%) have been reported in the fluoride-based upconverters,37–39 this is the highest value known to date for the oxide-based upconverters. However, further improvement of UC efficiency is essential to realize the increased c-Si solar cell efficiency, and it can be achieved by engineering suitable host structures such that Ni2+ absorption and emission band positions can be well tuned to surpass the reabsorption of the emitted photons at 980 nm. The absorption of Ni2+ and Er3+ ions and the UC emission efficiency of Er3+ itself can be improved in these engineered crystal structures that definitely improve the overall UC efficiencies. Another promising approach of realising efficient upconverters is through coupling with the novel plasmonic nanoparticles. The transition probabilities of the active ions at the absorption and emission bands can be increased by many folds through the increased electric field effects of the plasmonic nanoparticles,40 and these experiments are under progress.
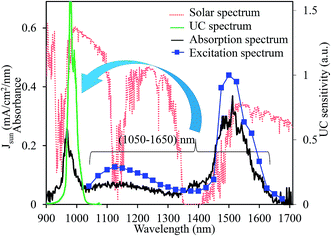 | ||
| Fig. 9 Schematic of the broadband-sensitive UC in the CaTiO3:Ni2+,Er3+ upconverter. Red dotted line shows the AM1.5G solar spectrum. | ||
4. Conclusions
We realized a greater than 12-fold improvement in the broadband-sensitive UC emission intensity of the optimized CaTiO3:Ni2+,Er3+ as compared to that of the previously reported CaZrO3:Ni2+,Er3+ and La(Ga,Sc)O3:Ni2+,Er3+ upconverters. The effect of Ti compositions played important roles in the improvement of UC emission. The Ti-deficient (less than 0.1 mole Ti) composition exhibited 264-fold increase in UC emission as compared to the Ti-stoichiometric and Ti-excess compositions. The increased UC emission is explained on the basis of the removal of defects (the oxygen vacancies) and the stabilization of Ni2+ ions in their octahedral coordination environments such that the efficient Ni → Er ET and the minimum energy dissipation through the tetrahedral Ni2+ and/or defects are possible. A UC QY of ∼2.53% was achieved in the optimized upconverter while it was excited at 1490 nm, which was the highest value reported to date for the oxide-based upconverters. The broadband-sensitive upconverters absorb photons in a broad solar radiation range, viz. 1060–1600 nm, and emit photons at 980 nm, which is efficiently absorbed by c-Si solar cells. If all photons of 1060–1600 nm range are utilized properly, nearly 7.8 mA cm−2 current density gain of the present c-Si solar cells (∼40 mA cm−2) is possible, which accounts for 4.8% (absolute) increased gain. However, to realize these high solar cell efficiencies, significant improvement in the conversion efficiency of these upconverters is essential.Conflicts of interest
There are no conflicts to declare.Acknowledgements
This work was partially supported by the Advanced Low Carbon Technology Research and Development Program (ALCA), Japan Science and Technology Agency. The XANES experiments were performed at the BL33XU beamline at SPring-8 synchrotron radiation facility (Proposal no. 2016A7030).Notes and references
- W. Zou, C. Visser, J. A. Maduro, M. S. Pshenichnikov and J. C. Hummelen, Nat. Photonics, 2012, 6, 560–564 CrossRef CAS.
- B. Zhou, B. Shi, D. Jin and X. Liu, Nat. Nanotechnol., 2015, 10, 924–935 CrossRef CAS PubMed.
- T. Trupke, M. A. Green and P. Würfel, J. Appl. Phys., 2002, 92, 4117–4122 CrossRef CAS.
- C. Strümpel, M. McCann, C. Del Canizo, I. Tobias and P. Fath, Proc. 20th European Photovoltaic Solar Energy Conference, Barcelona, Spain, 2005, pp. 43–43 Search PubMed.
- Q. Huang, H. Yu, E. Ma, X. Zhang, W. Cao, C. Yang and J. Yu, Inorg. Chem., 2015, 54, 2643 CrossRef CAS PubMed.
- E. Downing, L. Hesselink, J. Ralston and R. Macfarlane, Science, 1996, 273, 1185 CAS.
- G. S. Yi and G. M. Chow, Chem. Mater., 2007, 19, 341 CrossRef CAS.
- H. N. Luitel, R. Chand and T. Watari, Displays, 2016, 42, 1–8 CrossRef CAS.
- H. Lin, G. Meredith, S. B. Jiang, X. Peng, T. Luo, N. Peyghambarian and Y. B. Pun, J. Appl. Phys., 2003, 93, 186 CrossRef CAS.
- H. N. Luitel, R. Chand, H. Hamajima, Y. R. Gaihre, T. Shingae, T. Yanagita and T. Watari, J. Mater. Chem. B, 2016, 4, 6192–6199 RSC.
- L. E. Enrico Cavalli, J. Hostasa and M. Pedroni, J. Eur. Ceram. Soc., 2013, 33, 1425 CrossRef.
- A. Shalav, B. S. Richards, T. Trupke, K. W. Krämer and H. U. Güdel, Appl. Phys. Lett., 2005, 86, 10 CrossRef.
- S. Fischer, A. Ivaturi, B. Fröhlich, M. Rüdiger, A. Richter, K. Krämer, S. Bryce and J. C. Goldschmidt, 39th IEEE Photovoltaic Specialists Conference, 2013, pp. 3–5 Search PubMed.
- H. N. Luitel, S. Mizuno, T. Tani and Y. Takeda, RSC Adv., 2016, 6, 55499–55506 RSC.
- Y. Takeda, S. Mizuno, H. N. Luitel and T. Tani, Appl. Phys. Lett., 2016, 108, 043901 CrossRef.
- H. N. Luitel, S. Mizuno and Y. Takeda, Phys. Status Solidi A, 2017, 214, 1600899, DOI:10.1002/pssa.201600899.
- M. A. Green, K. Emery, Y. Hishikawa, W. Warta and E. D. Dunlop, Prog. Photovoltaics, 2016, 24, 3–11 Search PubMed.
- H. N. Luitel, S. Mizuno, T. Tani and Y. Takeda, Opt. Mater., 2017, 64, 314–322 CrossRef CAS.
- Y. Takeda, S. Mizuno, H. N. Luitel, K. Yamanaka and T. Tani, J. Appl. Phys., 2016, 120, 073102 CrossRef.
- Materials Project, https://www.materialsproject.org.
- M. Yashima and R. Ali, Solid State Ionics, 2009, 180, 120–126 CrossRef CAS.
- T. Nonaka, K. Dohmae, Y. Hayashi, T. Araki, S. Yamaguchi, Y. Nagai, Y. Hirose, T. Tanaka, H. Kitamura, T. Uruga, H. Yamazaki, H. Yumoto, H. Ohashi and S. Goto, AIP Conf. Proc., 2016, 1741, 030043 CrossRef.
- T. Nonaka, K. Dohmae, T. Araki, Y. Hayashi, S. Yamaguchi, Y. Hirose, Y. Nagai, T. Uruga, H. Yamazaki, T. Mochizuki, H. Tanida and S. Goto, Rev. Sci. Instrum., 2012, 83, 083112 CrossRef CAS PubMed.
- Y. Takeda, S. Mizuno, H. N. Luitel and K. Yamanaka, Appl. Phys. Express, 2016, 9, 112402 CrossRef.
- D. Khoptyar and B. Jaskorzynska, J. Opt. Soc. Am. B, 2005, 22, 2091–2098 CrossRef CAS.
- A. K. Przhevuskii and N. V. Nikonorov, Opt. Mater., 2003, 21, 729–741 CrossRef CAS.
- H. Iwahara, T. Esaka and T. Mangahara, J. Appl. Electrochem., 1988, 18, 173–177 CrossRef CAS.
- J. Koetke, G. Huber and K. Petermann, J. Lumin., 1991, 48–49, 564–568 CrossRef CAS.
- N. Vasileva, P. A. Gerus, V. Sokolov and V. G. Plotnichenko, J. Phys. D: Appl. Phys., 2012, 45, 485301 CrossRef.
- T. Takata and K. Domen, J. Phys. Chem. C, 2009, 113, 19386–19388 CAS.
- R. Grimes, Atomistic Simulation, http://abulafia.mt.ic.ac.uk/shannon/ptable.php.
- X. Pan, M. Yang, X. Fu, N. Zhang and Y. Xu, Nanoscale, 2013, 5, 3601–3614 RSC.
- T. Tani and T. Takeuchi, Sci. Technol. Adv. Mater., 2015, 16, 035008 CrossRef PubMed.
- Springer Materials, http://materials.springer.com.
- S. Som, A. K. Kunti, V. V. Kumar, S. Dutta, M. Chowdhury, S. K. Sharma, J. J. Terblans and H. C. Swart, J. Appl. Phys., 2014, 115, 193101 CrossRef.
- Solar spectrum AM1.5, http://rredc.nrel.gov/solar/spectra/am1.5/.
- A. Ivaturi, S. K. W. MacDougall, R. MartínRodríguez, M. Quintanilla, J. MarquesHueso, K. W. Krämer, A. Meijerink and B. S. Richards, J. Appl. Phys., 2013, 114, 013505 CrossRef.
- Y. Shang, S. Hao, C. Yang and G. Chen, Nanomaterials, 2015, 5, 1782–1809 CrossRef CAS PubMed.
- I. Etchart, PhD Dissertation, University of Cambridge, 2010.
- X. Chen, D. Zhou, W. Xu, J. Zhu, G. Pan, Z. Yin, H. Wang, Y. Zhu, C. Shaobo and H. Song, Sci. Rep., 2017, 7, 41079 CrossRef CAS PubMed.
Footnote |
| † Electronic supplementary information (ESI) available. See DOI: 10.1039/c7ra07415h |
| This journal is © The Royal Society of Chemistry 2017 |

