 Open Access Article
Creative Commons Attribution 3.0 Unported Licence
Performance of palladium–tin bimetallic catalysts supported on activated carbon for the hydrodechlorination of 4-chlorophenol
Xu Fang a and
Deren Fang*ab
aInstitute of Applied Catalysis of Yantai University, Yantai 264005, China. E-mail: fdr@ytu.edu.cn
bLight Hydrocarbon Comprehensive Utilization Engineering Center, Yantai University, Yantai 264005, China
First published on 18th August 2017
Abstract
The influence of Sn on the activity and selectivity of Pd catalysts for the hydrodechlorination (HDC) of 4-chlorophenol (CP) in an aqueous phase was studied. The Pd–Sn bimetallic catalysts were prepared using the coimpregnation method and characterised using temperature-programmed reduction, high-resolution transmission electron microscopy, X-ray photoelectron spectroscopy, and hydrogen pulse chemisorption measurements. The results showed that when the molar ratio of Sn/Pd is less than 1/1, the addition of Sn to Pd catalysts improves the dispersibility of Pd particles and improves the catalytic activity of HDC.
Introduction
Chlorophenols (CPs) are the chemical raw materials and intermediate products most widely used in the manufacturing of pesticides, leather, dyes, and disinfectants.1 However, CPs are also persistent toxic compounds that destroy the environment and which must be eliminated from water. In recent years, liquid phase catalytic hydrodechlorination (HDC) has been used to displace chlorine with hydrogen in the pollutant, forming low- or non-toxic products under mild conditions. This process is considered promising for the treatment of chlorinated organic pollutants,2 and is efficient for managing compounds with various concentrations of chlorine. Although HDC does not completely destroy CPs, it efficiently transforms them into substantially less harmful species, which involves a significant decrease in the ecotoxicity of the effluent. HDC reactions have been studied using a number of metals, including Pd,3–13 Pt,14 and Rh,15 with Pd being the most common active metal due to its considerable adsorption and dissociation of H2.16 Catalytic support for HDC also plays a key role in both the catalytic activity and stability of the metals, and alumina and activated carbon (AC) are the support systems most reported in the literature.17,18 Bimetallic nanoparticles (usually Pd decorated with another metal) exhibit superior catalytic performance compared with pure Pd catalysts due to their enhanced tunability in chemical compositions and metal structures,19 and include compounds such as Pd–Fe,20 Pd–Al,21 Pd–Cu,11 and Pd–In.12The study of new and efficient bimetallic catalysts continues to have broad potential. For example, Pd–Sn bimetallic catalysts were found to be highly active at removing nitrate from water,22 but the HDC of CPs using this catalyst has not been reported. Therefore, we prepared a series of Pd–Sn bimetallic catalysts supported on AC, and found that they are highly active in the HDC of CPs, specifically 4-CP. The results indicated that adding an appropriate amount of Sn can improve the catalytic activity of the Pd/AC catalyst for the HDC of CPs.
Experimental
Catalyst preparation
The Pd–Sn bimetallic catalysts were prepared using the coimpregnation method, and commercial coconut shell AC with a diameter of 0.045–0.075 mm was used as a support. The Pd content was fixed at 1 wt%, and the Sn content was varied to obtain Sn/Pd molar ratios of 0.1/1, 0.3/1, 0.5/1, 1/1, 3/1, and 5/1; the corresponding catalysts were designated SP-0.1/1, SP-0.3/1, SP-0.5/1, SP-1/1, SP-3/1, and SP-5/1, respectively. A typical catalyst preparation method was used to impregnate the precursors of the catalysts with the designated amount of aqueous PdCl2 and aqueous SnCl4. The catalysts were then dried at 110 °C for 2 h and calcined at 350 °C for 2 h. Notably, the catalysts must be activated at 623 K for 2 h by using a flow of pure H2 at atmospheric pressure prior to performing high-resolution transmission electron microscopy (HRTEM), X-ray photoelectron microscopy (XPS), H2 pulse chemisorption measurements, and the HDC test; by contrast, the sample used to determine temperature-programmed reduction (TPR) characterisation does not require prereduction.Catalyst characterisation
HRTEM images were obtained using a JEM-200CX electron microscope equipped with a computer system for automatic operation and data processing; these images revealed the bright- and dark-field morphologies of the catalyst. Additionally, the electron diffraction spectrum and high-resolution atomic number contrast images were obtained using high-angle annual dark-field imaging.XPS was performed using a Thermo Fisher Scientific ESCALAB 250 spectrometer equipped with a standard Mg K-alpha source and a high-performance Al monochromatic source. All XPS spectra were referenced to the C 1s peak at 284.6 eV.
TPR was conducted using a TP5000 multifunction absorber. The catalyst weight was 50 mg, the particle size was 0.045–0.075 mm, a mixture of 10% H2/90% N2 was used as the reducing gas, and the temperature was increased from 20 to 300 °C at a rate of 5 °C min−1. The total H2 consumption was detected using a thermal conduction detector (TCD).
Finally, H2 pulse chemisorption measurements of the catalysts were performed using a TP5000 multifunction absorber and the TCD. The catalyst weight was 0.10 g. Prior to the H2 pulse chemisorption measurements, the catalysts were activated at 623 K for 2 h by using a flow of pure H2 at atmospheric pressure. The catalysts were then degassed, also at 623 K, for 2 h under a flow of Ar before being cooled to 300 K. H2 (5 vol%) was then injected into the Ar stream flowing through the sample bed. The injection loop was 0.5 mL. In the subsequent metal dispersion calculations, H2 was assumed to be chemisorbed only on the Pd composites. The surface areas and the dispersion of Pd are listed in Table 1.
| Catalysts | Molar ratios of Sn/Pd | Pd dispersion (%) | Pd surface area (m2 g−1) |
|---|---|---|---|
| 1% Pd | — | 28.1 | 62.5 |
| SP-0.1/1 | 0.1/1 | 34.6 | 83.0 |
| SP-0.3/1 | 0.3/1 | 45.0 | 94.3 |
| SP-0.5/1 | 0.5/1 | 30.0 | 76.5 |
| SP-1/1 | 1/1 | 29.5 | 60.1 |
| SP-3/1 | 3/1 | 24.3 | 58.2 |
| SP-5/1 | 5/1 | 18.6 | 33.4 |
Catalytic HDC
The HDC of 4-CP (Sigma, purity > 99.6%) was conducted under atmospheric pressure in a mixing glass tank reactor, with electromagnetic stirring to ensure maximum contact between the catalyst and the reactant.11 After reduction, 0.2 g of the catalyst was added to 200 mL of an aqueous mixture of 4-CP (1000 ppm) and NaOH (NaOH/4-CP molar ratio = 1.1/1). H2 was then added to the reactor at a rate of 50 mL min−1, which thus initiated HDC. After 7.5 min, 1 mL of the solution was extracted and analysed using gas chromatography with a flame ionisation detector and polyethylene glycol capillary column.Results and discussion
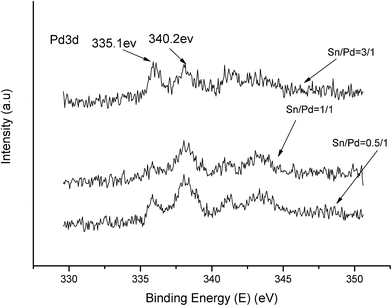
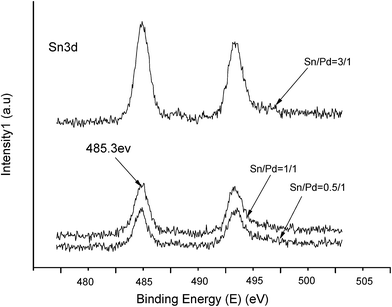
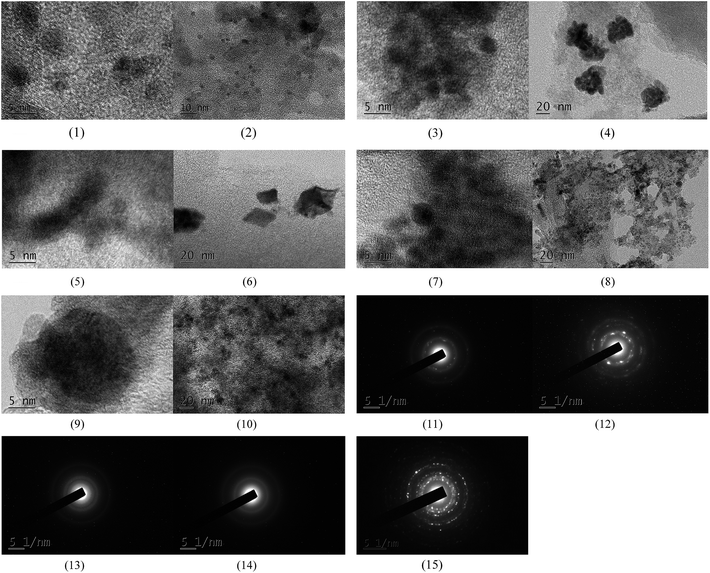
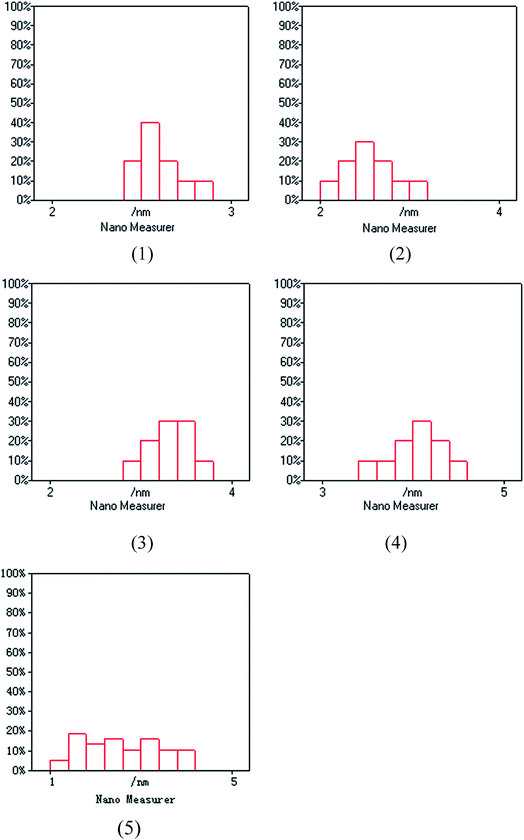
The XPS spectra in Fig. 1 illustrate that Pd 3d had two main peaks (335.1 and 340.2 eV) in all three catalysts, which correspond to the Pd 3d5/2 and Pd 3d3/2 binding energies of Pd0, respectively.23 In Fig. 2, the peak at 485.2 eV corresponds to the binding energy of Sn0.24,25 This means that in the catalysts, both Pd and Sn exist in a metal state. Specifically, during the reduction process, SnO2 was reduced to the metal atom Sn and came in close contact with Pd. A few Pd–Sn pseudoalloy particles then formed after the reduction.26The HRTEM results in Fig. 3 and 4 indicate that the size of Pd particles on the catalysts ranged from 2 to 5 nm. The mean particle size was 2.60 nm for SP-0.1/1, 2.55 nm for SP-0.3/1, 3.31 nm for SP-1/1, 4.03 nm for SP-3/1, and 2.71 nm for pure Pd (1%). The figure also reveals that when the Sn/Pd molar ratio is relatively low, Pd and Sn particles are well dispersed on the AC support, with a normal distribution of the active phase over the surface of the catalyst; additionally, these particles are smaller in size compared with those of the pure Pd catalyst. When the Sn content in the catalysts increases, the particle size also gradually increases; some agglomerations can be observed in the HRTEM results. Therefore, adding a small amount of Sn to the Pd/AC catalyst could improve the dispersion of Pd on the surface of the catalyst. Moreover, the Pd particles become covered by Sn particles when the amount of Sn increases, which leads to an increase in the grain size and lower catalytic activity.
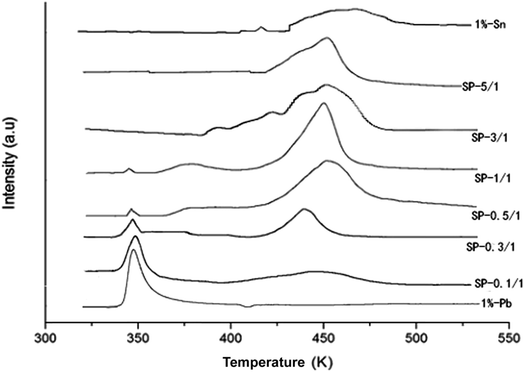
Fig. 5 shows the TPR profiles of the catalysts after the drying process. The TPR profile of the pure Pd catalysts showed only one reduction peak at 350 K.11,12 By contrast, the TPR profile of the pure Sn catalysts showed two reduction peaks at 442 and 475 K, which may correspond to the reduction of Sn4+ to Sn2+ and of Sn2+ to Sn0, respectively. The TPR profile of SP-0.1/1 was similar to that of the pure Pd catalyst, indicating that adding a small amount of Sn did not alter the microstructure of the Pd particles. It is suggested that the reduction mechanism of the Pd–Sn bimetallic catalysts may involve the reduction of PdO initially, followed by the reduction of SnO2.
Here, the peak intensity of PdO was decreased when Sn content was increased, whereas the peak intensity of SnO2 at approximately 460 K was obviously increased; the temperatures of the peaks also subsequently increased. The peak reduction to 370–400 K for the SP-0.3/1, SP-0.5/1, and SP-1/1 samples may be attributed to the reduction of PdO and SnOx, which triggered contact and cross-distribution between the catalysts. Following additional increases in the amount of Sn (SP-3/1 and SP-5/1 samples), the reduction peak of PdO disappeared; the temperature of the reduction peaks gradually became closer to the temperature of the peak of SnO2 peak; and the number of reduction peaks decreased until they became a single peak (SP-5/1), which indicates that a pseudoalloy was formed in the catalyst.
Through a comprehensive examination of the experimental results, it can be concluded that when there is less Sn, the metal Pd and Sn particles are separately distributed on the surfaces of the catalysts; by contrast, when there is more Sn, some degree of overlap between Pd and Sn particle dispersion occurs. This overlap leads to Pd–Sn aggregates, and thus the formation of a pseudoalloy.
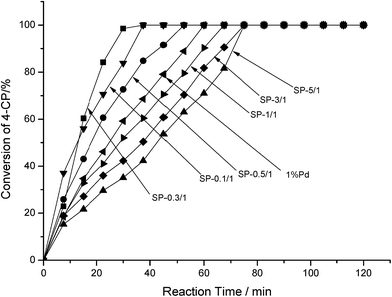
Fig. 6 depicts the performance of the catalysts in the HDC reaction. In order of the amount of HDC, the catalysts were ranked as follows: SP-0.1/1 > SP-0.1/1 > SP-0.5/1 > pure Pd > SP-1/1 > SP-3/1 > SP-5/1. When the Sn/Pd molar ratios were 0.1/1 or 0.3/1, 4-CP was completely hydrodechlorinated within 30 min; when the Sn/Pd molar ratios were 0.5/1, 1/1, 3/1, or 5/1, 4-CP was completely hydrodechlorinated within 75 min. The results show that Pd–Sn bimetallic catalysts are more active than Pd–Cu bimetallic catalysts and Pd–In bimetallic catalysts. The highest activity of Pd–Cu bimetallic catalyst completed the hydrochlorination of 4-CP process in 60 minutes.11 Not all ratios Pd–In bimetallic catalysts have completed hydrodechlorination of 4-CP process with in 120 minutes.12 These results demonstrate that adding specific amounts of Sn to the pure Pd catalyst increased catalytic activity. Moreover, according to the results presented in Table 1, the catalytic activity was correlated with the dispersion of Pd across the surface of the catalysts. In order of the amount of dispersion and surface area covered, the catalysts were ranked as SP-0.3/1 > SP-0.1/1 > SP-0.5/1 > pure Pd > SP-1/1 > SP-3/1 > SP-5/1, which is consistent with the ordering of catalyst activity. Among all of the catalysts, SP-0.3/1 had the highest Pd dispersion and most surface area covered; therefore, SP-0.3/1 had the highest catalytic activity in the HDC of 4-CP.
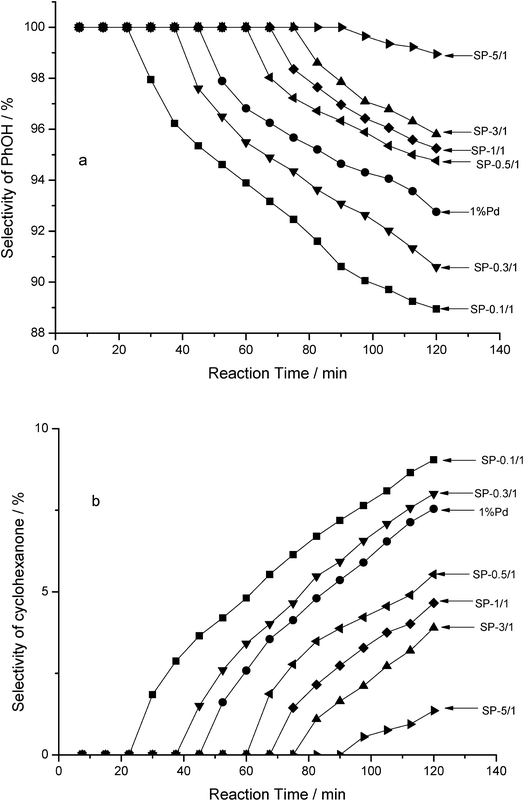
According to the results of a gas chromatography–mass spectrometry analysis, cyclohexanone is another product (in addition to phenol) that emerges during the HDC of 4-CP in an aqueous phase. This indicates that the HDC of 4-CP was a tandem reaction, in which 4-CP was initially subjected to hydrogenolysis with pure Pd and Pd–Sn bimetallic catalysts to form phenol; 4-Cp was subsequently further hydrogenated to form cyclohexanone. The selectivity of the products is shown in Fig. 7. In order of the selectivity of PhOH, the catalysts were ranked as follows: SP-5/1 > SP-3/1 > SP-1/1 > SP-0.5/1 > pure Pd > SP-0.3/1 > SP-0.1/1; notably, they were ranked in reverse regarding the selectivity of cyclohexanone. The tendency of the three bimetallic catalysts to select the phenol and cyclohexanone is consistent.
With the catalytic reaction time was prolonged, the selectivity of phenol gradually decreased (Fig. 7a), whereas the selectivity of cyclohexanone gradually increased (Fig. 7b) for all of the catalysts. In other words, the pure Pd monometallic catalyst and the Pd–Sn bimetallic catalysts engaged in different catalytic activities during the hydrogenolysis of the C–Cl bond of 4-CP and C![[double bond, length as m-dash]](https://www.rsc.org/images/entities/char_e001.gif) C double bond of phenol. Moreover, as the amount of Sn in the Pd–Sn bimetallic catalysts increases, the selectivity of cyclohexanone decreases and the selectivity of phenol increases. It was thus concluded that Sn was dispersed around the Pd particles adequately, effectively separating the Pd particles and preventing them from clustering when the Sn/Pd molar ratio was low. When the Sn/Pd molar ratios were high, Sn covered the surface of the pure Pd catalyst and formed a Pd–Sn pseudoalloy; this reduced the surface area of Pd. According to these results, Pd is the sole active centre for both reactions.
C double bond of phenol. Moreover, as the amount of Sn in the Pd–Sn bimetallic catalysts increases, the selectivity of cyclohexanone decreases and the selectivity of phenol increases. It was thus concluded that Sn was dispersed around the Pd particles adequately, effectively separating the Pd particles and preventing them from clustering when the Sn/Pd molar ratio was low. When the Sn/Pd molar ratios were high, Sn covered the surface of the pure Pd catalyst and formed a Pd–Sn pseudoalloy; this reduced the surface area of Pd. According to these results, Pd is the sole active centre for both reactions.
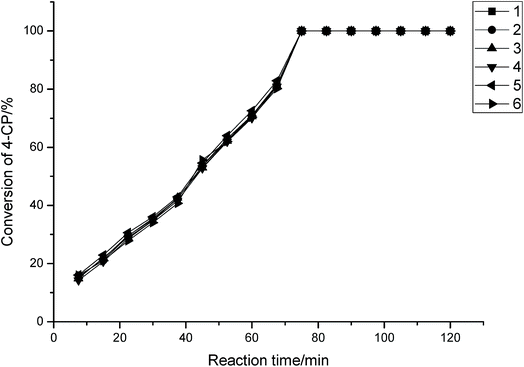
Fig. 8 illustrates the new catalysts can be reused up to six times and the results show that the conversion of 4-CP is almost constant.
Conclusion
A series of Pd–Sn/AC bimetallic catalysts was prepared, and their catalytic performance regarding the HDC of 4-CP in an aqueous phase was examined. Compared with the pure Pd/AC monometallic catalyst, Pd catalysts with various amounts of Sn exhibited increased Pd dispersion, larger Pd surface areas, and more catalytic activity in the HDC of 4-CP. However, Pd–Sn bimetallic catalysts with an excessive amount of Sn inhibited the HDC of 4-CP. In addition, Pd–Sn bimetallic catalysts with higher amounts of Sn were associated with less conversion of phenol through hydrogenation; furthermore, the Pd–Sn pseudoalloy in the Pd–Sn bimetallic catalysts inhibited the hydrogenation of phenol.Conflicts of interest
There are no conflicts to declare.References
- G. Q. Chen, S. Guan, G. M. Zeng, X. D. Li, A. W. Chen, C. Shang, Y. Zhou, H. K. Li and J. M. He, Appl. Microbiol. Biotechnol., 2013, 97, 3149–3157 CrossRef CAS PubMed.
- J. Zhou, K. Wu, W. J. Wang, Y. X. Han, Z. Y. Xu, H. Q. Wan, S. R. Zheng and D. Q. Zhu, Appl. Catal., B, 2015, 162, 85–92 CrossRef CAS.
- E. Diaz, A. F. Mohedano, J. A. Casas, L. Calvo, M. A. Gilarranz and J. J. Rodriguez, Appl. Catal., B, 2011, 106, 469–475 CrossRef CAS.
- A. Pintar, J. Batista and I. Muševič, Appl. Catal., B, 2004, 52, 49–60 CrossRef CAS.
- C. B. Molina, A. H. Pizarro, J. A. Casas and J. J. Rodriguez, Appl. Catal., B, 2014, 148–149, 330–338 CrossRef CAS.
- Y. L. Ren, G. Y. Fan, W. D. Jiang, B. Xu and F. Liu, RSC Adv., 2014, 4, 25440 RSC.
- S. Gómez-Quero, F. Cárdenas-Lizana and M. A. Keane, Chem. Eng. J., 2011, 166, 1044 CrossRef.
- G. Yuan and M. A. Keane, Catal. Today, 2003, 88(1), 27–36 CrossRef CAS.
- Y. Liu, L. Liu and J. Shan, et al., J. Hazard. Mater., 2015, 290, 1 CrossRef CAS PubMed.
- N. S. Babu, N. Lingaiah, N. Pasha, J. V. Kumar and P. S. Sai Prasad, Catal. Today, 2009, 141(1), 120–124 CrossRef CAS.
- D. Fang, W. Li and J. Zhao, et al., RSC Adv., 2014, 4(103), 59204–59210 RSC.
- J. Zhao, W. Li and D. Fang, RSC Adv., 2015, 5(53), 42861–42868 RSC.
- X. X. Ma, Y. Liu, S. J. Liu and C. H. Xia, Appl. Catal., B, 2014, 144, 580 CrossRef CAS.
- E. Díaz, J. A. Casas, A. F. Mohedano, L. Calvo, M. A. Gilarranz and J. J. Rodríguez, Ind. Eng. Chem. Res., 2008, 47, 3840–3846 CrossRef.
- Y. Ren, G. Fan and C. Wang, J. Hazard. Mater., 2014, 274, 32–40 CrossRef CAS PubMed.
- H. Chen, Z. Y. Xu, H. Q. Wan, J. Z. Zheng, D. Q. Yin and S. R. Zheng, Appl. Catal., B, 2010, 96, 307–313 CrossRef CAS.
- Z. M. de Pedro, E. Diaz, A. F. Mohedano, J. A. Casas and J. J. Rodriguez, Appl. Catal., B, 2011, 103, 128–135 CrossRef CAS.
- Z. Jin, X. Wang, S. Wang, D. Li and G. Lu, Catal. Commun., 2009, 10, 2027–2030 CrossRef CAS.
- J. Xu, T. White, P. Li, C. H. He, J. G. Yu, W. K. Yuan and Y. F. Han, J. Am. Chem. Soc., 2010, 132, 10398–10406 CrossRef CAS PubMed.
- V. Nagpal, A. D. Bokare, R. C. Chikate, C. V. Rode and K. M. Paknikar, J. Hazard. Mater., 2010, 175, 680 CrossRef CAS PubMed.
- B. Yang, S. B. Deng, G. Yu, H. Zhang, J. H. Wu and Q. F. Zhuo, J. Hazard. Mater., 2011, 189, 76 CrossRef CAS PubMed.
- D. P. Barbosa, P. Tchiéta and M. do Carmo Rangel, et al., J. Mol. Catal. A: Chem., 2013, 366, 294–302 CrossRef CAS.
- M. A. Alvarez-Montero, L. M. Gómez-Sainero, J. Juan-Juan, A. Linares-Solano and J. J. Rodriguez, Chem. Eng. J., 2010, 162, 599–608 CrossRef CAS.
- S. Hamid, M. A. Kumar and W. Lee, Appl. Catal., B, 2016, 187, 37–46 CrossRef CAS.
- J. R. Rumble, D. M. Bickham and C. J. Powell, Surf. Interface Anal., 1992, 19(1–12), 241–246 CrossRef CAS.
- L. Pastor-Pérez and A. Sepúlveda-Escribano, Fuel, 2017, 194, 222–228 CrossRef.
| This journal is © The Royal Society of Chemistry 2017 |

