 Open Access Article
Creative Commons Attribution 3.0 Unported Licence
Activity of IrO2 supported on tantalum-doped TiO2 electrocatalyst for solid polymer electrolyte water electrolyzer
Hong Lv *ab,
Guanghui Zhangab,
Chuanpu Haoab,
Cangen Mic,
Wei Zhouab,
Daijun Yangab,
Bing Liab and
Cunman Zhang*ab
aSchool of Automotive Studies, Tongji University, Shanghai 201804, People's Republic of China. E-mail: lvhong@tongji.edu.cn; zhangcunman@tongji.edu.cn; Fax: +86-21-6958-3850; Tel: +86-21-6958-3850
bClean Energy Automotive Engineering Center, Tongji University, Shanghai 201804, People's Republic of China
cCollege of Materials and Engineering, Hunan University, Changsha, Hunan 410082, People's Republic of China
First published on 17th August 2017
Abstract
TiO2 doped tantalum was successfully synthesized via an evaporation-induced self-assembly method (EISA) as a support of IrO2 for a solid polymer electrolyte water electrolyzer (SPEWE). The IrO2 was synthesized on the surface of Ta-doped TiO2 support by using the Adams fusion method. The samples were characterized by BET, XRD, SEM, TEM, CV, EIS and polarization curves of single cells. The doping amount of Tantalum (5, 10, 20, 30 at%) was thoroughly investigated to evaluate the effects on structure, electric conductivity and oxygen evolution reaction (OER) activity of Ta-doped titania supported IrO2. The results indicated that a significant effect of the Ta dopant on the phase composition and conductivity. Among all the catalysts, with the optimized catalyst IrO2 loading, the terminal applied potential was 1.849 V at 1000 mA cm−2 and 80 °C in a SPE water electrolysis cell using 80IrO2/Ti0.7Ta0.3O2 as anode. IrO2 loading 80% IrO2/Ti0.7Ta0.3O2 showed better performance than that of the pristine IrO2 after normalizing the current density for IrO2 loading. The increased performance can be attributed to the better dispersion of the IrO2 on Ti0.7Ta0.3O2 resulting in smaller crystallites and large surface area. In closing, Ti0.7Ta0.3O2 showed outstanding promise as an electrocatalyst support in SPE water electrolysis.
1. Introduction
Hydrogen is a clean, efficient and extensive source energy, and is considered to be an ideal energy carrier in the future. As far as we know, there are many methods to produce hydrogen.1 The solid polymer electrolyte water electrolyzer (SPEWE) technology, which provides several advantages over traditional technologies including higher energy efficiency, environmental friendliness, higher production rates, higher purity, better safety and more compact design, will play a more and more important role in the water electrolysis industry.2 The efficiency of the SPEWE is mainly determined by the electrochemical processes at the anode. Among all oxygen evolution reaction (OER) catalysts, IrO2 is considered to be the most suitable for the anode of the SPEWE due to its high OER activity, as well as its considerable stability upon exposure to an acidic polymer electrolyte under a high anode potential,3 though the cost and scarcity of iridium limits the expansion of SPEWE applications. The addition of a support (such as TiO2 and SnO2) not only promotes the dispersion of the nanoparticles but also efficiently removes adsorbed hydroxyl species and releases more active reaction sites of IrO2.4–7 Titanium oxide-based materials have garnered special attention because of their excellent corrosion resistance in various electrolyte media.8,9 The high corrosion resistance and electrochemical stability demonstrated by titanium oxides even at low pH has encouraged studies of these materials in fuel cells.10 Titania has the added advantage of being cost-effective, nontoxic, and readily available. However, because of the low electron conductivity of TiO2, IrO2 supported on bare TiO2 electrocatalyst is deemed unsuitable.Doping titania with metals such as Nb, Ta and W can increase its electron conductivity, and several such doped titania materials, such as Nb0.2Ti0.9O2, and Ti0.7W0.3O2 have been previously evaluated for electrochemical stability.11–13 Tantalum-modified TiO2 has previously been used as a thick film gas sensor, nanowires for solar cells, and for varistor applications and possesses electrical conductivities of as high as 103 S cm−1 when synthesized as an epitaxial thin film.14–16
In this study, IrO2 supported on tantalum-doped TiO2 as catalyst for SPEWE was interrogated, the structure, morphology, and electrocatalytic activity for OER of the supports and supported catalysts were determined, and single cells based on these catalysts were tested. The role of such interactions in enhancing catalytic activity was investigated.
2. Materials and methods
For catalyst preparation and characterization, the following chemicals and equipments were used as received: tetrabutyl titanate (Ti(C4H9O)4, Sinopharm, Shanghai, China), ethanol (Sinopharm, Shanghai, China), tantalum (Ta) ethoxide (C10H25O5Ta, Alfa Aesar, Heysham, Lancashire, UK), hexadecyl trimethylammonium bromide (CTAB, Sinopharm, Shanghai, China), hydrochloric acid (HCl, Sinopharm, Shanghai, China), chloroiridic acid (H2IrCl6·6H2O, Ir content is 35%, Hesen, Shanghai, China), isopropyl alcohol (Sinopharm, Shanghai, China), sodium nitrate (NaNO3, Sinopharm, Shanghai, China), H2SO4 (0.5 M, Sinopharm, Shanghai, China), methanol/Nafion (50![[thin space (1/6-em)]](https://www.rsc.org/images/entities/char_2009.gif) :
:![[thin space (1/6-em)]](https://www.rsc.org/images/entities/char_2009.gif) 1 wt%, DuPont, Wilmington, Delaware, USA), Nafion 117 (DuPont, Wilmington, Delaware, USA), H2O2 solution (Sinopharm, Shanghai, China), 40 wt% Pt/C (Johnson Matthey, London, UK) catalyst, Nafion solution (5 wt%, DuPont, Wilmington, Delaware, USA), muffle furnace (SX-2-8-10, Grand Yield, Shanghai, China), planetary ball mill (QM-1SP04, Nanjing, China), tube furnace (HTL1400-40, Hao Yue, Shanghai), glassy carbon disk electrode (GCE, 5.6 mm diameter), electrochemical workstation (Model 760, CH Instruments, Austin, Texas, USA), Motech LPS305 programmatic DC power supply (Motech, Tainan, Taiwan, China), Solartron Analytical 1260 impedance analyzer and Solartron Analytical 1287 potentiostat (Solartron Analytical, Farnborough, Hampshire, UK).
1 wt%, DuPont, Wilmington, Delaware, USA), Nafion 117 (DuPont, Wilmington, Delaware, USA), H2O2 solution (Sinopharm, Shanghai, China), 40 wt% Pt/C (Johnson Matthey, London, UK) catalyst, Nafion solution (5 wt%, DuPont, Wilmington, Delaware, USA), muffle furnace (SX-2-8-10, Grand Yield, Shanghai, China), planetary ball mill (QM-1SP04, Nanjing, China), tube furnace (HTL1400-40, Hao Yue, Shanghai), glassy carbon disk electrode (GCE, 5.6 mm diameter), electrochemical workstation (Model 760, CH Instruments, Austin, Texas, USA), Motech LPS305 programmatic DC power supply (Motech, Tainan, Taiwan, China), Solartron Analytical 1260 impedance analyzer and Solartron Analytical 1287 potentiostat (Solartron Analytical, Farnborough, Hampshire, UK).
2.1 Preparation of materials
Firstly, Ta-doped TiO2 were prepared by an evaporation-induced self-assembly method (EISA), which was effective for the synthesis of mesoporous niobium-doped TiO2 with a high specific surface area11 and denoted as Ti1−xTaxO2, where x (0.05, 0.1, 0.2, 0.3) accorded with the molar percent content of Ta. Then, the resultant powder was annealed under a strong reducing atmosphere. Finally, the Adams fusion method was adopted due to its high feasibility and reproducibility for supported IrO2 synthesis.11![[thin space (1/6-em)]](https://www.rsc.org/images/entities/char_2009.gif) :
:![[thin space (1/6-em)]](https://www.rsc.org/images/entities/char_2009.gif) HCl
HCl![[thin space (1/6-em)]](https://www.rsc.org/images/entities/char_2009.gif) :
:![[thin space (1/6-em)]](https://www.rsc.org/images/entities/char_2009.gif) H2O
H2O![[thin space (1/6-em)]](https://www.rsc.org/images/entities/char_2009.gif) :
:![[thin space (1/6-em)]](https://www.rsc.org/images/entities/char_2009.gif) CTAB
CTAB![[thin space (1/6-em)]](https://www.rsc.org/images/entities/char_2009.gif) :
:![[thin space (1/6-em)]](https://www.rsc.org/images/entities/char_2009.gif) ethanol = 2.49
ethanol = 2.49![[thin space (1/6-em)]](https://www.rsc.org/images/entities/char_2009.gif) :
:![[thin space (1/6-em)]](https://www.rsc.org/images/entities/char_2009.gif) 2.55
2.55![[thin space (1/6-em)]](https://www.rsc.org/images/entities/char_2009.gif) :
:![[thin space (1/6-em)]](https://www.rsc.org/images/entities/char_2009.gif) 32.28
32.28![[thin space (1/6-em)]](https://www.rsc.org/images/entities/char_2009.gif) :
:![[thin space (1/6-em)]](https://www.rsc.org/images/entities/char_2009.gif) 0.37
0.37![[thin space (1/6-em)]](https://www.rsc.org/images/entities/char_2009.gif) :
:![[thin space (1/6-em)]](https://www.rsc.org/images/entities/char_2009.gif) 62.31. We applied rotary evaporation at 60 °C and room pressure for 24 h to accelerate the formation of the mesostructure, disregarding the pore ordering. The obtained semitransparent gel was transferred to a muffle furnace and calcined at 100 °C for 2 h and then at 200 °C for 4 h with the 1 °C min−1 heating rate to condense the colloidal Ti-based particles into a firm mesoporous matrix. Then, the powder was grinding-balled using planetary ball mill with a rotation speed of 200 rpm for 4 h at room temperature. The grinding-ball powder was followed by final calcination at 350 °C for 4 h under air atmosphere for the complete removal of the surfactant. Ta-doped TiO2 powders were obtained after cooling down.
62.31. We applied rotary evaporation at 60 °C and room pressure for 24 h to accelerate the formation of the mesostructure, disregarding the pore ordering. The obtained semitransparent gel was transferred to a muffle furnace and calcined at 100 °C for 2 h and then at 200 °C for 4 h with the 1 °C min−1 heating rate to condense the colloidal Ti-based particles into a firm mesoporous matrix. Then, the powder was grinding-balled using planetary ball mill with a rotation speed of 200 rpm for 4 h at room temperature. The grinding-ball powder was followed by final calcination at 350 °C for 4 h under air atmosphere for the complete removal of the surfactant. Ta-doped TiO2 powders were obtained after cooling down.The resultant Ti1−xTaxO2 powder was annealed at 500 °C in a tube furnace under a reducing atmosphere of 4% H2 in argon for 1 h using a heating rate of 5 °C min−1.
2.2 Physical characterization
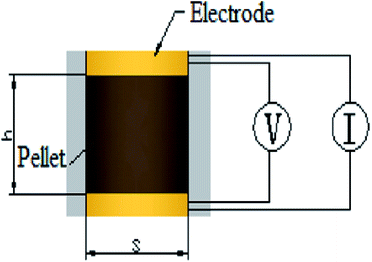
The samples were characterized by X-ray diffraction (XRD) to know the phase, the XRD patterns were collected using a Bruker D8 Advance X-ray diffractometer (Bruker, Karlsruhe, Germany) with a Cu Kα radiation source (λ = 0.154056 nm). The specific surface area and pore size distribution of the supports were measured by the N2 absorption/desorption technique using a Micromeritics ASAP 2020 system (Micromeritics, Norcross, Georgia, USA) and calculated by the Brunauer–Emmett–Teller (BET). Scanning electron microscope (SEM) observations were observed on a FEISIRION200 (FEI, Hillsboro, Oregon, America) to know the morphology and the thickness of catalysts on MEA. Transmission electron microscopy (TEM) equipped with an energy-dispersive spectrometer (EDS) analyzer were observed on a JEOL 2010F microscope (JEOL, Tokyo, Japan) to elucidate the dispersion of IrO2 on the supports and elements content. Notice that As-prepared catalysts were held on carbon-coated copper grids as sample table after ultrasonic dispersion in ethanol. X-ray photoelectron spectroscopy (XPS) measurements were carried out on PHI 5000C ESCA System instrument (Petroleum Helicopters Inc) to know the chemical state using a monochromatic Al Kα X-ray source with 14.0 kV and 250 W. The electronic combination was corrected with carbon pollution (C 1s = 284.6 eV), and curve fitting was carried out using Gaussian–Lorentzian type profiles (CasaXPS 2.3).Electrical conductivity measurements were carried out on cylindrical pellets compressed from the powder samples at 3 MPa between two copper electrodes, as shown in the schematic diagram in Fig. 1. The basal area of the cylindrical pellet was restricted by the fixture to 1 cm2, and the thickness was measured by a vernier caliper fastened on the fixture. The resistivity was directly measured by a JG-ST2258A resistivity tester (Jingge Electronic, Suzhou, Jiangsu, China) by inputting the thickness-area ratio as a parameter, followed by conversion to conductivity.
2.3 Electrochemical characterization
For the electrochemical evaluation of the as-prepared catalysts in the half-cell, catalyst powder was suspended in methanol/Nafion solution, 1 mL of mixture containing of 5 mg of catalyst methanol and Nafions solution (5 wt%, DuPont) was homogenized for 1 hour in an ultrasonic bath. The homogeneous ink (10 μL) was then drop-cast on the prepolished GCE (5.6 mm in diameter) surface and dried in air. The catalyst loading was about 0.2 mg cm−2. The electrochemical OER activity of the IrO2 and 40IrO2/Ti1−xTaxO2-2 was measured in a three-electrode system in 0.5 M H2SO4 electrolyte at 25 °C. The solution was bubbled with N2 for 30 min prior to the experiments until the measurements ended. A silver chloride electrode was used as the reference electrode, and a platinum wire was used as the counter electrode. The CV was measured at a scan rate of 50 mV s−1 between −0.17 and 1.18 V vs. Ag/AgCl. All the electrochemical characterization were measured with a Model 760 electrochemical workstation.2.4 SPE water electrolysis cell testing
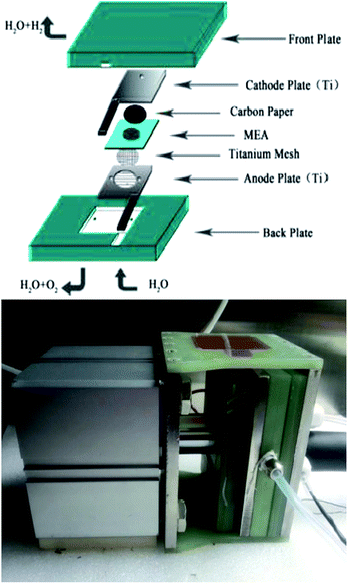
A Nafion 117 membrane was used as the proton exchange membrane after being sequentially boiled in a 3 wt% H2O2 solution, distilled water, and a 5 wt% H2SO4 solution for 1 h each as a pretreatment. A commercial 40 wt% Pt/C catalyst was adopted as the cathodic electrocatalyst and the as-prepared catalysts were used as anodic electrocatalysts, and. The anodic and cathodic catalysts were directly deposited onto one and the other side of the Nafion 117 membrane, respectively, by a spray coating technique to prepare the membrane electrode assemblies (MEA). The homogeneous solutions were sonicated from mixtures of catalysts, isopropyl alcohol, 5 wt% Nafion solution, and deionized water. For each MEA, the Nafion loading in the catalyst layer was 25 wt% for both sides, the anode and cathode catalyst loadings were 2.5 mg cm−2 and 0.5 mg cm−2 Pt respectively. After being sandwiched by a Ti mesh and carbon paper (current collecting layers) over the anode and cathode respectively, the MEA was clamped between Ti flow field plates for assembly into a single-cell electrolyzer, as shown in the schematic diagram in Fig. 2. The single cell (with an effective area of 3.645 cm2) performance was evaluated at 80 °C under 0.8 MPa. Deionized water was preheated to 80 °C and supplied to the anode compartment by a pump at a flow rate of 40 mL min−1. The single cell was charged by a Motech LPS305 programmatic DC power supply for the polarization curve measurement. The EIS for the single cell was measured at 100 mA cm−2 via a two-electrode method, with the anode being tested as the working electrode and the cathode as the counter and reference electrodes. It was carried out with Solartron 1287 Electrochemical Interface in conjunction with Solartron 1260 Frequency Response Analyzer.3. Results and discussion
3.1 Structural analysis of the supports and supported catalysts
Fig. 3 showed the XRD patterns of Ti1−xTaxO2 after removing the template agent (a) and Ti1−xTaxO2 annealed under a reducing atmosphere (b). From the patterns of Ti1−xTaxO2 calcined under air atmosphere in Fig. 3(a), the typical peaks at approximately 25° and 48° can be easily recognized as the anatase lattice planes (101) and (200), whereas the peaks at approximately 27°, 36° and 41° represent the (110), (101) and (111) planes of rutile respectively. Apart from these TiO2 phases, no compound with Ta was detected at any Ta content, verifying that the Ta was totally doped into the TiO2 lattice and formed a solid solution.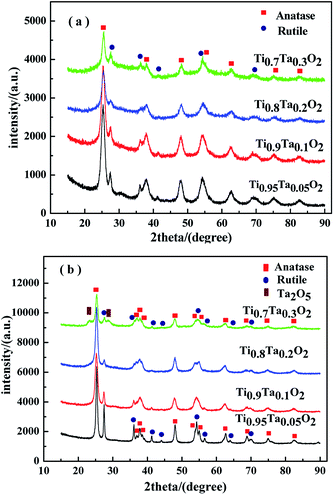 | ||
| Fig. 3 XRD patterns of the supports. (a) Calcined under air atmosphere; (b) annealed under a reducing atmosphere. | ||
The phase transformation from anatase to rutile took place after anneal under a reducing atmosphere in Fig. 3(b), which was indicated by the obvious the diffraction peak intensity enhancement of rutile. The peak of Ta2O5 was detected at 23.2° in the Ti0.7Ta0.3O2 sample because of the solid solubility decrease in high temperature under a reducing atmosphere, which indicated trace Ta2O5 was precipitated from the crystal lattice.
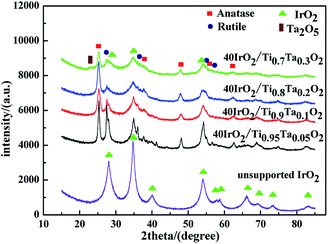
Fig. 4 showed the XRD patterns of unsupported IrO2 and 40IrO2/Ti1−xTaxO2. After loading IrO2, 40IrO2/Ti1−xTaxO2 showed slightly broader diffraction peaks. Because the smaller grain size of IrO2 having wider diffraction peak superimposed with the diffraction peaks of supports. Compounds containing Ir, Ti and Ta did not appeared, which prove IrO2, TiO2 and Ta2O5 had better thermal chemical compatibility.
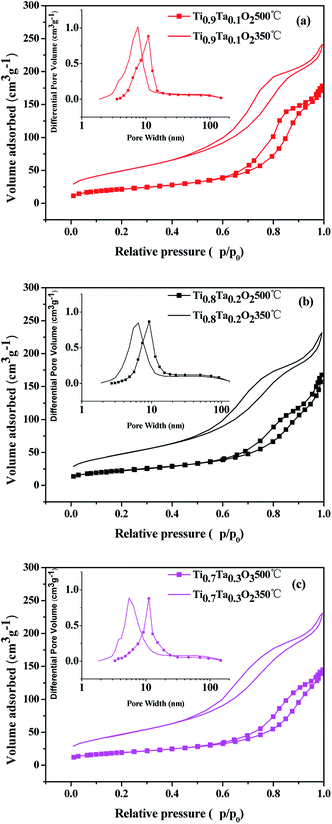
The N2 adsorption isotherms and pore size distributions of the titania supports are shown in Fig. 5, and the BET surface areas calculated via the BET methods from the nitrogen adsorption isotherms are listed in Table 1. It was obvious that highly porous titania supports had been successfully prepared by EISA method. Type IV adsorption isotherms with hysteresis loops at high relative pressure were found for all titania samples, which indicated the pores mainly consist of voids between non-ordered grains. The influence from different Ta amount is remarkable. Once the Ta is introduced to the titania lattice within the solubility, the BET surface area increases from 164 m2 g−1 for Ti0.95Ta0.05O2 to 178 and 182 m2 g−1 for Ti0.8Ta0.2O2 and Ti0.7Ta0.3O2 respectively. However the Ta content reached 10 at%, the Ta-doped TiO2 support possessed the highest BET surface area. In terms of pore size distributions, all samples calcined under air atmosphere at 350 °C showed the most probable pore sizes ranged within 6.8 to 7.9 nm. The pore sizes enlarged to 11.4–13 nm after annealed under a reducing atmosphere at 500 °C. Thus it showed that when the temperature increased, the pore size obviously increased while the BET surface area declined accordingly. That's because the mesoporous structure of samples had been damaged due to 500 °C heat treatment in H2/Ar.
| Sample (350 °C Air) | Ti0.95Ta0.05O2 | Ti0.9Ta0.1O2 | Ti0.8Ta0.2O2 | Ti0.7Ta0.3O2 |
|---|---|---|---|---|
| BET (m2 g−1) | 164 | 198 | 178 | 182 |
| D (nm) | 7.9 | 7.6 | 7.3 | 6.8 |
| Sample (500 °C H2/Ar) | Ti0.95Ta0.05O2 | Ti0.9Ta0.1O2 | Ti0.8Ta0.2O2 | Ti0.7Ta0.3O2 |
|---|---|---|---|---|
| BET (m2 g−1) | 77 | 98 | 82 | 85 |
| D (nm) | 13 | 12.7 | 11.7 | 11.4 |
Fig. 6 showed the morphologies about IrO2, 40IrO2/Ti0.95Ta0.05O2, 40IrO2/Ti0.9Ta0.1O2 and 40IrO2/Ti0.7Ta0.3O2. The crystal lattice stripe of doped TiO2 support was clearly visible which indicated crystallinity was very high and mutual verification with XRD. The Ta doped titania supports maintained a highly porous morphology such as Fig. 6(c), which was characterized by light gray grains of diameter approximately 10–15 nm and white piled pores among the particles. As could be seen from Fig. 6(b–d), tiny equiaxed IrO2 nanocrystals as darker dots cling to the outer surface of the Ta-doped titania in much better dispersion in comparison with unsupported IrO2. Furthermore, the grain size of supported IrO2 was approximately 3 nm and the grain size of unsupported IrO2 was 4.3 nm. The grain size of supported IrO2 was much smaller than unsupported IrO2, which was attributed to effect of Ta-doped titania. The mesoporous support provided more nucleation sites for crystallization process of IrO2, promoting heterogeneous nucleation which prompted IrO2 forming fine grain.
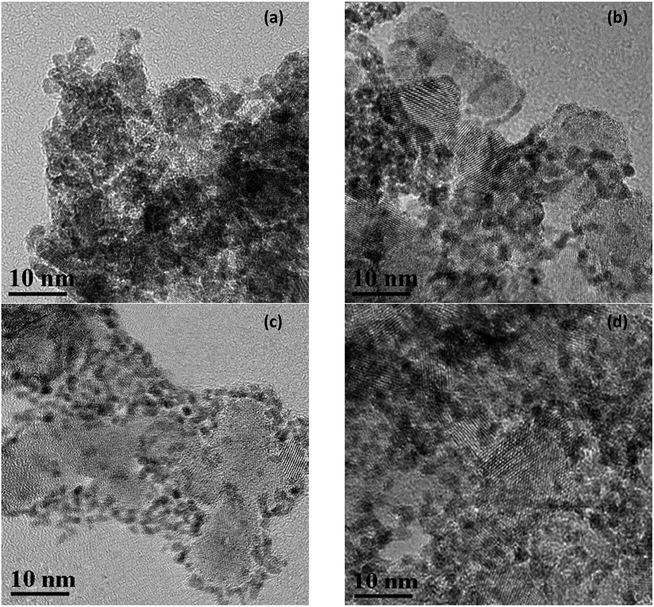 | ||
| Fig. 6 TEM images of unsupported IrO2 (a) 40IrO2/Ti0.95Ta0.05O2 (b) 40IrO2/Ti0.9Ta0.1O2 (c) and 40IrO2/Ti0.7Ta0.3O2 (d). | ||
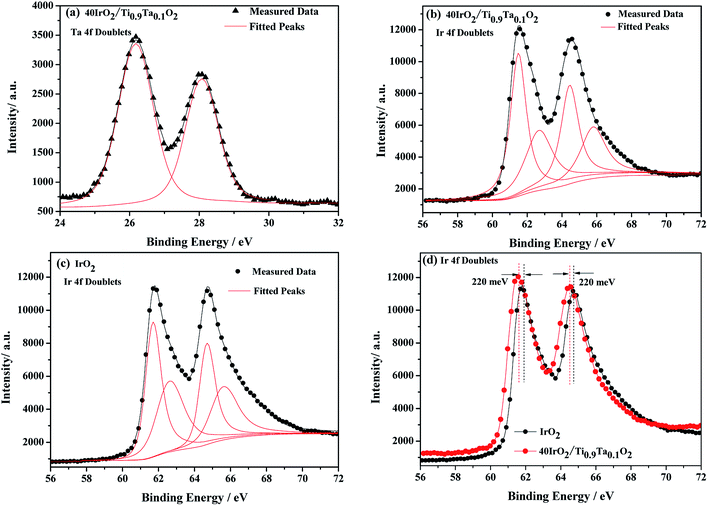
XPS is a widely used method in the field of catalysis, as it examines the elemental composition, chemical state and electronic state. For the 40IrO2/Ti0.9Ta0.1O2 catalyst, the high resolution XPS of Ta 4f spectrum in Fig. 7(a) showed typical peaks at 26.2 eV and 28.1 eV related to 4f7/2 and 4f5/2, as well as the fitting peaks calculated by the method of deconvolution. The spectrum of Ti0.9Ta0.1O2 showed only one pair of Ta 4f doublets with binding energies that suggested single valence states as Ta (+5). This result corresponded with the conclusion researched by Wang17 and Hur.18 So the replacement of Ti4+ ions (radius 60.5 pm) by the slightly larger Ta5+ ions (radius 64 pm) caused a slight lattice expansion of the TiO2 crystallite. Considering the oxygen states of tantalum and titanium, it can be simply understood that the dominant lattice defects in the Ta-doped TiO2 should not be the oxygen vacancies, but interstitial oxygen, Oi, which was formed through a defect reaction by the following eqn (1.1):
 | (1.1) |
The results of the powder conductivity measurements were listed in Table 2. As shown in the table, the conductivities of the Ta-doped titania were much higher than that of the pristine titania, and they gradually rose with the Ta amount, indicating a significant effect of the Ta dopant on the improvement of the titania conductivity. That's because the charger carrier increased with increment of Ta-dopant by the defect reaction. The electrical conductivity of Ti0.7Ta0.3O2 could achieved 9.66 × 10⁻² S cm−1. This recommended support conductivity value of 0.1 S cm−1 and is deemed adequate to prepare acceptable porous electrodes.20 The result showed that the conductivity of our sample was lower than the same support conductivity on 0.2 S cm−1 synthesized by Kumar et al.23 The difference of conductivity was due to BET surface area of support, to be specific, the higher BET surface area that affected the contact of particles could lead to lower conductivity. The BET surface area of was 85 m2 g−1 for our sample while 26 m2 g−1 for Kumar's sample, which is more suitable to be an electrocatalyst support.
| Samples | Conductivity (S cm−1) |
|---|---|
| TiO2 | 4.42 × 10⁻⁶ |
| Ti0.95Ta0.05O2 | 2.63 × 10⁻⁴ |
| Ti0.9Ta0.1O2 | 7.12 × 10⁻⁴ |
| Ti0.8Ta0.2O2 | 3.21 × 10⁻³ |
| Ti0.7Ta0.3O2 | 9.66 × 10⁻² |
3.2 Electrochemical activity of the supported catalysts
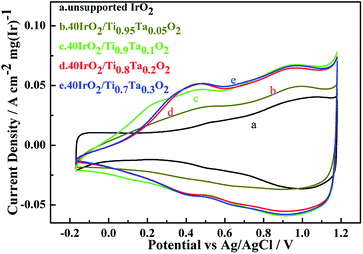
Cyclic voltammetry measurements of unsupported IrO2 and 40IrO2/Ti1−xTaxO2, were taken to determine how the amount of surface active sites varied with the increase in Ta doping. Fig. 8 showed the catalyst voltammograms obtained in N2-saturated 0.5 M H2SO4 at a sweep rate of 50 mV s−1. The data of the current density in this figure were normalized to the IrO2 loading.As in the oxygen region, the Ir-based catalysts caused the adsorption–desorption of OH− groups and carry out further redox, such as the Ir(III)/Ir(IV) and Ir(IV)/Ir(VI) transition at approximately 0.42 vs. Ag/AgCl and 0.95 vs. Ag/AgCl, respectively. For unsupported IrO2, it did not show an obvious voltammetric charge in 0.42 vs. Ag/AgCl and had a weak voltammetric charge in 0.95 vs. Ag/AgCl, which indicating that unsupported IrO2 has a lower surface active sites.
The voltammetric charge can be considered an estimate of the number of surface active sites, however, it would not be easy to work out the exact electrochemical surface area (ECSA) of IrO2 like that of nano-Pt due to the uncertainty in distinguishing the pseudocapacitance and verifying the state of the adsorbed OH groups on the catalyst surface, at the same time, it did not happen the clearly under potential deposition (UPD) and desorption of H. Hence, in this work, the charges from −0.17 to 1.18 vs. RHE were calculated for the qualitative comparison of the numbers of active sites. The voltammetric charges of catalyst as a function of scan rates, which was calculated by the following eqn (1.2):21
 | (1.2) |
The results showed in Table 3 as a sequence of 40IrO2/Ti0.9Ta0.1O2 (1118 mC (cm2 mg)−1) > 40IrO2/Ti0.7Ta0.3O2 (1076 mC (cm2 mg)−1) > 40IrO2/Ti0.8Ta0.2O2 (1045 mC (cm2 mg)−1) > 40IrO2/Ti0.95Ta0.05O2 (745 mC (cm2 mg)−1) > IrO2 (575 mC (cm2 mg)−1). Thus it demonstrated that the higher electrochemical performance with Ti1−xTaxO2 support was achieved than unsupport IrO2. The results could be understood by considering the following.
| Samples | Voltammetric charge (Q)/mC (cm2 mg)−1 |
|---|---|
| Unsupported IrO2 | 575 |
| 40I–Ti0.95Ta0.05O2 | 754 |
| 40I–Ti0.9Ta0.1O2 | 1118 |
| 40I–Ti0.8Ta0.2O2 | 1045 |
| 40I–Ti0.7Ta0.3O2 | 1076 |
Firstly, IrO2 undergone crystalline refinement and dispersion optimization when supported by the Ta-doped titania, leading to a significant augmentation of the electrochemical active area of the IrO2 particles. Secondly, among the IrO2 and all the supported catalysts, more information could be figured out by deconvolution of the Ir 4f doublets. The Ir 4f lines of these samples could be fitted with three pairs of peaks with the same line-shape functions, standing for Ir in the valence states of +3, +4 and +6 respectively (Fig. 7). During catalysis of OER, the alternation between Ir(III) and Ir(IV) plays an important role in the oxidation of the hydroxyl, while Ir(VI) is easy to get corroded according to a reaction (eqn (1.3)) as follows.22
| IrO2 + H2O → IrO42− + 2H+ | (1.3) |
Therefore the Ir(VI) proportion will give an approximate estimation of catalyst durability. According to proportions of Ir in different valence states out of deconvolution of Ir 4f doublets, unsupported IrO2 contains as much as 19% Ir(VI). While being supported by titania, Ir(VI) content has been significantly reduced the proportion of Ir(VI) down to 10.7% in 40IrO2/Ti0.9Ta0.1O2. This could be an indication that the titania support play a considerable role in constraining the generation of unstable Ir oxide during Adams fusion, and Ta doping might further improve the durability of the supported catalyst.
Furthermore, the 220 meV deviation of IrO2 bind energy peak means strong metal support interactions as confirmed from XPS results in Fig. 7(d). There have been several reports on the unique ability of TiO2 and doped TiO2 supports to alter the electronic structure of supported noble metals (such as platinum). This phenomenon has been classified under “strong metal-support interactions” (SMSI) and has been shown to enhance both chemical stability and oxygen reduction reaction (ORR) activity.23–26 This interaction between doped TiO2 supports and IrO2 is likely to occur and shows to enhance both chemical stability and oxygen evolution reaction (OER) activity, which will be confirmed with evidence in a later research.
Table 3 also showed that the voltammetric charge increased with increment of Ta-dopant, it was the highest (1118 mC (cm2 mg)−1) under the condition of 10 at% Ta dopant. However, the gap of voltammetric charge was slight. Because of similarly mesoporous structure and BET surface area about the 40IrO2/Ti1−xTaxO2 support within the range of 0.1–0.3, and similarly grain size distribution of IrO2 on support surface. When the Ta content reached 10 at%, the Ta-doped TiO2 support possessed the highest specific surface. So this result was very much in line with voltammetric charge apropos, which demonstrates the importance of the BET surface area for surface active sites. Although the electrical conductivities of Ti0.9Ta0.1O2 was lower than those of Ti0.8Ta0.2O2 and Ti0.7Ta0.3O2, the voltammetric charge of Ti0.9Ta0.1O2 was higher, which is because the coatings on the disk electrode is so thin that the electrical conductivity was not the leading factor in the CV testing process.
3.3 Behavior in the electrolysis cell
The polarization curves of single cells equipped with 40IrO2/Ti1−xTaxO2 and unsupported IrO2 at 80 °C were shown in Fig. 9 with magnified curves at 10–60 mA cm−2 shown in the inset. At the low current density of 10–60 mA cm−2 where ohmic resistance and bubble effect does not significantly influence, the MEA performance is used to compare the activity of the anode catalyst. The cathode performance can be considered as equal for all the MEA especially at low current density due to the faster kinetics of HER on Pt electrode. The potential of 40IrO2/Ti0.9Ta0.1O2 showed the lowest, followed by 40IrO2/Ti0.7Ta0.3O2, 40IrO2/Ti0.8Ta0.2O2, 40IrO2/Ti0.95Ta0.05O2 and unsupported IrO2, which was very much in line with the results of the cyclic voltammetry sections. At large current densities over 100 mA cm−2, the ohmic loss dominates in the whole cell potential, as reflected by the linear increase of potential versus current, the unsupported IrO2 possessed the lowest ohmic loss, as shown by the smallest slope of the polarization curve, which made it require the lowest cell potential (1.923 V) to electrolyze water at 1000 mA cm−2. The cell potentials at 1000 mA cm−2 were the comprehensive results of the overpotentials on active sites, species transfer and ohmic loss, exhibiting a sequence of 40IrO2/Ti0.95Ta0.05O2 (2.126 V) > 40IrO2/Ti0.8Ta0.2O2 (2.075 V) > 40IrO2/Ti0.9Ta0.1O2 (2.003 V) > 40IrO2/Ti0.7Ta0.3O2 (1.945 V) > unsupported IrO2(1.923 V).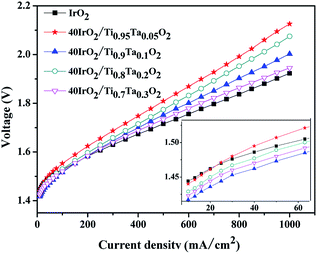 | ||
| Fig. 9 The polarization curves of single cells equipped with unsupported IrO2 and 40IrO2/Ti1−xTaxO2 at 80 °C. | ||
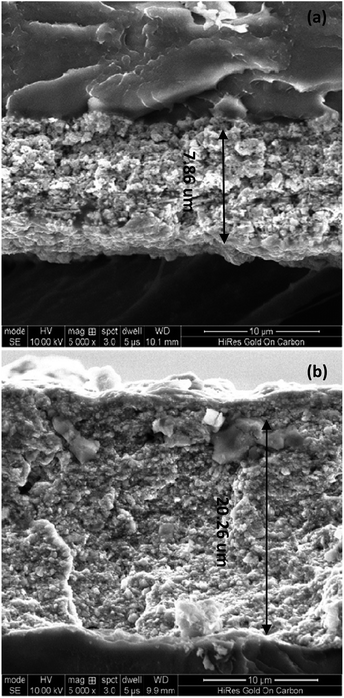
Fig. 10 showed the cross section of MEA about unsupported IrO2 and 40IrO2/Ti1−xTaxO2. The thickness of 40IrO2/Ti1−xTaxO2 was 20.26 μm and unsupported IrO2 was 7.86 μm, which was due to the additional volume from the porous TiO2. The thickness of anode catalyst layer effected on the mass and charge transfer. Especially, when the electrolysis cell was operated under high current density (such as 1000 mA cm2), a lot of bubbles was generated at the anode side. The thicker anode catalyst layer would lead to the water/gas transfer more difficult. So the performance of cell of unsupported IrO2 was superior to 40IrO2/Ti1−xTaxO2 under the high current density.
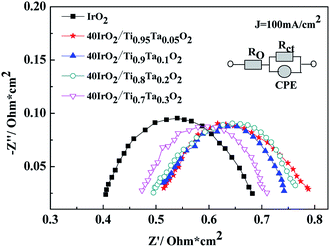
EIS curves for unsupported IrO2 and 40IrO2/Ti1−xTaxO2 at 100 mA cm−2 were shown in Fig. 11. RΩ was the whole ohmic resistance of SPE water electrolyzer including Nafion 117 membrane, catalyst layer, bipolar plate, Ti mesh, carbon paper and wire. The difference of RΩ was from the anode catalyst layer because the other conditions were much the same. Rct was the charge transfer resistance between solution interface and catalyst. CPE was used in order to explain the deviation from the ideal capacitor behavior. The possible reasons for a non-ideal behavior can be due to surface roughness, inhomogeneous reaction rates on the surface.
The data are interpreted by numerically fitting with electrical equivalent circuits depicted in picture. It is easily observed that the single cell containing unsupported IrO2 possessed the lowest ohmic resistance, followed by 40IrO2/Ti0.7Ta0.3O2, 40IrO2/Ti0.8Ta0.2O2, 40IrO2/Ti0.9Ta0.1O2 and 40IrO2/Ti0.95Ta0.05O2 in sequence, which matched with electric conductivity of Ti1−xTaxO2.
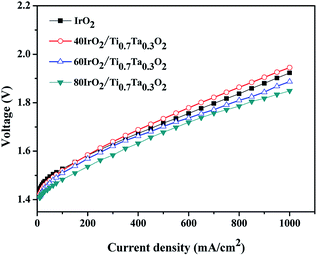
With the optimized catalyst IrO2 loading, MEAs prepared with IrO2–Ti0.7Ta0.3O2 with various IrO2 loading at 80 °C are compared in Fig. 12. The 80IrO2/Ti0.7Ta0.3O2 and 60IrO2/Ti0.7Ta0.3O2 showed better performance than pristine IrO2. The MEA performance decreased with a decrease in the IrO2 loading. The cell potential increased from 1.849 V, 1.887, 1.945 V at 1000 mA cm−2 for 80IrO2/Ti0.7Ta0.3O2, 60IrO2/Ti0.7Ta0.3O2 and 40IrO2/Ti0.7Ta0.3O2 respectively. This might be due to better dispersion of the active IrO2 catalyst on the Ti0.7Ta0.3O2 support covering its surface for IrO2 loading >60 wt%. It was clear that the catalyst conductivity and IrO2 particle size have significant influence in the performance of the MEA. The low performance for 40IrO2/Ti0.7Ta0.3O2 may be attributed to its lower IrO2 content (thus lower available active sites) and lower electrical conductivity.
4. Conclusions
Ta doped TiO2 supports were successfully synthesized, characterized and evaluated in an electrochemical environment. Three different samples of Ti1−xTaxO2 (x = 0.1, 0.2 and 0.3) were prepared and XRD confirmed that Ta was completely incorporated within the TiO2 lattice and trace Ta2O5 was precipitated from the crystal lattice of Ti0.7Ta0.3O2 sample annealed under a reducing atmosphere. Ti0.7Ta0.3O2 was found to have adequate electron conductivity (0.0966 S cm−1) and sufficient BET surface area (85 m2 g−1). Among all the Ta-doped TiO2 supports, the 40IrO2/Ti0.7Ta0.3O2 on SPE electrolysis showed the best performance because of the lowest ohmic resistance and charge transfer resistance. With the optimized catalyst IrO2 loading, the terminal applied potential was 1.849 V at 1000 mA cm−2 and 80 °C in a SPE water electrolysis cell using 80IrO2/Ti0.7Ta0.3O2 as anode. In closing, Ti0.7Ta0.3O2 showed outstanding promise as an electrocatalyst support in SPE water electrolysis.Conflicts of interest
There are no conflicts to declare.Acknowledgements
This work is financially supported by the National Natural Science Foundation of China (Grant No. 21306141).Notes and references
- E. Troncoso and M. Newborough, Int. J. Hydrogen Energy, 2011, 36, 120–134 CrossRef CAS.
- P. W. T. LUt and S. Srinivasan, J. Appl. Electrochem., 1979, 9, 269–283 CrossRef.
- S. Siracusano, V. Baglio, A. Stassi, R. Ornelas, V. Antonucci and A. S. Aricò, Int. J. Hydrogen Energy, 2011, 36, 7822–7831 CrossRef CAS.
- J. Xu, G. Liu, J. Li and X. Wang, Electrochim. Acta, 2012, 59, 105–112 CrossRef CAS.
- H. Song, X. Qiu and F. Li, Appl. Catal., A, 2009, 364, 1–7 CrossRef CAS.
- P. Mazúr, J. Polonský, M. Paidar and K. Bouzek, Int. J. Hydrogen Energy, 2012, 37, 12081–12088 CrossRef.
- P. G. Sheng-Yang Huang, S. Park and B. N. Popov, J. Am. Chem. Soc., 2009, 131, 13898–13899 CrossRef PubMed.
- C.-P. Lo, G. Wang, A. Kumar and V. Ramani, Appl. Catal., B, 2013, 140–141, 133–140 CrossRef CAS.
- S.-Y. Huang, P. Ganesan and B. N. Popov, Appl. Catal., B, 2010, 96, 224–231 CrossRef CAS.
- T. Ioroi, T. Akita, S.-i. Yamazaki, Z. Siroma, N. Fujiwara and K. Yasuda, J. Electrochem. Soc., 2011, 158, C329 CrossRef CAS.
- C. Hao, H. Lv, C. Mi, Y. Song and J. Ma, ACS Sustainable Chem. Eng., 2016, 4, 746–756 CrossRef CAS.
- C. V. Subban, Q. Zhou, A. Hu, T. E. Moylan, F. T. Wagner and F. J. Disalvo, J. Am. Chem. Soc., 2010, 132, 17531–17536 CrossRef CAS PubMed.
- A. Kumar and V. Ramani, J. Am. Chem. Soc., 2013, 160, F1207–F1215 CAS.
- E. Traversa, M. L. D. Vona, S. Licoccia, M. Sacerdoti, M. C. Carotta, M. Gallana and G. Martinelli, J. Sol-Gel Sci. Technol., 2000, 19, 193–196 CrossRef CAS.
- X. Feng, K. Shankar, M. Paulose and C. A. Grimes, Angew. Chem., 2009, 48, 8095–8098 CrossRef CAS PubMed.
- A. B. Gaikwad, S. C. Navale and V. Ravi, Mater. Sci. Eng., B, 2005, 123, 50–52 CrossRef.
- S.-C. Wang, K.-Y. Liu and J.-L. Huang, Thin Solid Films, 2011, 520, 1454–1459 CrossRef CAS.
- J. H. Hur, M.-J. Lee, C. B. Lee, Y.-B. Kim and C.-J. Kim, Phys. Rev. B: Condens. Matter Mater. Phys., 2010, 82, 155321 CrossRef.
- F. A. Kröger and H. J. Vink, Solid State Phys., 1956, 3, 307–435 Search PubMed.
- P. T. Yu, W. Gu, J. Zhang, R. Makharia, F. T. Wagner and H. A. Gasteiger, Polymer Electrolyte Fuel Cell Durability, 2009 Search PubMed.
- G. Li, H. Yu, X. Wang, S. Sun, Y. Li, Z. Shao and B. Yi, Phys. Chem. Chem. Phys., 2013, 15, 2858–2866 RSC.
- J.-B. Park, J.-S. Ham, M.-S. Shin, H.-K. Park, Y.-J. Lee and S.-M. Lee, J. Power Sources, 2015, 299, 537–543 CrossRef CAS.
- A. Kumar and V. Ramani, ACS Catal., 2014, 4, 1516–1525 CrossRef CAS.
- V. T. Thanh Ho, K. C. Pillai, H.-L. Chou, C.-J. Pan, J. Rick, W.-N. Su, B.-J. Hwang, J.-F. Lee, H.-S. Sheu and W.-T. Chuang, Energy Environ. Sci., 2011, 4, 4194–4200 Search PubMed.
- A. Lewera, L. Timperman, A. Roguska and N. Alonso-Vante, J. Phys. Chem. C, 2011, 115, 20153–20159 CAS.
- V. T. Ho, C. J. Pan, J. Rick, W. N. Su and B. J. Hwang, J. Am. Chem. Soc., 2011, 133, 11716–11724 CrossRef CAS PubMed.
| This journal is © The Royal Society of Chemistry 2017 |

