 Open Access Article
Creative Commons Attribution 3.0 Unported Licence
Magnetic solid phase extraction with octahedral structured Fe3O4@SiO2@polydimethylsiloxane magnetic nanoparticles as the sorbent for determining benzene, toluene, ethylbenzene and xylenes in water samples
Maosheng Zhang *a,
Guobin Huanga,
Jiarong Huangb,
Ling Zhonga and
Weilan Chena
aSchool of Chemistry and Environmental, Fujian Province University Key Laboratory of Analytical Science, Minnan Normal University, Zhangzhou 363000, China. E-mail: maoshengzhang@mnnu.edu.cn; Fax: +86-925-2520035; Tel: +86-925-2591445
bDongshan Environmental Protection Bureau, Zhangzhou 363400, China
First published on 29th August 2017
Abstract
Novel octahedral structured Fe3O4@SiO2@polydimethylsiloxane magnetic nanoparticles (Fe3O4@SiO2@PDMS MNPs) have been successfully synthesized for the first time. The magnetic nanoparticles (MNPs) were characterized by scanning electron microscopy, transmission electron microscopy, X-ray diffraction, Fourier transform infrared spectrometry and vibrating sample magnetometry. The Fe3O4@SiO2@PDMS MNPs were used as the sorbent for magnetic solid phase extraction (MSPE) to determine benzene, toluene, ethylbenzene and xylenes (BTEX) in water samples. Extraction parameters, the amount of sorbent, the extraction time, the stirring rate, the salt effect, the type of desorption solvent, the volume of desorption solvent and the desorption time were optimized. The optimal extraction conditions were amount of sorbent, 100 mg; extraction time, 15 min; stirring rate, 200 rpm; no salt; desorption solvent, dichloromethane; volume of desorption solvent, 0.5 mL; and desorption time, 1.0 min. Good linearity was observed in the calibration range from 0.05 to 20 μg L−1, and the coefficient of determination (r2) was more than 0.9980. The limits of detection (LODs) and limits of quantitation (LOQs) for BTEX were observed to be 0.002–0.005 μg L−1 and 0.008–0.017 μg L−1, respectively. The intra- and inter-batch relative standard deviations (RSDs) were less than 11.6% and 15.0%, respectively.
1 Introduction
Benzene, toluene, ethylbenzene and o-, m- and p-xylene (BTEX) are widely used in the chemical industry and its related fields. As we know, these compounds can cause adverse health effects, such as cancer, liver damage and central nervous system disease.1 In response to this problem, the WHO drinking water guidelines has established the permissible levels for BTEX (benzene of 10 μg L−1, toluene of 700 μg L−1, ethylbenzene of 300 μg L−1 and xylenes of 500 μg L−1) in drinking water.2 The normalized quality limit for drinking water according to the EPA is 5 μg L−1 for benzene, 1000 μg L−1 for toluene, 700 μg L−1 for ethylbenzene and 10![[thin space (1/6-em)]](https://www.rsc.org/images/entities/char_2009.gif) 000 μg L−1 for xylenes, respectively.3 Therefore, establishing a sensitive, reliable, convenient and fast analytical technique to determine BTEX in the environment is urgently required.
000 μg L−1 for xylenes, respectively.3 Therefore, establishing a sensitive, reliable, convenient and fast analytical technique to determine BTEX in the environment is urgently required.
Sample preparation is a crucial step for systematic analytical techniques. However, this step is also a significant bottleneck for obtaining an accurate result in an analysis. Several disadvantages of traditional methods of liquid–liquid extraction (LLE) are the use of significant volumes of toxic organic solvents, being time-consuming and causing difficulty in automation. Sorbent-based extraction methods, such as solid phase extraction (SPE) and solid phase microextraction (SPME), use little to no toxic solvents and are the widely used sample preparation methods.4–6 However, SPE and SPME have some disadvantages such as expense, tediousness and limited lifetime. Recently, magnetic solid phase extraction (MSPE), a sorbent-based extraction technique, has been developed to overcome these limitations.7 In MSPE, a magnetic sorbent is dispersed into a sample solution where the target analytes are adsorbed onto the sorbent and then separated rapidly and effectively from the solution using an external magnet. Finally, the analytes on the sorbent are eluted using a small amount of organic solvent. The virtues of MSPE, such as magnetic operational simplicity, rapid separation times, analyte retrievability and high extraction efficiency, have allowed it to be successfully used for the determination of different analytes, such as drugs,8,9 insecticides,10 phthalic acid esters (PAEs),11 polycyclic aromatic hydrocarbons (PAHs),12,13 and metal ions.14
For MSPE, the first issue to resolve is the choice of magnetic material. Fe3O4 MNPs are mainly used as a magnetic material to prepare the magnetic sorbents due to ease of their synthesis and high magnetic characteristics. For one thing, Fe3O4 MNPs can be divided into spherical structure and octahedral structure. According to our knowledge, nearly all the previous research of MSPE has used spherical structured Fe3O4 MNPs as magnetic material. On the other hand, pure Fe3O4 MNPs show the poor adsorption performance to analytes in MSPE. To overcome the limitation, Fe3O4 MNPs coated with functional polymers have attracted tremendous interest both theoretically and experimentally. Currently, many studies have modified the surface of Fe3O4 MNPs using silica materials,15 carbon materials,16 polydopamine,17 ionic liquids,18 polypyrrole10 and molecular imprinted polymers19 depending on the physical coating desired or the presence of covalent binding.
Due to the sorptive enrichment of organic analytes, polydimethylsiloxane (PDMS) has been utilized as the adsorbing material in many analytical techniques, such as SPME and stir bar sorptive extraction (SBSE). Previous studies demonstrated that PDMS has excellent adsorption characteristics for non-polar compounds, such as BTEX,20 PAHs,21 pesticides22 and pharmaceuticals.23 More importantly, PDMS appears to be highly suited for sampling in complex matrices, since the enrichment is based on the partitioning of analytes into and their dissolution within the polymer. Correspondingly, PDMS has been applied to increasingly complex matrices including foods,24 soils25 and biological samples.26
For the first time, novel octahedral structured Fe3O4@SiO2@PDMS MNPs have been successfully synthesized. First, Fe3O4@SiO2 MNPs were obtained by forming a thin amorphous silica layer on the octahedral structured Fe3O4 MNPs. Second, PDMS was coated onto the surface of the Fe3O4@SiO2 MNPs by a sol–gel process. There are two advantages to this design. The Fe3O4@SiO2@PDMS MNPs effectively combines the powerful magnetic properties of octahedral structured Fe3O4 MNPs with the high adsorptivity of the PDMS coating, which facilitates the separation and preconcentration of BTEX from environmental water samples. Additionally, the introduction of the SiO2 coating onto the Fe3O4 MNPs provides a silica-like surface for the Fe3O4 that made surface modification with organic silane molecules, such as PDMS, easier. The Fe3O4@SiO2@PDMS MNPs were used as a sorbent for MSPE coupled with gas chromatography-flame ionization detector (GC-FID) for the enrichment and analysis of BTEX in water samples. The experimental parameters affecting the MSPE were studied and optimized. Finally, the applicability of the proposed method to determine BTEX at trace levels in real water samples was evaluated.
2 Experimental
2.1 Chemicals and reagents
Standards containing benzene, toluene, ethylbenzene and xylenes (purity ≥ 99%) were purchased from the Institute for Reference Materials of SEPA (Beijing, China). A mixed stock standard solution of BTEX was prepared with a concentration of 1.00 mg L−1 in acetone (LC grade) from Sigma-Aldrich (Steinheim, Germany) and stored in the dark at 4 °C. Aqueous working solutions were prepared daily in ultrapure water (resistivity of 18.2 MΩ cm at 25 °C). The ultrapure water was purified with a Milli-Q water purification system (Millipore Corporation, Billerica, MA, USA). Fe3O4 MNPs (diam. 50–100 nm) were purchased from Jingkang Co., Ltd. (Changsha, China). Tetraethyl orthosilicate (TEOS) was purchased from Xilong Chemical Co., Ltd (Shantou, China). Methyltrimethoxysilane (MTMOS) and hydroxy silicone oil (HSO) were purchased from Guobang Chemical Co., Ltd (Jinan, China). Trifluoroacetic acid (TFA) was purchased from Aldrich (Allentown, PA, USA).2.2 Instruments
A Shimadzu GC-14C gas chromatograph (Shimadzu, Tokyo, Japan) equipped with a split–splitless injector and flame ionization detector (FID) was used for BTEX Analyses. An Rtx-50 fused-silica column (50% phenyl and 50% methyl polysiloxane) 30 m long, 0.25 mm internal diameter, 0.25 μm film thickness (Restek, USA) was used. High purity nitrogen (purity ≥ 99.999%) was employed as the carrier gas at a flow rate of 1.0 mL min−1. The injector temperature was set at 200 °C. The GC oven temperature was initially held at 40 °C for 1 min and then programmed to increase to 80 °C at 5 °C min−1 and held for 3 min. The detector temperature was maintained at 250 °C. Hydrogen and air were used as the detector gases at 48 and 450 mL min−1, respectively. The injection volume was 1 μL in the split mode (split ratio 1![[thin space (1/6-em)]](https://www.rsc.org/images/entities/char_2009.gif) :
:![[thin space (1/6-em)]](https://www.rsc.org/images/entities/char_2009.gif) 10). Clarity Shimadzu Chemstation was utilized to control the system and to acquire the analytical data. Under these conditions, the three xylene isomers were separated into two peaks, one contained a mixture of m- and p-xylene, and the other contained o-xylene. For quantification, we combined the integrated the area of the two peaks to calculate the overall concentration of xylenes.
10). Clarity Shimadzu Chemstation was utilized to control the system and to acquire the analytical data. Under these conditions, the three xylene isomers were separated into two peaks, one contained a mixture of m- and p-xylene, and the other contained o-xylene. For quantification, we combined the integrated the area of the two peaks to calculate the overall concentration of xylenes.
The morphologies of the materials were observed by scanning electron microscopy (SEM) using a Hitachi S4800 (Tokyo, Japan) and transmission electron microscopy (TEM) using a Tecnai G20 (FEI, American). The crystalline structures of the materials were determined by powder X-ray diffraction (XRD, Rigaku Ultima IV) using a Cu Kα radiation (λ = 1.5418 Å) with 2θ ranging from 5° to 80° with a scan rate of 0.02° per second. The Fourier transform infrared (FTIR) spectra were obtained using a Nicolet iS 10 infrared spectrometer. Magnetic properties were analyzed using an SQUID-VSM (American) at room temperature under an ambient atmosphere.
2.3 Preparation of Fe3O4@SiO2@PDMS MNPs
For the preparation of Fe3O4@SiO2 MNPs, 2 g Fe3O4 was dispersed into in 100 mL of isopropanol and sonicated for 10 min at room temperature. Next, 10 mL of TEOS and 60 mL of NH3H2O (25%) were added and stirred for 12 h at room temperature under a N2 atmosphere. The obtained Fe3O4@SiO2 MNPs were separated by an external magnet and washed with water and methanol five times. Finally, the preparation was dried under vacuum at 60 °C for 6 h for further use.Next, 1 g of the dried Fe3O4@SiO2 MNPs were dispersed in 20 mL of ethanol. Then, 20 mL of MTMOS and 5 mL of HSO were added and mixed thoroughly by ultrasonic agitation for 20 min. 180 μL of TFA (95%) was sequentially added to the resulting solution with ultrasonic agitation over 3 h. Finally, the product was separated with a magnet, washed repeatedly with water and ethanol, and dried under vacuum at 60 °C.
2.4 MSPE procedure
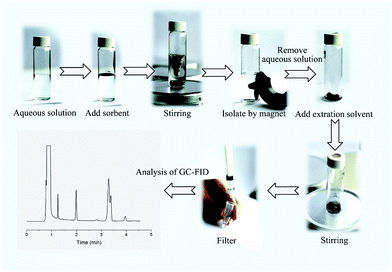
One hundred milligrams of the Fe3O4@SiO2@PDMS MNPs was added to a 20 mL sample solution containing 5 μg L−1 of BTEX. The mixture was continuously stirred at a constant speed (i.e., 200 rpm) with a magnetic stirrer to allow the analytes to be fully adsorbed onto the MNPs. After 15 min, the MNPs were quickly separated from the sample solution using an external magnet. The supernatant was decantated and the MNPs were eluted with 0.5 mL of dichloromethane. The eluting solvent was isolated from MNPs using an external magnet and filtered with a 0.45 μm membrane. Finally, 1.00 μL of the eluting solvent was injected into the GC instrument for subsequent analysis. A schematic representation of the MSPE method is shown in Fig. 1.3 Results and discussion
3.1 Characterization of the materials
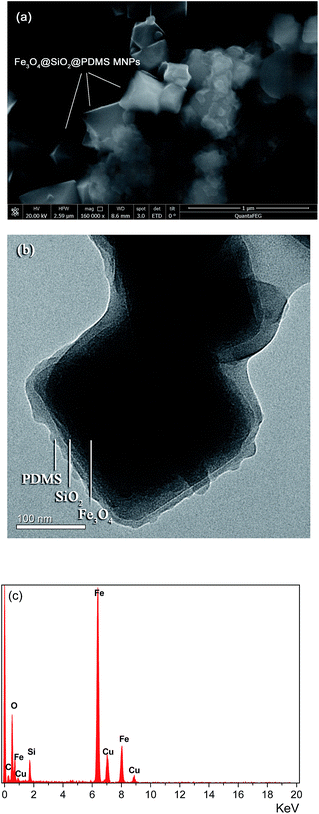
The morphological structure of the Fe3O4@SiO2@PDMS MNPs was characterized with SEM and TEM. The SEM image (Fig. 2a) shows the Fe3O4 MNPs have an octahedral structure and uniform size. The estimated average size was 50–100 nm. The TEM image (Fig. 2b) indicates that the bilayer structured SiO2@PDMS polymerized coatings are homogeneously and uniformly distributed on the surface of the Fe3O4 MNPs. The EDX mapping of the Fe3O4@SiO2@PDMS MNPs presented in Fig. 2c contains localized elemental information. This analysis confirms the existence of the elements Si, C, Fe and O in the structure of the Fe3O4@SiO2@PDMS MNPs. Additionally, it shows that the molar ratios of Fe![[thin space (1/6-em)]](https://www.rsc.org/images/entities/char_2009.gif) :
:![[thin space (1/6-em)]](https://www.rsc.org/images/entities/char_2009.gif) Si
Si![[thin space (1/6-em)]](https://www.rsc.org/images/entities/char_2009.gif) :
:![[thin space (1/6-em)]](https://www.rsc.org/images/entities/char_2009.gif) C are 41
C are 41![[thin space (1/6-em)]](https://www.rsc.org/images/entities/char_2009.gif) :
:![[thin space (1/6-em)]](https://www.rsc.org/images/entities/char_2009.gif) 5
5![[thin space (1/6-em)]](https://www.rsc.org/images/entities/char_2009.gif) :
:![[thin space (1/6-em)]](https://www.rsc.org/images/entities/char_2009.gif) 6.
6.
The XRD patterns of the Fe3O4, Fe3O4@SiO2 and Fe3O4@SiO2@PDMS MNPs are shown in Fig. 3a. In the pattern from the Fe3O4 MNPs, the diffraction angles at 2θ = 18.29°, 30.10°, 35.42°, 43.04°, 53.50°, 56.98° and 62.60°, corresponding to the crystal surface of Fe3O4 (111), (220), (311), (400), (442), (511) and (440), respectively, confirm the existence of pure Fe3O4 (JCPDS 65-3107). The pattern from the Fe3O4@SiO2 MNPs shows almost the same features as the pattern from the Fe3O4 MNPs in Fig. 3a. No diffraction peaks corresponding to SiO2 were observed because the prepared SiO2 is amorphous. The same set of characteristic peaks were also observed for the Fe3O4@SiO2@PDMS MNPs, indicating the stability of the crystalline phase of the Fe3O4 throughout preparation.
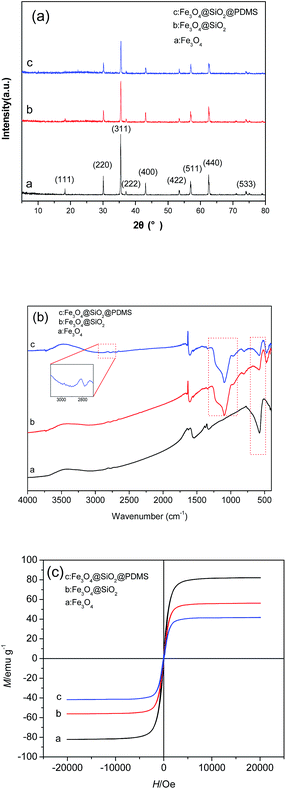 | ||
| Fig. 3 The XRD patterns (a), the FTIR spectra (b) and the hysteresis loops (c) of the Fe3O4, Fe3O4@SiO2 and Fe3O4@SiO2@PDMS MNPs. | ||
Fig. 3b shows the FTIR spectra of the Fe3O4, Fe3O4@SiO2 and Fe3O4@SiO2@PDMS MNPs. The stretching vibration modes of Fe–O bands are observed at 573 cm−1 in the FTIR spectrum of the Fe3O4 MNPs. The characteristic peaks of Si–OH (963 cm−1) and Si–O–Si (1095 cm−1) observed in the spectrum of Fe3O4@SiO2 MNPs suggest that the SiO2 coating has been successfully distributed onto the surfaces of the Fe3O4 MNPs. Compared with the spectra of Fe3O4 and Fe3O4@SiO2 MNPs, the spectrum of Fe3O4@SiO2@PDMS MNPs also displays the characteristic peaks of PDMS, including –CH3 at approximately 2900 cm−1, which confirms that the PDMS coating was successfully applied onto the MNPs.
Fig. 3c shows the hysteresis loops of the Fe3O4, Fe3O4@SiO2 and Fe3O4@SiO2@PDMS MNPs. All of the hysteresis loops for the MNPs show an “S” shape and are almost absent of residual magnetism and coercivity force. The saturation magnetization of the Fe3O4, Fe3O4@SiO2 and Fe3O4@SiO2@PDMS MNPs are 82.2 emu g−1, 56.2 emu g−1 and 41.8 emu g−1, respectively. These results demonstrate that the magnetization decreases with coating. However, the magnetization is still sufficiently high for the MNPs to be separated by an external magnet. These results demonstrate that the sorbents can easily be separated and recovered by an external magnetic field.
3.2 Optimization of extraction conditions
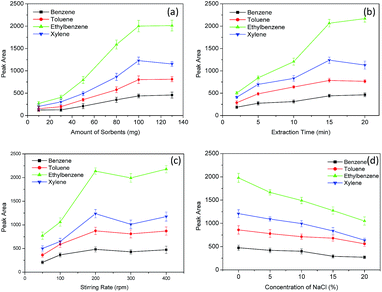
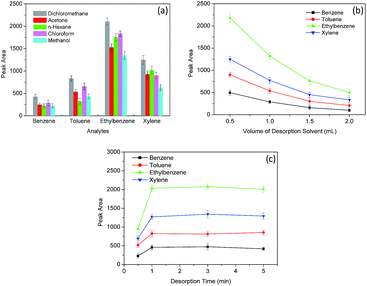
Several parameters, including the amount of sorbent, extraction time, stirring rate, salt effect, the type of desorption solvent, the volume of desorption solvent and desorption time, were investigated to optimize the extraction efficiency of BTEX by the Fe3O4@SiO2@PDMS MNPs. The concentration of BTEX was set at 5 μg L−1. All of the optimization experiments were conducted three times.3.3 Optimization of desorption conditions
3.4 Analytical performance
A series of experiments regarding linearity and limits of detection (LODs), limits of quantitation (LOQs), and reproducibility were performed to validate the proposed MSPE method under optimal conditions. The linear concentration range was determined from plots of the peak areas versus the concentration of the respective analytes. These plots were for quantitative purposes. The LODs and LOQs were calculated at concentrations where the signal-to-noise ratios were equal to 3 and 10. All of the results are summarized in Table 1. Good linearity occurred from 0.05–20 μg L−1 and the coefficient of determination (r2) was more than 0.9980. The LODs and LOQs for BTEX were found to be 0.002–0.005 μg L−1 and 0.008–0.017 μg L−1, respectively. To determine the reproducibility of the method, six parallel experiments in quintuple of 5 μg L−1 of BTEX with separate intra- and inter-batch preparations were performed. The results show that the intra- and inter-batch relative standard deviations (RSDs) are less than 11.6% and 15.0%, respectively, revealing acceptable reproducibility.| Analytes | Linearity range (μg L−1) | Coefficient of determination (r2) | LODs (μg L−1) | LOQs (μg L−1) | Repeatability (RSD%) | |
|---|---|---|---|---|---|---|
| Intra-batch | Inter-batch | |||||
| Benzene | 0.05–20 | 0.9985 | 0.005 | 0.017 | 8.9 | 13.4 |
| Toluene | 0.05–20 | 0.9991 | 0.005 | 0.017 | 7.5 | 11.5 |
| Ethylbenzene | 0.05–20 | 0.9993 | 0.002 | 0.008 | 10.2 | 15.0 |
| Xylenes | 0.05–20 | 0.9980 | 0.002 | 0.008 | 11.6 | 14.8 |
3.5 Analysis of real samples
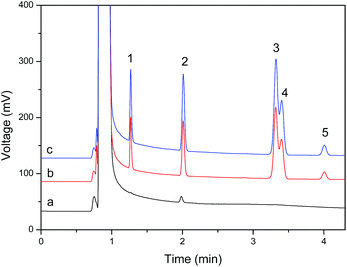
The developed method was applied to the analysis of BTEX in environmental water samples. Water samples were collected from the Jiulong River of Zhangzhou City, the inner lake of a school and a sewage treatment plant, filtered through 0.45 μm microporous membranes and stored at 4 °C. All samples were analyzed within 3 days of collection to avoid storage losses. The results in Table 2 show that a trace level of toluene (0.32 μg L−1) was detected in the sewage treatment plant water sample. The recovery of the 5 μg L−1 of BTEX added to the water samples ranged from 87.4 to 111.5% demonstrating that the accuracy of the suggested method is acceptable. A representative chromatogram of the sewage treatment plant water sample is shown in Fig. 6.| Sample analyte | Jiulong River of Zhangzhou | Inner lake in a school | Sewage treatment plant | ||||||
|---|---|---|---|---|---|---|---|---|---|
| Detected (μg L−1) | Recoverya (%) | RSD (%) | Detected (μg L−1) | Recovery (%) | RSD (%) | Detected (μg L−1) | Recovery (%) | RSD (%) | |
| a Recoveries determined at spiked levels of 5 μg L−1.b Not detected. | |||||||||
| Benzene | NDb | 102.6 | 9.4 | ND | 87.4 | 11.0 | ND | 111.5 | 5.7 |
| Toluene | ND | 106.5 | 8.2 | ND | 90.6 | 11.5 | 0.32 | 106.7 | 6.5 |
| Ethylbenzene | ND | 93.5 | 4.0 | ND | 118.0 | 6.9 | ND | 89.0 | 6.7 |
| Xylenes | ND | 107.8 | 3.5 | ND | 100.4 | 10.5 | ND | 101.5 | 8.5 |
4 Conclusions
In this paper, a new MSPE procedure using Fe3O4@SiO2@PDMS MNPs as sorbents was developed for the determination of BTEX in environmental water samples. The prepared Fe3O4@SiO2@PDMS MNPs have a high surface area, strong magnetic properties, and good adsorption performance for analytes. Under optimal conditions, the proposed MSPE method exhibits high sensitivity, satisfactory recovery in spiked samples and good repeatability for the analysis of BTEX in real water samples.Conflicts of interest
There are no conflicts to declare.Acknowledgements
This work was supported by the Natural Scientific Foundation of China (No. 21105088) the Natural Science Foundation of Fujian Province, China (No. 2013J01062) and the Natural Science Foundation of Zhangzhou City, China (No. ZZ2016J30) which are gratefully acknowledged.References
- L. M. McKenzie, R. Z. Witter, L. S. Newman and J. L. Adgate, Sci. Total Environ., 2012, 424, 79–87 CrossRef CAS PubMed.
- WHO, Drinking Water Guidelines, 2008 Search PubMed.
- U. S. EPA, 2006 Edition of the Drinking Water Standards and Health Advisories, 2006 Search PubMed.
- A. Andrade-Eiroa, M. Canle, V. Leroy-Cancellieri and V. Cerdà, TrAC, Trends Anal. Chem., 2015, 80, 655–667 CrossRef.
- G. F. Ouyang and J. Pawliszyn, TrAC, Trends Anal. Chem., 2006, 25, 692–703 CrossRef CAS.
- M. S. Zhang and J. R. Huang, RSC Adv., 2016, 6, 94098–94104 RSC.
- T. K. Indira and P. K. Lakshmi, Int. J. Pharm. Sci. Nanotechnol., 2010, 3, 1035–1042 CAS.
- Y. Y. Sun, J. Tian, L. Wang, H. Y. Yan, F. X. Qiao and X. Q. Qiao, J. Chromatogr. A, 2015, 1422, 53–59 CrossRef CAS PubMed.
- S. Mahpishanian and H. Sereshti, J. Chromatogr. A, 2016, 1443, 43–53 CrossRef CAS PubMed.
- H. Y. Zhao, M. Y. Huang, J. R. Wu, L. Wang and H. He, J. Chromatogr. B: Anal. Technol. Biomed. Life Sci., 2016, 1011, 33–44 CrossRef CAS PubMed.
- M. Xu, M. H. Liu, M. R. Sun, K. Chen, X. J. Cao and Y. M. Hu, Talanta, 2016, 150, 125–134 CrossRef CAS PubMed.
- H. B. Zheng, J. Ding, S. J. Zheng, G. T. Zhu, B. F. Yuan and Y. Q. Feng, Talanta, 2016, 148, 46–53 CrossRef CAS PubMed.
- Y. T. Shi, H. Wu, C. Q. Wang, X. Z. Guo, J. L. Du and L. M. Du, Food Chem., 2016, 199, 75–80 CrossRef CAS PubMed.
- B. S. Zhao, M. He, B. B. Chen and B. Hu, Spectrochim. Acta, Part B, 2015, 107, 115–124 CrossRef CAS.
- L. I. A. Ali, W. A. W. Ibrahim, A. Sulaiman, M. A. Kamboh and M. M. Sanagi, Talanta, 2016, 148, 191–199 CrossRef PubMed.
- C. Herrero-Latorre, J. Barciela-García, S. García-Martín, R. M. Peña-Crecente and J. Otárola-Jiménez, Anal. Chim. Acta, 2015, 892, 10–26 CrossRef CAS PubMed.
- W. B. Chai, H. J. Wang, Y. Zhang and G. S. Ding, Talanta, 2016, 149, 13–20 CrossRef CAS PubMed.
- J. P. Chen and X. S. Zhu, Food Chem., 2016, 200, 10–15 CrossRef CAS PubMed.
- G. Sheykhaghaei, M. Hossainisadr, S. Khanahmadzadeh, M. Seyedsajadi and A. Alipouramjad, J. Chromatogr. B: Anal. Technol. Biomed. Life Sci., 2016, 1011, 1–5 CrossRef CAS PubMed.
- N. Baimatova, B. Kenessov, J. A. Koziel, L. Carlsen, M. Bektassov and O. P. Demyanenko, Talanta, 2016, 154, 46–52 CrossRef CAS PubMed.
- W. Lin, S. B. Wei, R. F. Jiang, F. Zhu and G. F. Ouyang, Anal. Chim. Acta, 2016, 933, 117–123 CrossRef CAS PubMed.
- J. Martins, C. Esteves, A. Limpo-Faria, P. Barros, N. Ribeiro, T. Simões, M. Correia and C. Delerue-Matos, Food Chem., 2012, 132, 630–636 CrossRef CAS PubMed.
- V. K. Balakrishnan, K. A. Terry and J. Toito, J. Chromatogr. A, 2006, 1131, 1–10 CrossRef CAS PubMed.
- A. G. Oomen, P. Mayer and J. Tolls, Anal. Chem., 2000, 72, 2802–2808 CrossRef CAS PubMed.
- F. Reichenberg, F. Smedes, J. Å. Jönsson and P. Mayer, Chem. Cent. J., 2008, 2, 1–10 CrossRef PubMed.
- A. Jahnke, P. Mayer, D. Broman and M. S. McLachlan, Chemosphere, 2009, 77, 764–770 CrossRef CAS PubMed.
| This journal is © The Royal Society of Chemistry 2017 |

