
 Open Access Article
 This Open Access Article is licensed under a Creative Commons Attribution-Non Commercial 3.0 Unported Licence
Improvement of structure and electrical conductivity of activated carbon by catalytic graphitization using N2 plasma pretreatment and iron(III) loading
Shukai Shi ,
Xiaoyan Zhou*,
Weimin Chen,
Minzhi Chen*,
Thiphuong Nguyen,
Xin Wang and
Wei Zhang
,
Xiaoyan Zhou*,
Weimin Chen,
Minzhi Chen*,
Thiphuong Nguyen,
Xin Wang and
Wei Zhang
College of Materials Science and Engineering, Nanjing Forestry University, No. 159 Longpan Road, Nanjing 210037, China. E-mail: shishukai@hotmail.com; zhouxiaoyan@njfu.edu.cn; chenminzhi@njfu.edu.cn; Fax: +86 2585428517; Tel: +86 25 15050583710 Tel: +86 2585428506
First published on 18th September 2017
Abstract
In order to improve the amorphous structure of commercially activated carbon (AC) for enhancing its electron transport, nitrogen radio-frequency plasma was firstly used to pretreat AC, followed by impregnation with FeCl3·6H2O solutions to prepare graphitic carbon under the pyrolysis temperature of 1000 °C. Emphasis was put on investigating the structure and electrical conductivity of post-calcination samples by X-ray diffraction (XRD), Raman spectroscopy, and transmission electron microscopy (TEM) characterization, as well as measuring its powder resistivity. The results show that the structure of annealed composite samples is more ordered as the pretreatment time increased, and the maximum value of electrical conductivity is higher than that of the un-pretreated AC by 20%. Furthermore, by exploring the effect on the reaction of plasma treatment on iron loading by means of X-ray photoelectron spectroscopy (XPS) and energy-dispersive X-ray spectroscopy (EDX), a plausible explanation can be proposed that the content and distribution of iron loaded on the raw AC play a decisive role in the later iron-catalyzed graphitization.
1. Introduction
It is a fact that the amount of fossil resources and energy has been an important constraining factor influencing global development of economy and society. Biomass and bioenergy, as new types of sustainable alternatives, have attracted much attention.1 Among the many biomass products, activated carbon (AC), which universally has a well-developed pore structure and high surface area, has been widely used in the field of energy storage and environmental protection.2 On the one hand, as an adsorbent it can effectively remove toxic heavy metal and organic pollutants in wastewater treatment. On the other hand, AC, as a kind of promising electrode material, plays a vital role in current industrial supercapacitors. In recent years, many researchers have paid considerable attention to studying nanostructured carbon, since the detailed morphology of the AC framework will greatly determine its physicochemical properties.3 Though the manufacturing process of classic AC is mature, the ordered level of AC framework and its electrical conductivity are still not satisfactory.4 Exceptionally, in contrast with the amorphous AC, graphitic carbon (GC) with highly ordered region exhibits some advantages, such as high electric conductivity, excellent thermal stability and strong oxidation resistance to acids and bases.5 Accordingly, the synthetic method of graphitic carbon triggers intense interest from researchers due to its bright application prospect.Graphitization is a thermodynamically favorable process, which transforms amorphous carbon into well-ordered and three-dimensional graphitic structure.3,6 In order to prepare GC, two groups of Zhang et al. and Ren et al. reported that they fabricated GC by pyrolysis at extremely high temperature (>2000 °C) for 12 hours in a vacuum environment.7,8 However, this process is time-consuming and energy-consuming. Besides, other methods such as chemical vapor deposition and laser ablation are subject to the strict operating condition.9 By comparison, a technique called catalytic graphitization has been widely adopted via introducing certain inorganic or organic additives into carbon sources, and the advantage of this method allows the formation of graphitic structure at a relatively lower temperature (<1000 °C).6,10 In particular, nonprecious transition metal salts such as ferric(III), cobalt(II), and nickel(II) chlorides are usually functioned as catalyst species.11 At the same time, the mechanisms of metal-catalyzed graphitization are classified as solid-phase and liquid-phase, which are more dependent on the state of catalyst.12 Zhou et al. revealed that Fe–Ni alloy had a significant catalytic effect to convert PAN-based carbon fibers into crystalline materials at moderate temperatures. Moreover, from the results of the graphitization degree of PAN-based carbon fibers coated with Fe–Ni, it can be concluded that the Fe catalyst prevails in the synergic catalytic function.5 More recently, Hoekstra et al. further reported that the iron was the most active catalyst as a consequence of the generation of iron carbides in catalytic graphitization.9
To the best of our knowledge, in addition to the problem of iron dispersion, the compatibility issue between iron catalysts and AC is also hardly concerned in the previous study. According to theoretical and experimental research, a common conclusion can be summarized that the pores of electrode material are favorable for electrolyte ions transport while lamellar structure like graphite is conductive to the conduction of electrons.3 Hence, it may be a good choice to load much iron catalysts on the carbon materials surfaces as much as possible, which can be more helpful to iron mobility and prevent porosity channels of carbon materials from being blocked.9 Based on the above idea, it is imperative to enhance the surfactivity of carbon materials for adsorbing more metal catalyst particles. Hopefully, some literatures have proved that the doping of nitrogen (N) can provide Fe catalyst with active site and support its long-term stability due to a strong interaction existed between Fe and N.13,14 Compared to the chemical functionalizations or surfactant method, radio-frequency (RF) plasma treatment embodies some competitive advantages in modifying materials surface respect, since it features a fast, efficient, and environmentally friendly technique.15–17
On the basis of these prior studies, we present a novel way of coordinating iron and nitrogen, that is, pretreating the raw AC via RF nitrogen plasma by varying processing time, and then dip AC into ferric chloride solution for the next heating step. The combination of nitrogen doping and ferric ions loading is beneficial to take full advantage of their own strengths. Nitrogen doping can endow AC with a better affinity on improving surface accessibility.18 The ferric ions serve as the catalyst, which can facilitate the ordered arrangement of grains during the thermal treatment of precursor.11,13 The objective of this work was to create a graphite-like material in a reliable and feasible method. To this end, the changes of structural characteristics and electrical properties of catalytic pyrolysis products were discussed.
2. Material and methods
2.1 Preparation of samples
Firstly, commercial coconut shell-based activated carbon (purchased from Mulinsen Activated Carbon Group, Nanjing, China) was screened into a particle size of less than 100 mesh, followed by drying at 103 °C for 12 h. Subsequently, about 2.5 g AC powder was evenly laid on the glass Petri dish with a diameter of 120 mm and then the dish was placed into a reaction chamber for plasma treatment. The procedure of RF plasma treatment was as following: the chamber was evacuated to about 3 Pa. Afterwards the high-purity nitrogen (N2, 99.99%) was fed into the vacuum chamber and maintained volume ventilation for 5 min. For the sake of ensuring the purity of cavity gas, this step would be repeated for 3 times. Finally, the pressure of chamber was required to be controlled at 30 Pa through adjusting the flow rate of reactive gas.17 The excitation radio-frequency and power were set at 13.56 MHz and 100 W respectively. The treatment time varied from 2 to 10 min with a time interval of 4 min.After the completion of modification, a dip adsorption method was used to load iron catalyst on AC. To prepare four bottles of ferric ions solution with a constant concentration of 0.5 wt%, 6.66 g FeCl3·6H2O (purchased from Nanjing Chemical Reagent Co., Ltd.) were dissolved in 800 mL of distilled water and stirred for 2 h. Then, 800 mL solution was equally divided into four bottles and put 2 g AC with different treatment conditions into each bottle of FeCl3 solution for shaking 24 h. At last, the impregnated precursors were filtered and dried at 103 °C for 6 h.
The tube furnace was employed for pyrolysis and a temperature-programmed route was set as below. Firstly, the precursors were heated from room temperature to 250 °C with a soak time of 30 min at a rate of 5 °C min−1 in air atmosphere. Then, the mixtures were continuously heated up to a desired temperature of 1000 °C under 80 mL min−1 nitrogen gas flow at a ramp rate of 10 °C min−1 and held at 1000 °C for 2 h. Finally, all annealed composite samples were labeled as PAC-t, where the letter “t” represented plasma treatment time.
2.2 Characterization methods
X-ray diffractometer (XRD, Bruker D8 FOCUS, Germany) with Cu Kα radiation (λ = 0.154 nm) and Raman spectrometer (DXR532, America) using an excitation wavelength of 532 nm from an argon ion laser were utilized at room temperature for collecting the structural information of annealed composite samples. The morphology of heated samples was detected by transmission electron microscopy (TEM, JEM-2100F, JEOL Ltd., Tokyo, Japan). The Fe mapping of precursors were recorded by a scanning electron microscopy (SEM, JSM-7600F, Japan) equipped with an energy-dispersive X-ray spectroscope (EDX) analyzer. X-ray photoelectron spectroscopy (XPS, AXIS Ultra DLD, Japan) was used for determining the surface condition of nitrogen on the raw AC with and without RF plasma treatment.19 The resistivity of samples at room temperature was measured by powder resistivity instrument (ST2722, China) via stuffing carbon powders (40- to 60-mesh) into a hollow cylinder with its height of 5 mm and inner diameter of 11.28 mm, and then pressed them in different pressures of 4 and 12 MPa for the further test (Fig. 1).20 | ||
| Fig. 1 The schematic diagram of plasma pretreatment and ferric iron ions loading on activated carbon. | ||
3. Results and discussion
3.1 Analysis of structure, phase and morphology
XRD patterns of different precursors heated at 1000 °C with and without RF plasma treatment are illustrated in Fig. 2. The phase identifications of four samples were retrieved by XRD analysis software (Jade 6) and the results were marked on the XRD profiles with special symbols.21 For all post-calcination materials, it should be noticed that the emergence of typical diffraction of Fe3C phase (JCPDS no. 03-0411) at around 66.3°, although the intensity of Fe3C reflection is very low. This peak can be assigned to the (024) crystalline plane. It is reported that the Fe3C plays a crucial role as intermediates in catalytic graphitization,9 since a large quantity of metastable Fe3C would be resolved into free-C and metallic Fe as thermal treatment temperature rising above 800 °C.22 To be concrete, the mobility of precipitated Fe would make advancement of graphitization while free-C would make up for defects by entering the skeleton.23 It is also important to note that the phase of Fe (JCPDS no. 88-2324) is detected for all heated samples, but the intensity of PAC-0 is slightly higher than the remaining three samples, which might be due to the loss of iron mobility and thus making irons stop involving in continuous catalysis. Remarkably, three sharp peaks ascribed to Fe2P (JCPDS no. 76-0089) can be clearly seen at 2θ of 40.2°, 44.1°, and 47.1° as well as two identical peaks with relatively low intensity at around 2θ = 52.8° and 54°, which stand for the peaks of (111), (201), (210), (002), and (300) crystal planes respectively. From the above discussion, a fact can be confirmed here, namely iron phosphide and cementite can coexist in one substrate.24 Specially, in the case of PAC-0, it is noteworthy to mention that there are two distinctive peaks located at 2θ = 40.9°, 42.8°, which are indicative of the presence of Fe3P (JCPDS no. 89-2712). However, the composition of Fe3P disappeared in the rest of heated samples, which were treated by RF nitrogen plasma prior to pyrolysis. The change of surface activity of the raw AC may be responsible for this phenomenon. The detailed surface chemistry would be discussed in Section 3.3. Also, it may further imply that more irons were involved in the catalytic reaction after pretreating the raw AC.25 Moreover, the formation of iron and phosphorus compounds was due to the phosphorus contamination from the raw AC, which was activated by phosphoric acid. Fortunately, the structural defects of carbon skeleton caused by the initial combination of iron and phosphorus would be improved when the graphitic structure was formed at the final temperature of 1000 °C, at which the iron and phosphorus compounds had synthesized simultaneously.26 | ||
| Fig. 2 X-ray diffraction patterns of (a) PAC-0 (b) PAC-2 (c) PAC-6 and (d) PAC-10. | ||
In particular, the broad diffraction peaks of all samples that appear at 2θ angles of 26°, which are corresponding to the (002) reflections of graphite.27 However, these peaks are weak and not prominent, which may result from the background of amorphous phase covering their reflections up.28 As a matter of fact, there truly exist some graphitized carbons stacking on amorphous carbon matrix. Meanwhile, the shrink of band width between 20° and 30° with different modification conditions indicates the weakening of amorphous state, which probably implies that graphitic regions are progressively expanded for the samples of PAC-2, PAC-6 and PAC-10 through iron-catalyzed graphitization after modification of their corresponding precursors.29 For precisely confirming the above argument, the interlayer spacing (d002) and the average crystallite size (Lc) of (002) facet were measured and presented in Table 1, despite there being unavoidable errors in terms of such wide peaks.27
| Sample | d002 (Å) | Lc (nm) |
|---|---|---|
| PAC-0 | 3.4577 | 1.7 |
| PAC-2 | 3.3801 | 2.0 |
| PAC-6 | 3.3756 | 2.3 |
| PAC-10 | 3.3570 | 2.4 |
It is worth noting that the values of d002 and Lc for three pretreated samples are decreased as compare to the un-pretreated sample, which demonstrates the (002) peak position is gradually close to the typical graphite phase,30 albeit with turbostratic carbon domination.
Raman spectroscopy was employed to further evaluate the ordered degree of structure for all samples. Shown in Fig. 3 is Raman images of PAC-0, PAC-2, PAC-6 and PAC-10 from bottom to top, the deconvolutions of spectras were performed by origin software with Lorentzian curve-fitting procedure. It can be seen that the Raman spectrums of carbon materials are decomposed into four first-order bands and each band represents a form of vibratory mode.31 There are two well-resolved bands observed in the position of 1334 cm−1 and 1588 cm−1 separately, where two peaks are generally called D band and G band respectively.32 The D-peak is related to the defective and disordered structure attributed to A1g mode of sp3-hybridized carbon atoms in a cubic lattice, and the G-peak is assigned to E2g mode of sp2-bonded carbon atoms in two-dimensional graphite sheets with the C–C stretching vibrations.33 However, the G peak of PAC-0 apparently shifts to a position with the higher wavenumber, resulting from small crystallites with little three-dimensional order.9 In addition, one band at around 1150 cm−1 refers to a region with alicyclics and aliphatic chains of γ (C![[double bond, length as m-dash]](https://www.rsc.org/images/entities/char_e001.gif) C), while the other at 1516 cm−1 is regarded as amorphous carbons with a singly broad and asymmetrical band.34
C), while the other at 1516 cm−1 is regarded as amorphous carbons with a singly broad and asymmetrical band.34
 | ||
| Fig. 3 Raman spectra of (a) PAC-0 (b) PAC-2 (c) PAC-6 and (d) PAC-10. | ||
In the following, a quantitative discussion based on the full widths at half maximum (FWHM) as well as the integral area of the D-peak and the G-peak were summarized in Table 2. Firstly, the integrated area ratio R (R = AD/AG) of the D-peak and the G-peak was determined, the smaller the ratio R, the higher degree of crystallinity.30 It can be found that the R value of PAC-0 is greater than the remaining three specimens, which is consistent with the evolution of the (d002) interlayer distance. It seems to suggest that nitrogen functional groups may promote the deposition of ferric iron on the raw AC, thereby making iron can play pivotal catalytic effect. At the same time, by comparing the R values of PAC-2, PAC-6 and PAC-10, it reflects that the calculated data tends to diminish as processing time increased, which evidences that the crystalline of post-calcination samples is increased overall. Secondly, the FWHM is a useful index,35 the lattice defects of three pretreated samples are reduced when compared with the FWHM-D of PAC-0. Among the three treated samples, the FWHM-D of PAC-10 narrows from 172 to 147 cm−1, which suggests that the crystallite sizes of the disordered carbon become very small.9 Moreover, the difference of FWHM-G is not obvious. It might be concluded that the RF nitrogen plasma pretreatment is conducive to a wide distribution for ferric ions loading on the raw AC, and thus leading to an improvement in carbon framework during iron-catalyzed graphitization. Finally, according to the documentation, the in-plane crystallite sizes La can be determined as following eqn (1):36
| La = (2.4 × 10⁻¹⁰)λl4R−1 | (1) |
| Sample | Peak position (cm−1) | FWHM (cm−1) | R = AD/AG | La (nm) | ||
|---|---|---|---|---|---|---|
| D-band | G-band | D-band | G-band | |||
| PAC-0 | 1336 | 1592 | 174 | 56 | 3.76 | 5.11 |
| PAC-2 | 1334 | 1587 | 172 | 63 | 3.24 | 5.93 |
| PAC-6 | 1334 | 1588 | 161 | 61 | 3.19 | 6.03 |
| PAC-10 | 1334 | 1589 | 147 | 60 | 2.96 | 6.49 |
According to the XRD and Raman analysis, we applied the TEM technique to directly visualize more detailed structure feature. The PAC-0 and PAC-10 are taken into account and their micrographs are displayed in Fig. 4. For the PAC-0, it basically shows an amorphous orientation state and non-crystalline carbon grains, which are mirrored in the XRD and Raman profiles. In view of the above facts appearing in this sample, it is most likely that the sample lacks adequate intermetallic phase to “etch” into the solid carbon crystallites for inducing their ordered arrangement during the heat treatment.2 The reason for the absence of iron carbides might be attributed to the content and activity of iron. In the case of PAC-10, with the evolution of carbon crystallite, we investigated its microstructure under three different magnifications. Firstly, as can be seen on the top of Fig. 4b, the pore walls run in parallel arrays, which indicate the presence of lamellar structure.25 Moreover, for roughly understanding how the iron metal compounds distributing over the material, a selected higher resolution area with an Electron Diffraction (ED) patterns are shown on the bottom left of Fig. 4b, it can be observed that iron-containing compounds disperse uniformly in black while carbon substrates remain in grey. Also, a well-defined diffraction ring corresponding to the (002) plane and the rest crystals were detected by ED patter. This finding strengthens the validity of XRD. Finally, in the enlarged view with a scale of 20 nm, it can be seen in the bulk of this area, the lattice fringes are generated and centered at the metal compounds of Fe2P, which can be explained by the mechanism of dissolution and re-precipitation of cementite.38 By comparing the TEM images of PAC-0 and PAC-10, an objective judgement can be made that the pretreated AC precursor is easier to be catalyzed to form graphitic nanostructures.
 | ||
| Fig. 4 TEM images of samples (a) PAC-0 and (b) PAC-10. | ||
3.2 Analysis of electrical conductivity
The intrinsic electrical conductivity of carbon powders themselves is an essential parameter when it comes to the selection and application of electrode material. Also, the nature of electron transport is proportional to the degree of crystalline order in carbon material.39 As is shown in Fig. 5, the values of electrical conductivity exhibit certain regularity with respect to precursors whether being treated or not. With the prolongation of pretreatment time, the obtained value tends to rise step by step. This indirectly verifies that the crystalline volume fraction has been enlarged through pretreating the raw AC prior to pyrolysis. Especially, in the case of PAC-10, when setting test pressure at 12 MPa, it was determined as 6.23 S cm−1, which was superior to the Fe3O4/carbon composite nanofibers and Fe–N-doped carbon capsules.13,40 when compared with the blank sample, the electrical conductivity of PAC-10 raised by 23.8% and 20.3% at test pressures of 4 MPa and 12 MPa separately. At the same time, the reason why the electrical conductivity of same sample varied with the given pressure is linked with their compaction degree. Notably, the results of conductivity are in good accordance with the above structure characterizations of XRD, Raman and TEM.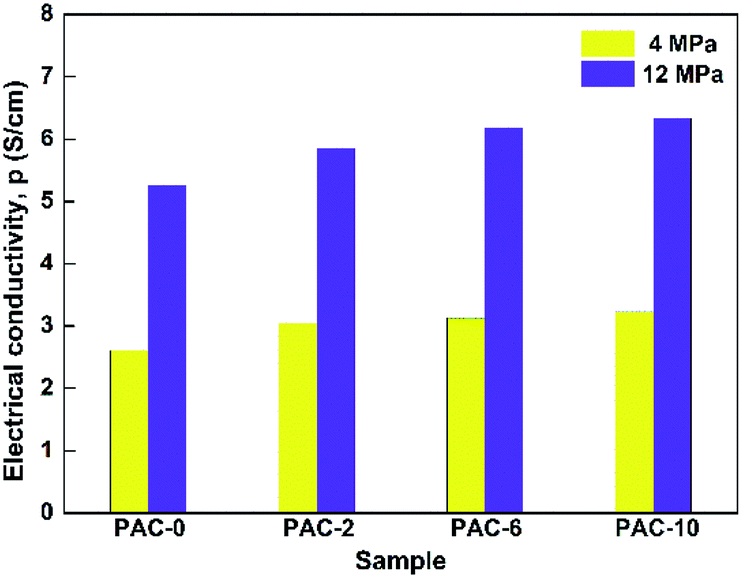 | ||
| Fig. 5 Electrical conductivity of PAC-0, PAC-2, PAC-6, and PAC-10 under two pressure conditions. | ||
3.3 Analysis of reactions during plasma treatment and iron(III) loading
Based on the above comprehensive analysis, it had been demonstrated by XRD, Raman, TEM and electrical conductivity that the raw AC with and without pretreatment would have some impact on their subsequent graphitization during the heat treatment. Herein, in order to elucidate the reason why there exists difference on the structure and electrical conductivity for four post-annealed samples, two types of characterization techniques were applied to investigate the blank and the pretreated raw AC. Firstly, XPS measurements were employed to examine the chemical state of N 1s on the surface of raw AC. As is shown in Fig. 6a, the untreated raw AC is dominated by a single peak, which is associated with the amides. By contrast, the N 1s of pretreated raw AC was divided into three peaks by deconvolution and Gaussian curve fitting. These peaks belong to the pyridinic-N, amides and quaternary-N, respectively,41 which suggest that nitrogen is indeed introduced on the raw AC surface by nitrogen plasma treatment. Furthermore, a quantitative study of nitrogen species based on the fraction of each integrated peak area was carried out and summarized in the Table 3. According to the concrete data, it can be evidently found that the added nitrogen is mainly present in the form of pyridinic-N and quaternary-N, which are the leading functional species on the surface. Their emergence might be owing to the nitrogenous radicals generated from nitrogen RF plasma etching the carbon fragments, such as substituting oxygen-containing species or incorporating into the aromatic rings to form pyridinic-N and quaternary-N, thus making the surface functional.18,42 | ||
| Fig. 6 N 1s XPS spectra for the raw AC of (a) PAC-0 and (b) PAC-10. | ||
| Sample | Total N (at%) | Pyridinic-N | Amides | Quaternary-N |
|---|---|---|---|---|
| PAC-0 | 0.39 | — | 0.39 | — |
| PAC-10 | 1.07 | 0.51 | 0.35 | 0.21 |
Most importantly, it is reported that nitrogen-containing groups generally have a stronger ability to adsorb metal ions as a function of coordination mechanism,43,44 which can be explained that the pyridinic nitrogen provides richly active sites for holding ferric ions, while the existence of quaternary nitrogen raises the surface hydrophilicity and wettability of the raw AC.45 Consequently, with the surface accessibility of pretreated AC being improved, it could be speculated that the binding sites between the ferric ions and carbon matrix was extremely increased when soaking the pretreated AC in FeCl3·6H2O solution. Furthermore, for the sake of supporting the discussion of XPS section, EDX with Fe elemental mapping was performed to distinguish the difference regarding the adsorption capacity and dispersion of iron between pure AC and pretreated one. On one hand, by visually comparing Fig. 7(a-2) and (b-2), it can be observed that irons loading on the pretreated AC are more abundant and homogeneous than the blank sample. On the other hand, the EDX data supplies a definite proof to above phenomenon simultaneously.
 | ||
| Fig. 7 EDX and Fe elements maps corresponding to the SEM images for the precursors of PAC-0 with (a), (a-1), (a-2) and PAC-10 with (b), (b-1), (b-2). | ||
To sum up, it can be conjectured that the content and distribution of iron on the raw AC affect the following catalytic graphitization, thus bringing about the structural difference for heated samples. Finally, these distinctions are embodied in the form of electrical conductivity.
4. Conclusions
In conclusion, the raw AC with and without pretreatment and then loading ferric ions were heated up to 1000 °C for fabricating distinguished carbon. Their structures and electronic conductivities were compared and the main results were as following. Firstly, all the pretreated samples were superior to the untreated in terms of the order degree of structure, with evidence of iron catalyst exhibiting a better bonding property on the raw AC surface after pretreating the carriers. Among all activated carbons being catalyzed, the PAC-10 presented a distinct lamellar structure, which was referred to quasi-graphitization, but the degree of graphitization was still low as a whole. Secondly, from the point view of electrical conductivity, the electron transport rates had positive correlation with the pretreatment time of the raw AC. This implied that the crystalline arrangement tended to be well-ordered. Finally, we deduced that the content and the distribution of iron had effect on the catalytic graphitization of raw AC. It is therefore concluded that the nitrogen RF plasma treatment can be beneficial to enhancing the surface activity of AC, and thus has a positive effect on loading ferric ions, subsequently the degree of graphitization being affected in high temperature environment.Conflicts of interest
There are no conflicts to declare.Acknowledgements
The authors are grateful for the National Natural Science Foundation of China (Grant No. 31400515), the Natural Science Foundation of Jiangsu Province (Grant No. BK20161524), the Doctorate Fellowship Foundation of Nanjing Forestry University, the Jiangsu Province Ordinary University Students' Scientific Research Innovation Project (KYZZ16_0319), and the Priority Academic Program Development of Jiangsu Higher Education Institutions (PAPD). Also, this paper was sponsored by the Qing Lan Project.References
- S. Shafiee and E. Topal, Energy Policy, 2009, 37, 181–189 CrossRef.
- E. Thompson, A. E. Danks, L. Bourgeois and Z. Schnepp, Green Chem., 2015, 17, 551–556 RSC.
- J. Tang, T. Wang, X. Sun, Y. Guo, H. Xue, H. Guo, M. Liu, X. Zhang and J. He, Microporous Mesoporous Mater., 2013, 177, 105–112 CrossRef CAS.
- J. F. Myatt, Langmuir, 2000, 16, 4367–4373 CrossRef.
- H. Zhou, Q. Peng, Z. Huang, Q. Yu, J. Chen and Y. Kuang, Trans. Nonferrous Met. Soc. China, 2011, 21, 581–587 CrossRef CAS.
- H. Zhou, Q. Yu, Q. Peng, H. Wang, J. Chen and Y. Kuang, Mater. Chem. Phys., 2008, 110, 434–439 CrossRef CAS.
- L. Zhang, M. Zhang, Y. Wang, Z. Zhang, G. Kan, C. Wang, Z. Zhong and F. Su, J. Mater. Chem. A, 2014, 2, 10161–10168 CAS.
- W. Ren, Z. Zhang, Y. Wang, G. Kan, Q. Tan, Z. Zhong and F. Su, RSC Adv., 2015, 5, 11115–11123 RSC.
- J. Hoekstra, A. M. Beale, F. Soulimani, M. Versluijs-Helder, J. W. Geus and L. W. Jenneskens, J. Phys. Chem. C, 2015, 119, 10653–10661 CAS.
- S. S. Tzeng, Carbon, 2006, 44, 1986–1993 CrossRef CAS.
- M. Kormann, H. Gerhard, C. Zollfrank, H. Scheel and N. Popovska, Carbon, 2009, 47, 2344–2351 CrossRef CAS.
- O. P. Krivoruchko and V. I. Zaikovskii, Mendeleev Commun., 1998, 8, 97–99 CrossRef.
- G. A. Ferrero, K. Preuss, A. Marinovic, A. B. Jorge, N. Mansor, D. J. L. Brett, A. B. Fuertes, M. Sevilla and M. Titirici, ACS Nano, 2016, 10, 5922–5932 CrossRef CAS PubMed.
- S. Zhang, H. Zhang, Q. Liu and S. Chen, J. Mater. Chem. A, 2013, 1, 3302–3308 CAS.
- A. Kaynak, T. Mehmood, X. J. Dai, K. Magniez and A. Kouzani, Materials, 2013, 6, 3482–3493 CrossRef CAS PubMed.
- A. Vesel, J. Kovac, G. Primc, I. Junkar and M. Mozetic, Materials, 2016, 9, 95–108 CrossRef PubMed.
- L. Tang, X. Yang, R. Zhang, X. Wang and X. Zhou, Holforschung, 2015, 69, 193–198 CAS.
- W. Shen and W. Fan, J. Mater. Chem. A, 2013, 1, 999–1013 CAS.
- L. Wang, X. Huang and J. Xue, ChemSusChem, 2016, 9, 1835–1842 CrossRef CAS PubMed.
- M. Sevilla and A. B. Fuertes, Carbon, 2006, 44, 468–474 CrossRef CAS.
- F. Wu, R. Huang, D. Mu, B. Wu and Y. Chen, Electrochim. Acta, 2016, 187, 508–516 CrossRef CAS.
- J. Shi, Y. Wang, W. Du and Z. Hou, Carbon, 2016, 99, 330–337 CrossRef CAS.
- D. V. Dudina, A. V. Ukhina, B. B. Bokhonov, M. A. Korchagin, N. V. Bulina and H. Kato, Ceram. Int., 2017, 43, 11902–11906 CrossRef CAS.
- Z. Schnepp, A. E. Danks, M. J. Hollamby, B. R. Pauw, C. A. Murray and C. C. Tang, Chem. Mater., 2015, 27, 5094–5099 CrossRef CAS.
- E. Charon, J. Rouzaud and J. Aleon, Carbon, 2014, 66, 178–190 CrossRef CAS.
- Z. Yang, J. Wu, X. Zheng, Z. Wang and R. Yang, J. Power Sources, 2015, 277, 161–168 CrossRef CAS.
- S. Inagaki, Y. Yokoo, T. Miki and Y. Kubota, Microporous Mesoporous Mater., 2013, 179, 136–143 CrossRef CAS.
- A. H. Lu, W. C. Li, E. L. Salabas, B. Spliethoff and F. Schuth, Chem. Mater., 2006, 18, 2086–2094 CrossRef CAS.
- D. Kalpana, S. H. Cho, S. B. Lee, Y. S. Lee, R. Misra and N. G. Renganathan, J. Power Sources, 2009, 190, 587–591 CrossRef CAS.
- B. Lu, L. Hu, H. Yin, W. Xiao and D. Wang, RSC Adv., 2016, 6, 106485–106490 RSC.
- W. Chen, X. Zhou, S. Shi, T. Nguyen and M. Chen, RSC Adv., 2017, 7, 7392–7400 RSC.
- A. Sadezky, H. Muckenhuber, H. Grothe, R. Niessner and U. Poschl, Carbon, 2005, 43, 1731–1742 CrossRef CAS.
- C. Qiu, K. E. Bennet, T. Khan, J. D. Ciubuc and F. S. Manciu, Materials, 2016, 9, 897–908 CrossRef PubMed.
- P. Mohanty, S. Nanda, K. K. Pant, S. Naik, J. A. Kozinski and A. K. Dalai, J. Anal. Appl. Pyrolysis, 2013, 104, 485–493 CrossRef CAS.
- D. Zhai, H. Du, B. Li, Y. Zhu and F. Kang, Carbon, 2011, 49, 725–729 CrossRef CAS.
- L. G. Cancado, K. Takai, T. Enoki, M. Endo, Y. A. Kim, H. Mizusaki, A. Jorio, L. N. Coelho, R. Magalhaes-Paniago and M. A. Pimenta, Appl. Phys. Lett., 2006, 88, 12 CrossRef.
- I. Camean, A. B. Garcia, I. Suelves, J. L. Pinilla, M. J. Lazaro, R. Moliner and J. Rouzaud, Carbon, 2012, 50, 5387–5394 CrossRef CAS.
- Y. Liu, Q. Liu, J. Gu, D. Kang, F. Zhou, W. Zhang, Y. Wu and D. Zhang, Carbon, 2013, 64, 132–140 CrossRef CAS.
- J. Ramirez-Rico, A. Gutierrez-Pardo, J. Martinez-Fernandez, V. V. Popov and T. S. Orlova, Mater. Des., 2016, 99, 528–534 CrossRef CAS.
- T. Zhang, D. Huang, Y. Yang, F. Kang and J. Gu, Polymer, 2012, 53, 6000–6007 CrossRef CAS.
- X. Yan and B. Xu, J. Mater. Chem. A, 2014, 2, 8617–8622 CAS.
- H. Huang, D. Ye and B. Huang, Surf. Coat. Technol., 2007, 201, 9533–9540 CrossRef CAS.
- J. Rivera-Utrilla, M. Sanchez-Polo, V. Gomez-Serrano, P. M. Alvarez, M. C. M. Alvim-Ferraz and J. M. Dias, J. Hazard. Mater., 2011, 187, 1–23 CrossRef CAS PubMed.
- B. Xiao and K. M. Thomas, Langmuir, 2005, 21, 3892–3902 CrossRef CAS PubMed.
- J. Kim and S. Park, J. Solid State Chem., 2011, 184, 2184–2189 CrossRef CAS.
| This journal is © The Royal Society of Chemistry 2017 |