DOI:
10.1039/C7RA07085C
(Paper)
RSC Adv., 2017,
7, 42634-42640
Orange phosphor Li2SrSiON2:Eu2+ for blue light chip based warm white LEDs†
Received
26th June 2017
, Accepted 21st August 2017
First published on 4th September 2017
Abstract
Oxynitride Li2SrSiON2 was synthesized by introducing N3− into the Li2SrSiO4 lattice, which is suitable for Eu2+ doping. It crystallizes in an trigonal structure with the space group of P3121 (152) and cell parameter a = b = 5.0131(0) Å, c = 12.4270(1) Å and V = 270.46 Å3. Under blue light (450 nm) excitation, the representative sample Li2Sr0.98SiON2:0.02Eu2+ exhibits a bright broad band orange emission peaking at 586 nm with an external quantum efficiency of 52.7%. Its emission intensity at 150 °C remained 78% of that measured at 25 °C. Warm white light-emitting diode 1 (W-LED1) was prepared by combining a blue LED chip and LSSON:0.02Eu2+. High color rendering index (Ra ∼ 90) warm W-LED2 was fabricated by combing a blue light chip, BaSi2O2N2:Eu2+, and Li2Sr0.98SiON2:0.02Eu2+. The chromaticity coordinate and correlated color temperature (CCT) of W-LED2 are (0.3625, 0.3539) and ∼4386 K, respectively. Excellent optical properties allow it to be an attractive orange phosphor for warm W-LEDs.
1. Instruction
White light-emitting diodes (W-LEDs) have been regarded as the next generation light source because of their low power consumption, high brightness, high efficiency, longer life, and environmental friendliness.1–3 Although UV/NUV pumped chips with a phosphor blend of RGB-emitting phosphors can obtain white light with tunable color temperature and high color rendering, and it is very easy to obtain UV/NUV light excited blue/green/red phosphors in Ce3+/Eu2+ doped compounds, the poor efficiency of the UV/NUV LED chips and re-absorption of different phosphors have been commonly encountered. In addition, UV/NUV light is harmful to human skin and eyes.4–6 Therefore, blue light chip excited W-LEDs are considered as healthier, energy-saving, and environmentally friendly lighting sources.7–10 A mature production route is the combination of blue light chip and yellow phosphor (Y,Gd)3(Al,Ga)5O12:Ce3+ (YAG:Ce3+). While low color rendering index (Ra ∼ 75) and high correlated color temperature (CCT ∼ 7000 K) are presented in this combination due to insufficiency of red component in the spectrum. These characteristics resulting in limited application areas, such as indoor lighting, commercial lighting, etc. Two main schemes have been developed to fabricate W-LEDs containing sufficient red component: one is optical properties improvement of YAG phosphor via composition variation.11–13 And the other is adding red nitride phosphor (M2Si5N8:Eu2+,Sr[LiAl3N4]:Eu2+ or CaAlSiN3:Eu2+) into the combination of blue chip and YAG phosphor.7,14–16 In principle, the combination of blue light chip and orange phosphor (contain sufficient red component) is the most direct method to obtain warm white light.17–19 Moreover, incorporation with green phosphors can significantly improve rendering color index (Ra). Although efficient green phosphors suitable for blue light chip have been realized in Eu2+ doped oxynitridosilicates: MSi2O2N2:Eu2+ (M = Ca, Sr, Ba),20 M-α/β-SiAlON:Eu2+ (M = Mg, Ca, Sr, Ba), efficient orange conversion under blue light excitation is still scarce at present,21,22 which still needs to involve more effort. Nitridation of Ce3+/Eu2+ doped oxides, and the oxydation of Ce3+/Eu2+ doped nitrides should be the primary consideration.
For activator ions Ce3+/Eu2+, their 5d electrons unshielded from the crystal field by the 5s and 5p electrons when in the excited state, the spectra properties are strongly affected by the surrounding environment. Owing to N3− has a higher effective charge compared with O2−, and Pauling's electron negativity of N (3.04) is smaller than that of O (3.50).19–22 Coordinating with N3− would cause a stronger nephelauxetic effect and bigger crystal field splitting. When N3− was introduced into Ce3+/Eu2+ doped oxide, wavelength of emission peak generally takes place red-movement.8 Moreover, most of the pure nitride phosphors have excellent thermal stability owing to their structure framework consisted of rigid [SiN4] tetrahedrals. At present, pure silicon nitride phosphors are synthesized in a critical condition with expensive raw materials. While Li2SiN2:Eu3+ is an exception,23 which was synthesized at 900 °C, as mild as oxide counterparts.24–27 So novel lithium-containing oxynitride phosphors can be synthesized in a mild condition by introducing N into oxide phosphors. Among lithium-containing oxide phosphors, Li2SrSiO4:Eu2+ was reported to an intensely yellow phosphor peaking at 570 nm.26,27 Shortage of its luminescence properties are insufficient red component in spectrum and weak thermal stability, indicating that it to be a good target for nitridation.
Based on above investigation, Eu2+ doped oxynitride luminescence materials with chemical compositions (Li2Sr1−xSiON2:xEu2+) LSSON:xEu2+ were designed and synthesized. Crystal structure of host LSSON were studied. Photo-luminescence (PL) properties of representative sample were investigated systemically. In addition, W-LEDs have been fabricated and the corresponding electroluminescence (EL) properties were measured to evaluate its application performance. As expected, representative sample LSSON:Eu2+ can serve as an attractive orange phosphor for blue light chip based warm W-LEDs.
2. Materials and synthesis
Powder samples Li2Sr1−xSiON2:xEu2+ were synthesized by using stoichiometric amounts of raw materials of Li2CO3 (A.R), SrCO3 (A.R), SiO2 (A.R), Si3N4 (A.R) and Eu2O3 (A.R). Excess of Li2CO3 (3 wt%) was added, because Li2CO3 is easy to volatilize at high temperature, causing large number of vacancies in host and weaken luminescence efficient of Eu2+ ion. Meantime, Li2CO3 could also act as a co-solvent to improve the crystallinity of samples. The mixture was placed in a ceramic crucible and fired at 800 °C (with a heating rate of 5 °C min−1) for 4 h, then cooling down to 500 °C (with a cooling rate of 5 °C min−1). Whole sintering process was conducted in a reductive atmosphere of 90/10 (volume) N2/NH3.
3. Characterization
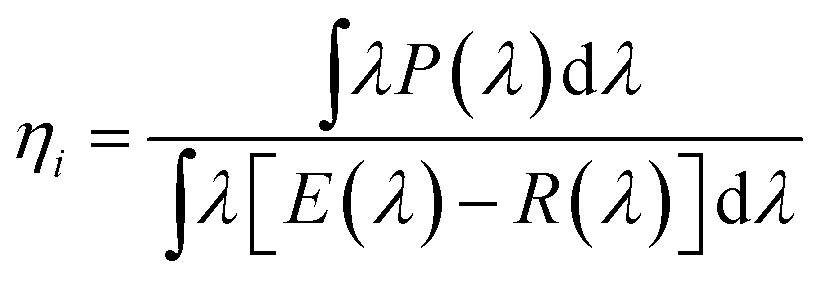
Phase purity was confirmed by X-ray power diffraction (XRD) on a Rigaku D/Max-2400 X-ray diffractometer using Ni-filtered Cu Kα radiation. Rietveld refinement was performed by using General Structure Analysis System (GSAS) package. The sample morphology was examined by using scanning electron microscopy (SEM; Hitachi S-4800). Element composition and microstructure were measured on a FEI Tecnai 35 F30 transmission electron microscopy (TEM, FEI Tecnai F30, operated at 300 kV) equipped with an energy dispersive X-ray spectroscopy (EDX). Internal (ηi) quantum efficiencies (QE) was calculated by using the following eqn (1):28| |
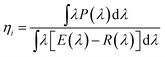 | (1) |
where E(λ)/hν, R(λ)/hν, and P(λ)/hν are the numbers of photons in the spectrum of excitation, reflectance, and emission, respectively. Room-temperature and temperature-dependent PL spectra were recorded on a FLS-920T fluorescence spectro-photometer with a 450 W Xe lamp for excitation and a standard TAP-02 to control the temperature. The diffuse reflectance spectra (DRS) were measured on PE lambda 950 UV-vis spectrophotometer by using Ba2SiO4 power as the reference. PL decay curves were measured with a FLS-920T fluorescence spectro-photometer with a F900 ns (μF900 microsecond) flash lamp used as the light source. W-LED1 was prepared by using blue light chip (∼450 nm, P/N 046VB-S-FA1) and as-prepared LSSON:0.02Eu2+. W-LED2 was prepared by using blue light chip, BaSi2O2N2:Eu2+ and LSSON:0.02Eu2+. EL spectra, Ra values, CCT, and Commission Internationale de l'Eclairage (CIE) chromaticity coordinates were measured using a SphereOptics integrating sphere with LED measurement starter packages.
4. Results and discussion
4.1 Phase identification and morphology observation
To confirm phase-pure Li2SrSiON2 solid solution is the optimal host, Rietveld refinement was conducted based on single crystal data of Li2SrSiO4 (ICSD-167334). The experimental, calculated, and difference results of Rietveld refinement are given in ESI Fig. S1.† A exact match was yielded by refining atomic positions, temperature-dependent factor and profile parameters. Refined crystallographic data was listed in ESI Tables S1 and S2,† respectively. Information in Table S2† shows that the N3− ion content is about 67 percent of all anions. Corresponding cell parameters are a = b = 5.0131(0) Å, c = 12.4270(1) Å and V = 270.46 Å3, which are smaller than that of Li2SrSiO4: a = b = 5.0228(0) Å, c = 12.4552(1) Å and V = 272.13 Å3. Reason of lattice contract is that N3− ionic radii is smaller than O2−. SEM observation in Fig. 1a shows that Li2SrSiO4−1.5zNz powers have a good dispersibility. TEM image in Fig. 1b gives the selected grain with ideal morphology. EDX spectrum in Fig. 1c reveals that chemical compositions of the selected grain are Sr, Si, O, N. And no impurity elements exist. Li is not included due to it belongs to the light element and can not be detected by the TEM detector. Quantitative analyses using EDX showed that N3−/O2− ions ratio basically match with the refined ratio in Table S2† (about 67%), indicating that designed compound can be written as Li2SrSiON2 (LSSON). Inter-planar spacing in Fig. 1d was measured to be ∼0.5013 nm, match with refined inter planar distance (100) and (010). In ESI Fig. S2,† no detectable XRD peaks corresponding to impurities exist in the XRD spectra of LSSON:xEu2+ solid solutions, indicating that single phase solid solutions were obtained. Owing to radius of Eu2+ [R = 1.25 Å, CN = 8] is close to Sr2+ [R = 1.26, CN = 8], peak location has no obvious shift with the increase of Eu2+ ion concentration.
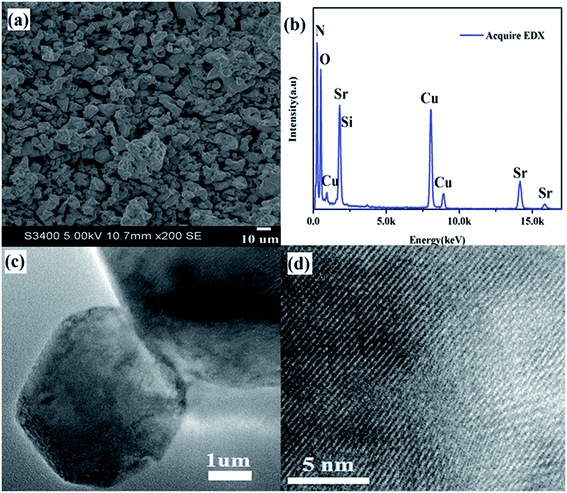 |
| | Fig. 1 (a) SEM image, (b) EDX spectrum, (c) TEM image, (d) HRTEM image of LSSON. | |
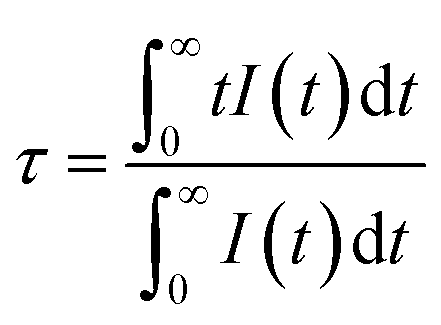
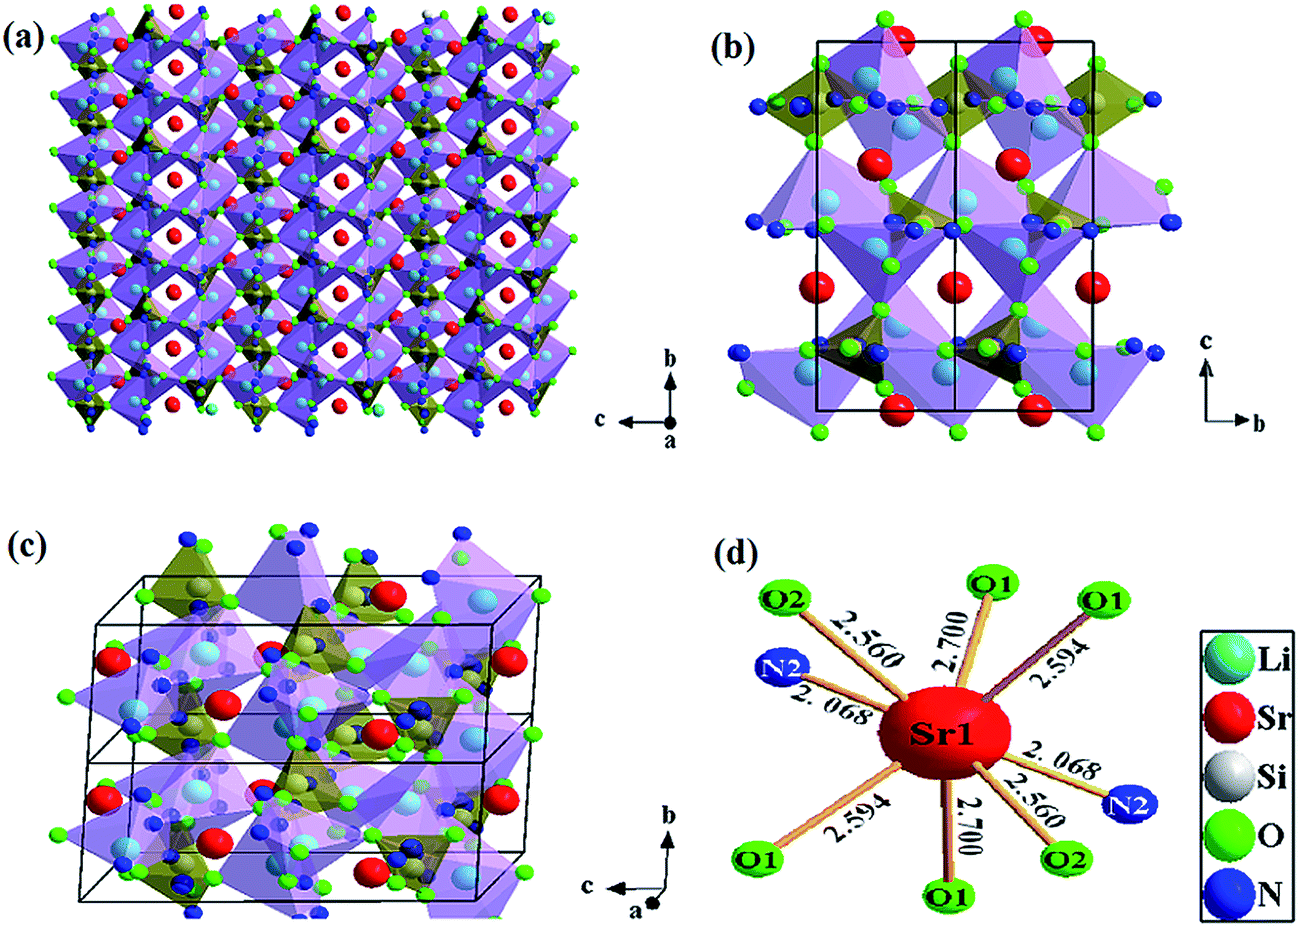
There is a structure overview of LSSON lattice presented in Fig. 2, along the [100] direction (Fig. 2a), a condensed crystal networks structurally built upon three dimensional Si(O,N)4 tetrahedrons layers interleaving connection to Li(O,N)4 tetrahedrons layers. Sr2+ residing in triangle voids (60%) and quadrangle voids (40%). Viewed along [100] and [201], rigid framework of crystal cell (Fig. 2b and c) consists of orderly edge-shared Li(O,N)4 tetrahedrals and corner-shared Si(O,N)4 tetrahedrals. All Sr2+ coordinated by six O2− and two N3−, and reside in the 3c site, as shown in Fig. 2d. Mean Sr–O/N bond length is about 2.481Å, and mean Sr2+ – Sr2+ distance is about 5.014 Å. It is also noticed that N2 located around Sr2+, while N1 located near Li+ and Si4+. Eu2+ is expected to replace Sr2+, as the ions radii of Eu2+ (1.25 Å) and Sr2+ (1.26 Å) are almost identical.29 To support that one crystallographic site of Eu2+ in LSSON, decay curve of LSSON:0.02Eu2+ excited at 450 nm and monitored at 586 nm was measured which given in ESI Fig. S3.† Thus, it can be well fitted by single exponential eqn (2), indicating that only one crystallographic site of Eu2+ existed in the process of decay.30
| |
I = I0![[thin space (1/6-em)]](https://www.rsc.org/images/entities/char_2009.gif) exp(−t/τ) exp(−t/τ)
| (2) |
where
I and
I0 are the luminescence intensity;
t is time; and
τ is the lifetime for the exponential component. The efficient decay time (
τ) can be obtained by the following
eqn (3). And the lifetime of Eu
2+ ions in LSSON:0.02Eu
2+ was calculated to be 1.051 μs. It falls in the range of radiative lifetime of Eu
2+ ion in most hosts (0.2–2.0 μs):
31,32| |
 | (3) |
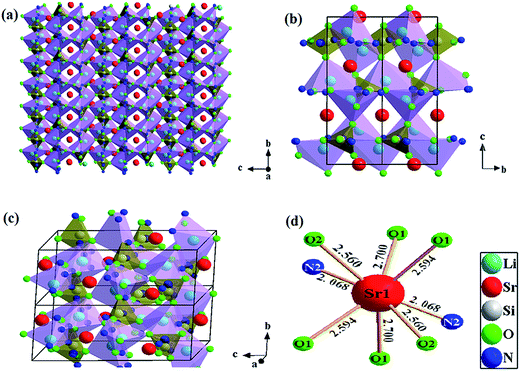 |
| | Fig. 2 Structure overview of LSSON lattice viewed along (a) and (b) [100] and (c) [201], (d) coordination environments of Sr site. | |
4.2 Optical properties
Optical properties of LSSON:Eu2+ are showed in Fig. 3, including UV-visible DRS, PL(E) spectra, and EL spectra of self-packaged W-LEDs. In Fig. 3a, an absorption band in the range of 200–300 nm is observed in DRS of un-doped LSSON, which comes from the optical band gap of LSSON. For LSSON:0.02Eu2+ with orange body color, two absorption bands present in the spectrum range of 200–300 and 300–500 nm, respectively. First one ascribe to the optical band gap of LSSON. While the second one assign to the 4f → 5d transition of Eu2+, and correspond to its PLE spectrum.
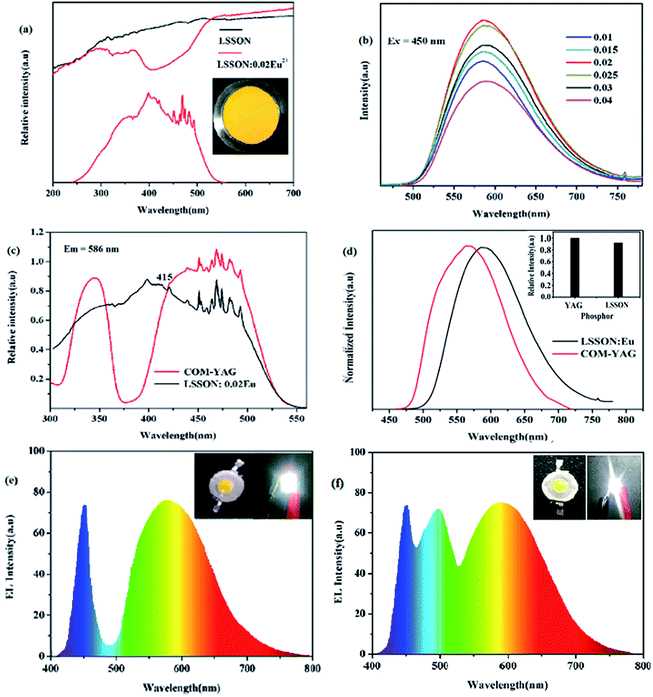 |
| | Fig. 3 (a) DRS of LSSON and LSSON:0.02Eu2+, together with excitation spectrum and body color of LSSON:0.02Eu2+ (b) emission spectra of LSSON:xEu2+ (0.01 ≦ x ≦ 0.04) with various Eu2+ concentration under 450 nm excitation. Comparison of (c) excitation (monitored at 586 nm) and (d) emission (excited at 450 nm) spectra of LSSON:0.02Eu2+ and commercial YAG:Ce3+ (YAG04, Intematix). (e) EL spectrum of W-LED1 composed of blue LED chip (∼450 nm, P/N 046VB-S-FA1) and LSSON:0.02Eu2+, (f) EL spectrum of W-LED2 composed of blue LED chip (∼450 nm, P/N 046VB-S-FA1), BaSi2O2N2:Eu2+ and LSSON:0.02Eu2+. | |
PL spectra of LSSON:xEu2+ (0.01 ≦ x ≦ 0.04) under 450 nm excitation are showed in Fig. 3b. All of emission spectra cover a wide spectra region ranging from 550 nm to 700 nm. As Eu2+ ions content increased, luminescence intensity was increasing and reached a maximum at x = 0.02. Then concentration quenching phenomenon occurred caused by non-radiative energy transfer between activator ions.33 The optimal sample LSSON:0.02Eu2+ exhibits a bright orange emission peaking at 586 nm with a wide full-width at half-maximum (∼110 nm) and an external quantum efficiency of 52.7%. In addition, the emission peak position was redshifted from 585 nm to 588 nm as the Eu2+ ion concentration increases (ESI Fig. S4a†). Generally, there are two possible reasons for the redshift: one is the increased crystal field splitting of Eu2+ ion. The other is re-absorption. In our case, the shrink of single cell can be ignored as Eu2+ concentration increases, as well as the change of bond length, co-valency, and symmetry. Therefore, the increase of crystal field splitting can be ignored. Red-shift of emission peak should be ascribed to re-absorption.
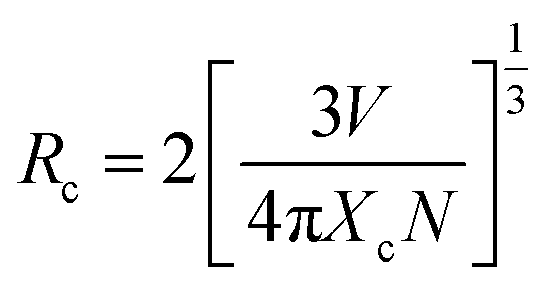
To validate this deduction, critical distance (Rc) between Eu2+ of non-radiative energy transfer need to be estimated. Blasse proved that Rc has relationship with critical concentration of activator ions, as shown in eqn (4):34
| |
 | (4) |
where
V is the unit cell volume,
N is the number of Eu
2+ sites per unit cell, and
Xc is the critical concentration of Eu
2+.
Rc was calculated to be 20.51 Å by using parameter values:
V = 270.59(0) Å
3,
Xc = 0.02,
N = 3, which much bigger than the measured Sr
2+–Sr
2+ distance, indicating that non-radiative energy transfer can be easy to happen and quenching concentration are small (
Xc = 0.02). Together with small overlap between PLE and PL spectra, energy transfer mechanism could be dominated by electrostatic interaction, and estimated by
eqn (5):
34| | |
I/x = K[1 + β(x)θ/3] − 1
| (5) |
where
I is the emission intensity,
x is the activator ions concentration,
K and
β are constants in a given host,
θ is an indication of electric multipolar character with
θ = 6, 8, 10 corresponding to dipole–dipole, dipole–quadrupole, or quadrupole–quadrupole interactions, respectively. In ESI Fig. S4b,
† the emission intensity (
I) and corresponding Eu
2+ ion concentration are linear fitted. The slope [log(
I/
x)/log(
x)] is about −1.735 = −(
θ/3) ≈ −2, and
θ value is close to 6. So concentration quenching mechanism is dominated by dipole–dipole interaction.
Comparison between LSSON:0.02Eu2+ and commercial YAG:Ce3+ (YAG04, Intematix) are shown in Fig. 3c and d. PLE spectrum of LSSON:0.02Eu2+ is obviously wider than YAG:Ce3+. Under 450 nm excitation, its PL intensity is about 92% of that of YAG:Ce3+. More importantly, its emission spectrum contains more red component than YAG:Ce3+, which is highly desirable for high quality warm white light applications. To further evaluate application performance of phosphor LSSON:0.02Eu2+, W-LED1 was prepared by combining blue LED chip and LSSON:0.02Eu2+. Its EL spectrum driven by 300 mA current was measured, as shown in Fig. 3e. The corresponding CIE chromaticity, CCT, and Ra were calculated to be (0.3945, 0.383), 3687 K, and 71, respectively. W-LED1 exhibits warm white light, while color rendering index Ra < 75 owing to lack of blue-green component (470–520 nm). Then W-LED2 was prepared by combining blue LED chip, BaSi2O2N2:Eu2+ and LSSON:0.02Eu2+. Its EL spectrum also driven by 300 mA current [Fig. 3f]. The corresponding CIE chromaticity, CCT, and Ra were calculated to be (0.3625, 0.3539), 4386 K, and ∼90, respectively. Those parameters demonstrate that sample LSSON:0.02Eu2+ can be used in warm W-LEDs for indoor lighting.
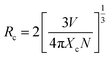
Heat, generated in LED chip, generally reaches ∼150 °C. Thus the thermal stability is a key parameter of a phosphor used in LEDs. Temperature dependent PL spectra of LSSON:0.02Eu2+ under 450 nm excitation are shown in Fig. 4a. In addition, comparison of thermal stability between LSSON:0.02Eu2+ and YAG:Ce3+ was conducted. With rising of temperatures, blue-shift of emission peak can be observed, which ascribed to thermally active phonon-assisted tunneling from excited states of lower-energy emission band to those of higher energy emission band.34 Meanwhile, emission intensity is gradually decreasing, which caused by thermally activated cross-over from the 4f65d-excited state to the 4f7 ground state. By increasing temperature up to 150 °C, emission intensity remain at 78% of that measured at room temperature. LSSON:0.02Eu2+ has good thermal stability and better than the reported orange phosphors.17,18,33 Good thermal stability generally correspond to rigid lattice. Then degradation behavior of LSSON:0.02Eu2+ were measured to evaluate its structure stability [Fig. 4b]. Under high energy electron beam continuous excitation (5 kV), emission peak remain stable through the whole excitation progress. Emission intensity remain 88% of that measured at the beginning after continuous electrons excitation for 90 min (inserted figure). The CIE coordination in Fig. 4c is nearly unchanged. Above results reveal that LSSON:0.02Eu2+ has stable lattice.
 |
| | Fig. 4 (a) Temperature dependence of PL spectra of LSSON:0.02Eu2+excited at 450 nm. The inset shows PL intensity variation of LSSON:0.02Eu2+ and YAG:Ce3+ as a function of temperature. (b) CL spectra (insets show the dependence of the emission intensity of LSSON:0.02Eu2+ on time) (c) CIE coordinates of LSSON:0.02Eu2+ phosphor as a function of probe current under 5 kV voltage and 50 mA filament current. (d) Chromaticity coordinates of LSSON:0.02Eu2+ and commercial YAG:Ce3+. And CIE chromaticity of emission from W-LEDs. | |
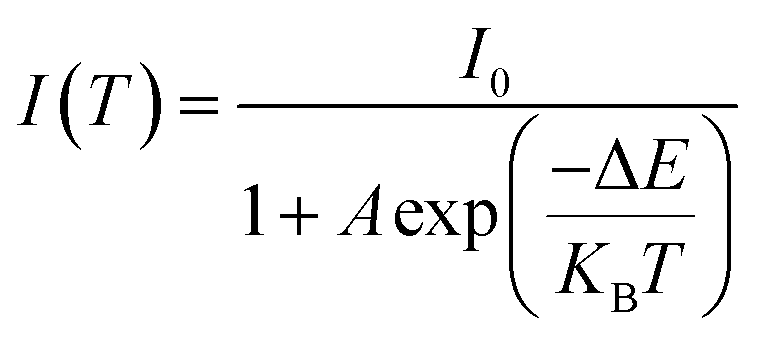
The activation energy for thermal quenching can be estimated by following eqn (6):35
| |
 | (6) |
where
I0 is the initial intensity,
I(
T) is the intensity at
T °C,
A is a constant, Δ
E is the activation energy for thermal quenching, and
KB is the Boltzmann's constant. As calculated in Fig. S4,
† Δ
E for LSSON:0.02Eu
2+ and YAG:Ce
3+ are 0.2185 eV and 0.2663 eV, respectively. Activation energy Δ
E of YAG:Ce
3+ is higher than that of LSSON:0.02Eu
2+. This result indicates YAG:Ce
3+ has a better thermal stability.
36 At last, the calculated CIE color coordinates were used to characterize the emission of LSSON:0.02Eu
2+, YAG:Ce
3+, and W-LEDs [see in
Fig. 4d]. Under 450 nm excitation, chromaticity coordinates of LSSON:0.02Eu
2+ and YAG:Ce
3+ are (0.5194, 0.4765) and (0.4363, 0.5362),respectively. Larger
x value correspond to more red component. Chromaticity coordinates of W-LED1 and W-LED2 are (0.3945, 0.383) and (0.3625, 0.3539), respectively. They both locate in the warm white zone.
5. Conclusion
Oxynitride host LSSON for Eu2+ doping was synthesized by using N3− partially substitute for O2− in Li2SrSiO4 lattice. Its rigid framework consists of edge-shared Li(O,N)4 tetrahedrals and corner-shared Si(O,N)4 tetrahedrals. Under 450 nm excitation, LSSON:0.02 Eu2+ exhibits a intense broad band orange emission peaking at 586 nm and with CIE coordinate of (0,5194, 0,4765). Emission intensity remain at 78% at 150 °C of that measured at room temperature. High color rendering index (Ra ∼ 90) warm W-LED was syntesized by combing of blue LED chip, BaSi2O2N2:Eu2+ and LSSON:0.02Eu2+. Corresponding chromaticity coordinates and CCT are (0.3625, 0.3539) and 4386 K, respectively. Above results indicate that the synthesized LSSON:0.02Eu2+ can be used as an orange phosphor for blue light chip based warm W-LEDs.
Conflicts of interest
There are no conflicts to declare.
Acknowledgements
This work is supported by the National Natural Science Funds of China (Grant no. 51372105), and the Gansu Province development and reform 181 commission (NDRC) no. 2013,1336, National Natural Science Foundation of China (51502122).
References
- Nobelprize.org. Nobel Media AB 2014, “The Nobel Prize in Physics 2014”, 2014.
- W. Y. Huang, F. Yoshimura, K. Ueda, Y. Shimomura, H. S. Sheu, T. S. Chan, C. Y. Chiang, W. Z. Zhou and R. S. Liu, Chem. Mater., 2014, 26, 2075–2085 CrossRef CAS.
- W. Y. Huang, F. Yoshimura, K. Ueda, Y. Shimomura, H. S. Sheu, T. S. Chan, H. F. Greer, W. Zhou, S. F. Hu, R. S. Liu and J. P. Attfield, Angew. Chem., Int. Ed., 2013, 52, 8260–8264 CrossRef.
- H. J. Song, D. K. Yim, H. S. Roh, I. S. Cho, S. J. Kim, Y. H. Jin, H. W. Shim, D. W. Kim and K. S. Hong, J. Mater. Chem. C, 2013, 1, 500 RSC.
- S. P. Lee, C. H. Huang, T. S. Chan and T. M. Chen, ACS Appl. Mater. Interfaces, 2014, 6, 7260–7267 CAS.
- Z. G. Xia, J. Q. Zhuang and L. B. Liao, Inorg. Chem., 2012, 51, 7202–7209 CrossRef CAS PubMed.
- R. J. Xie and N. Hirosaki, Adv. Mater., 2007, 8, 588–600 CAS.
- Z. Y. Zhao, Z. G. Yang, Y. R. Shi, C. Wang, B. T. Liu, G. Zhu and Y. H. Wang, J. Mater. Chem. C, 2013, 1, 1407–1412 RSC.
- H. M. Zhu, C. C. Lin, W. Q. Luo, S. T. Shu, Z. G. Liu, Y. S. Liu, J. T. Kong, E. Ma, Y. C. Cao, R. S. Liu and X. Y. Chen, Nat. Commun., 2014, 4312, 891–896 Search PubMed.
- P. Pust, V. Weiler, C. Hech, A. Tücks, A. S. Wochnik, A. K. Hen, D. Wiechert, C. Scheu, P. J. Schmidt and W. Schnick, Nat. Mater., 2014, 13, 891–896 CrossRef CAS PubMed.
- L. Chen, X. L. Chen, F. Y. Liu, H. H. Chen, H. Wang, E. L. Zhao, Y. Jiang, T. S. Chan, C. H. Wang, W. H. Zhang, Y. Wang and S. F. Chen, Sci. Rep., 2015, 5, 1–17 CAS.
- M. Raukas, K. K. Bergenek, G. C. Wel, N. M. Zink and S. Lange, US patent 2012/0018673 A1, 2012.
- I. G. Chen, Y. T. Nien, H. J. Lu and C. W. Ma, US Patent: US 9,085,733 B2, 2015.
- P. Pust, V. Weiler and C. Hecht, et al., Nat. Mater., 2014, 13, 891–896 CrossRef CAS PubMed.
- M. Zeuner, F. Hintze and W. Schnick, Chem. Mater., 2008, 21, 336–342 CrossRef.
- M. Fujinaga, T. Ueda, T. Sakai and S. Jida, US Patent:US9,023,240,B2, 2015.
- W. B. Park, S. P. Singh, C. Yoon and K. S. Sohn, J. Mater. Chem. C, 2013, 1, 1832–1839 RSC.
- Q. Q. Zhu, L. Wang, N. Hirosaki, L. Y. Hao, X. Xu and R. J. Xie, Chem. Mater., 2016, 28, 4829–4839 CrossRef CAS.
- K. Horky and W. Schnick, Chem. Mater., 2017, 10, 5–13 Search PubMed.
- V. Bachmann, C. Ronda, O. Oeckler, W. Schnick and A. Meijerink, Chem. Mater., 2009, 21, 316–325 CrossRef CAS.
- J. H. Ryu, H. S. Won, Y.-G. Park, S. H. Kim, W. Y. Song, H. Suzuki, C.-B. Yoon, D. H. Kim, W. J. Park and C. Yoon, Electrochem. Solid-State Lett., 2010, 13, H30–H32 CrossRef CAS.
- Y. F. Kargin, N. S. Akhmadullina, A. S. Lysenkov, A. A. Ashmarin, A. V. Ishchnko, L. V. Viktorov, O. S. Teslenko, B. V. Shul’gin and A. V. Spirina, Inorg. Mater., 2012, 48, 827–831 CrossRef CAS.
- J. Y. Ding, Y. Y. Li, Q. S. Wu, Q. Long, C. Wang and Y. H. Wang, J. Mater. Chem. C, 2015, 3, 8542–8549 RSC.
- L. H. Jiang, Y. L. Zhang, C. Y. Li, J. Q. Hao and Q. Su, Mater. Lett., 2007, 61, 5107–5109 CrossRef CAS.
- H. Yu, D. G. Deng, S. Q. Xu, C. P. Yu, H. Y. Yin and Q. L. Nie, J. Lumin., 2012, 132, 2553–2556 CrossRef CAS.
- C. Kulshreshtha, A. K. Sharma and K. S. Soh, J. Electrochem. Soc., 2009, 156, J52–J56 CrossRef CAS.
- M. P. Saradhi and U. V. Varadaraju, Chem. Mater., 2006, 18, 5267–5272 CrossRef CAS.
- P. P. Dai, C. Li, X. T. Zhang, J. Xu, X. Chen, X. L. Wang, Y. Jia, X. J. Wang and Y. C. Liu, Light: Sci. Appl., 2016, 5, 16024 CrossRef.
- J. Y. Han, W. B. Im, G. Y. Lee and D. Y. Jeon, J. Mater. Chem., 2012, 22, 8793–8798 RSC.
- Y. H. Kim, P. Arunkumar, B. Y. Kim, S. Unithrattil, E. Kim, S. H. Moon, J. Y. Hyun, K. H. Kim, D. Lee, J. S. Lee and W. B. Im, Nat. Mater., 2017, 16, 543–550 CrossRef CAS PubMed.
- J. Zhou, Z. G. Xia, M. X. Yang and K. Shen, J. Mater. Chem., 2012, 22, 21935 RSC.
- L. Wang, X. J. Wang, T. Takeda, N. Hirosaki, Y. T. Tsai, R. S. Liu and R. J. Xie, Chem. Mater., 2015, 27, 8457–8466 CrossRef CAS.
- P. Dorenbos, J. Phys.: Condens. Matter, 2005, 17, 8103–8110 CrossRef CAS.
- W. Z. Sun, Y. L. Jia, R. Pang, H. F. Li, T. F. Ma, D. Li, J. P. Fu, S. Zhang, L. H. Jiang and C. Y. Li, ACS Appl. Mater. Interfaces, 2015, 7, 25219–25226 CAS.
- H. Liu, L. Chen, X. F. Zhou, R. H. Liu and W. D. Zhuang, J. Solid State Chem., 2017, 246, 145–149 CrossRef.
- Q. Y. Shao, Y. Dong, J. Q. Jiang, C. Liang and J. H. He, J. Lumin., 2011, 131, 1013–1015 CrossRef CAS.
Footnote |
| † Electronic supplementary information (ESI) available. See DOI: 10.1039/c7ra07085c |
|
| This journal is © The Royal Society of Chemistry 2017 |
Click here to see how this site uses Cookies. View our privacy policy here. 
 Open Access Article
 This Open Access Article is licensed under a Creative Commons Attribution-Non Commercial 3.0 Unported Licence
 *abc
*abc