
 Open Access Article
 This Open Access Article is licensed under a
 Creative Commons Attribution 3.0 Unported Licence
The influence of charge compensation defects on the spectroscopic properties of europium doped Ca9Y(PO4)7
N. Górecka*a,
K. Szczodrowski *a,
A. Lazarowskaa,
J. Barzowskaa,
D. Michalikb and
M. Grinberga
*a,
A. Lazarowskaa,
J. Barzowskaa,
D. Michalikb and
M. Grinberga
aInstitute of Experimental Physics, Faculty of Mathematic, Physics and Informatics, Gdańsk University, Wita Stwosza 57, Gdańsk, Poland. E-mail: fizks@ug.edu.pl; natalia.gorecka@ug.edu.pl
bSilesian University of Technology, Department of Materials Science, Krasinskiego 8, 40-019 Katowice, Poland
First published on 21st August 2017
Abstract
In this study, a series of Ca9Y(PO4)7 compounds doped with 5% of Eu ions and with different [Y]/[Ca] ratios was synthesized using the Pechini method. Due to the presence of two different cations in the studied matrix (Ca2+ and Y3+) that are available for europium substitution, the synthesis parameters were selected to obtain the incorporation of the europium ions (5% mol) into the calcium sites only. The phase composition as well as elemental analysis and the spectroscopic measurements, carried out before and/or after the reduction of Eu3+ were performed to characterize the obtained phosphors. The XRD patterns show that in all cases the obtained materials consist of pure phase of Ca9Y(PO4)7. PLE and PL spectra measured before the reduction indicate that for the materials with the excess of yttrium, an additional Eu3+ site is observed which was not observed for materials with a deficiency of yttrium. For samples obtained after the reduction, the luminescence of Eu2+ depends on the changes of the Y/Ca ratio. The observed differences in Eu2+ luminescence are discussed taking into account the creation of different compensation defects depending on change of the Y/Ca ratio.
Introduction
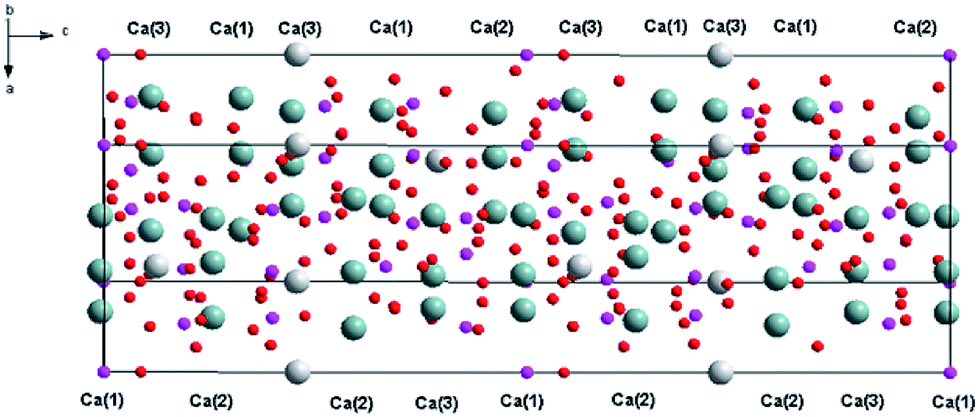
Recently, white light emitting diodes (w-LED) have become a very popular source of light. They are characterized by high efficiency, long lifetime and environmental friendliness. There are several methods that are used to obtain white LEDs. One of the methods consists of a combination of a near-UV LED with red, green and blue phosphors. This method is very appealing because of the great colour rendering index of obtained materials and lower production cost. Thus, the investigations on tricolour phosphors which are suitable for excitation at the near UV-region receive great attention because of their important applications in lighting. Selection of a host that can be activated by different ions emitting in different regions of the spectrum is a very important part of LED design. The widely studied hosts of phosphors are based on borates, phosphates, aluminates, silicates, vanadates, etc.1–6 Among them, phosphates have been paid intense attention due to their excellent properties.7 One of the promising materials in phosphates family is Ca9Y(PO4)7, which has two different cations (Ca2+ and Y3+) that are available for lanthanides substitution.8–11 This material doped with Eu2+ and Eu3+ ions simultaneously consists of two components that are essential to achieve the emission of white light. Ca9Y(PO4)7 belongs to the whitlockite family and can be described by the general formula: Ca9R(PO4)7, where R = Ln, Pr, Eu, Tb, Dy, Ho, Er, Y, Bi, Al, Lu.12–18The structural model of Ca9Y(PO4)7 was proposed by Golubev and Lazoryak19 and the representation of the unit cell and coordination of the cation sites in Ca9Y(PO4)7 are shown in Fig. 1 and 2, respectively.13,14,17,20
 | ||
| Fig. 1 Representation of the Ca9Y(PO4)7 supercell. | ||
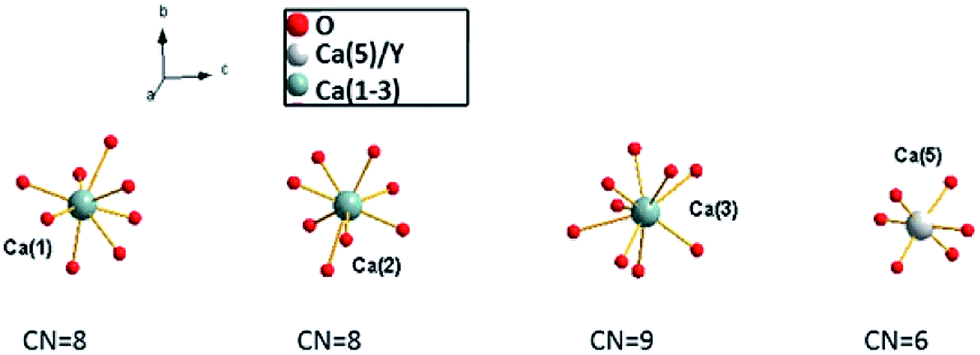 | ||
| Fig. 2 Coordination of Ca(1), Ca(2), Ca(3) and Ca(5)/Y sites. | ||
Because the crystallographic structure of Ca9Y(PO4)7 is isostructural to the β-Ca3(PO4)2, the cation sites in Ca9Y(PO4)7 are usually defined in basis of structure of Ca3(PO4)2.13,15 The crystal lattice of β-Ca3(PO4)2 has five different cation sites: seven coordinated Ca(1) positions, eight coordinated Ca(2) and Ca(3) positions, three coordinated Ca(4) positions, which are statistically half occupied by the Ca2+ ions and half empty (cation vacancies), and the six coordinated Ca(5) positions, distorted octahedral sites, fully occupied by Ca2+ ions.21,22 Similar situation can be found in Ca9Y(PO4)7 with exception that Ca(3) site is nine coordinated, Ca(5) sites are occupied by the Y3+ ions and all Ca(4) sites are empty (due to the charge imbalance of Ca2+–Y3+ substitution in Ca(5)). The substitution of Ca2+ by the Y3+ ions in Ca(5) sites does not change the space group of the crystallographic structure and Ca9Y(PO4)7 crystallizes in the trigonal R3c (161) space group as in the case of Ca3(PO4)2. Independently of the coordination number, the Ca(1), Ca(2), Ca(3) sites are characterized by the C1 point symmetry, whereas the point symmetry of Ca(5) site is C3. The values of Ca9Y(PO4)7 lattice parameters are as follows: a = 10.4442 Å, c = 37.324 Å, V = 3525.89 Å3, Z = 6.12
This paper describes the synthesis, structural properties and the effect of substitution of calcium by europium ions. The main objectives are focused on the investigation of the relations between the material content (the Y/Ca ratio), compensation of the Eu3+ ions in the Ca2+ sites and the efficiency of the reduction process of the Eu3+. To our best knowledge, although the Ca9Y(PO4)7:Eu3+ material is known, there are no published papers regarding the spectral properties of Ca9Y(PO4)7:Eu3+,Eu2+.
Experimental
Polycrystalline samples of europium doped Ca9Y(PO4)7 with different Y/Ca concentration ratio were synthesized by Pechini method, which is described in details elsewhere.13,23–26 The 5 mol% of europium was substituted into the calcium sites in all cases. To obtain the desired phosphate, the following reagents were used: Ca(NO3)2·4H2O (≥99% Sigma-Aldrich), Y(NO3)3·4H2O (99.999% Sigma-Aldrich), (NH4)2HPO4 (≥99.99% Sigma-Aldrich), and Eu(NO3)3·5H2O (99.9% Sigma-Aldrich), citric acid (Avantor Performance Materials Poland S.A.) and ethylene glycol (Chempur).At first, the citric acid was dissolved in distilled water and the ethylene glycol in the appropriate amount was added to the acid solution (the fixed molar ratio of citric acid and ethylene glycol to total chelate metal cations was 5![[thin space (1/6-em)]](https://www.rsc.org/images/entities/char_2009.gif) :1).23 Then the calcium, yttrium and europium nitrates dissolved in distilled water were added to the obtained acid–glycol solution. During the addition of the reagents, the mixture was subsequently stirred. Finally the aqueous solution of (NH4)2HPO4 was added to the mixture of all substrates. The resulting solution was heated under reflux for about 1 hour and then the excess of solvent was evaporated at 100 °C. Next, the prepared polyester was dried in the temp. of 80 °C for 12 h. After drying, the obtained product was calcined at 1250 °C for 4 h under inert gas atmosphere in the muffle furnace (LHT 04-17, NABERTHERM). Then, the product was cooled, grounded and again calcined at 1250 °C for 4 h in a reducing atmosphere, using a mixture of hydrogen (5 vol%) and nitrogen (95 vol%) in an electrical tubular furnace (PRS 75WM, CZYLOK). The scheme of calcination procedure is shown in Fig. 3. In this way materials: Ca9.45Eu0.05Y0.5(PO4)7 (denoted as Y0.5), Ca9.2Eu0.05Y0.75(PO4)7 (Y0.75), Ca8.95Eu0.05Y1(PO4)7 (Y1), Ca8.45Eu0.05Y1.5(PO4)7 (Y1.5) and Ca7.95Eu0.05Y2(PO4)7 (Y2) were obtained.
:1).23 Then the calcium, yttrium and europium nitrates dissolved in distilled water were added to the obtained acid–glycol solution. During the addition of the reagents, the mixture was subsequently stirred. Finally the aqueous solution of (NH4)2HPO4 was added to the mixture of all substrates. The resulting solution was heated under reflux for about 1 hour and then the excess of solvent was evaporated at 100 °C. Next, the prepared polyester was dried in the temp. of 80 °C for 12 h. After drying, the obtained product was calcined at 1250 °C for 4 h under inert gas atmosphere in the muffle furnace (LHT 04-17, NABERTHERM). Then, the product was cooled, grounded and again calcined at 1250 °C for 4 h in a reducing atmosphere, using a mixture of hydrogen (5 vol%) and nitrogen (95 vol%) in an electrical tubular furnace (PRS 75WM, CZYLOK). The scheme of calcination procedure is shown in Fig. 3. In this way materials: Ca9.45Eu0.05Y0.5(PO4)7 (denoted as Y0.5), Ca9.2Eu0.05Y0.75(PO4)7 (Y0.75), Ca8.95Eu0.05Y1(PO4)7 (Y1), Ca8.45Eu0.05Y1.5(PO4)7 (Y1.5) and Ca7.95Eu0.05Y2(PO4)7 (Y2) were obtained.
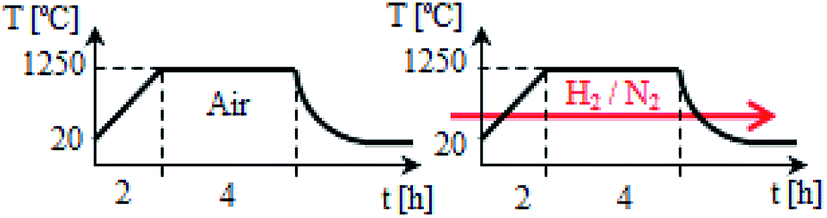 | ||
| Fig. 3 Scheme of the two-step synthesis. | ||
The phase purity of all samples was precisely confirmed using powder X-ray diffraction (XRD) measurements (BRUKER D2PHASER) at the rate of 0.02° and counting time 0.4 s per step in the 2θ range from 20° to 70°, with Cu Kα (Kα: 1.54 Å) operating at 30 kV/10 mA. Luminescence excitation spectra were measured using the Horiba spectrofluorometer (FluoroMax-4P TCSPC) equipped with 150 W xenon lamp and R928 Hamamatsu PMT. Photoluminescence spectra were acquired using Shamrock SR750 D1 grating spectrometer followed by iDus 420 CCD detector (Andor Technology) and the CW He–Cd laser was used as an excitation source. All spectra were carefully corrected taking into account the instrumental response function. Time resolved emission spectroscopy of the samples was performed on an experimental setup consisting of tunable parametric light source PG401/SH pumped by 30 ps pulse YAG:Nd PL laser 2143 A/SS (Ekspla) and 2501S grating spectrometer (Brucker Optics) coupled to C4334-01 streak camera (Hamamatsu) which acquires streak images with the resolution of 640 × 480 points (spectral × temporal). The time ranges available for a measurement span from 10 ms down to 1 ns.27
Elemental analysis was carried out by a Hitachi S-3400N scanning electron microscope (SEM) operated at 25 kV, equipped with an energy-dispersive X-ray Thermo Noran spectrometer (EDS). To determine the average composition of the specimen, the powders were applied on a graphite conductive tape suitable for high vacuum to obtain a flat layer. The analysis was performed in 250 × 250 μm area three times in various parts of the samples. Presented results were calculated as an average value from the measurements.
Results and discussion
The XRD patterns of europium doped samples obtained before and after the reduction process are shown in Fig. 4. As it can be seen in Fig. 4, regardless of the difference in Y/Ca concentration ratio, the obtained materials are characterized by the pure phase of Ca9Y(PO4)7 (PDF card no. 00-046-0402). The diffraction patterns do not possess signals from additional, impurity phases. Moreover, the introduction of europium ions or the changes of Y/Ca ratio do not cause any significant alteration to the host structure. After the reduction process the phase composition or the structure of the materials is not changed.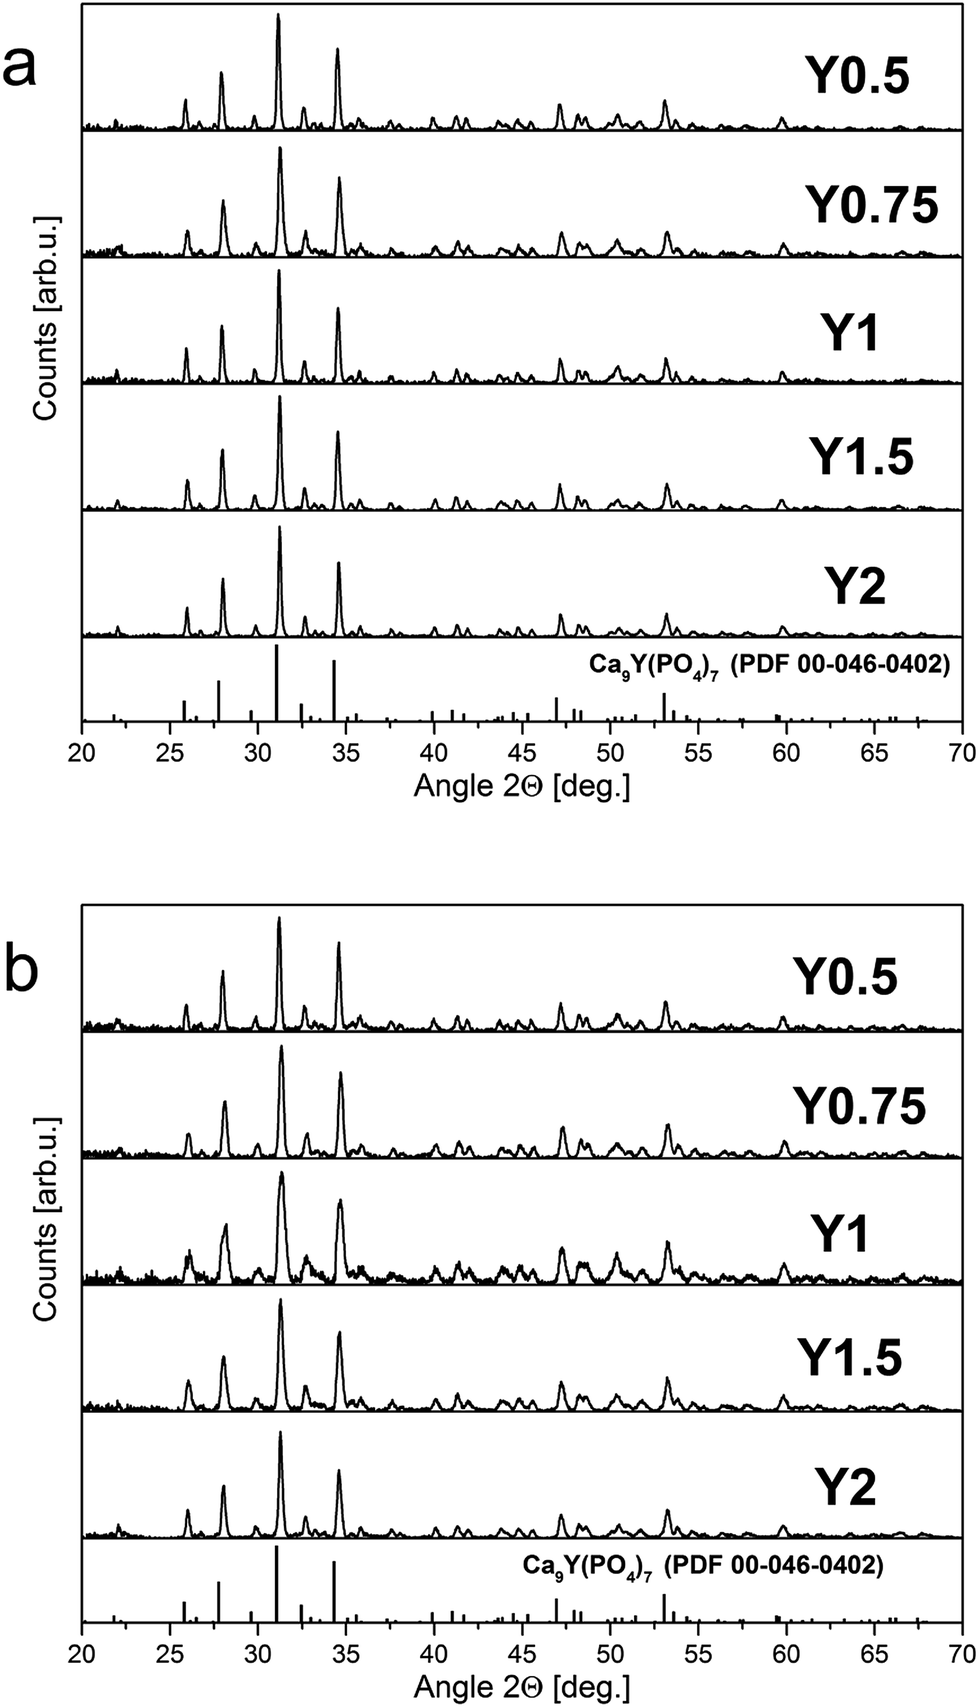 | ||
| Fig. 4 XRD patterns of samples obtained before (a) and after (b) reduction. | ||
Fig. 5 shows the XRD pattern of Y1 sample with the two PDF standards: PDF 00-046-0402 for Ca9Y(PO4)7 and PDF 04-014-2292 for Ca3(PO4)2. As mentioned previously, the crystallographic structure of Ca9Y(PO4)7 is isostructural to the Ca3(PO4)2 and the XRD signals of both phases are identical. Thus, in this case, the XRD method is not sufficient to distinguish these two members of the whitlockite family. To confirm the incorporation of yttrium into the material lattice, the elemental analysis was performed. Table 1 presents the EDX results for the series of materials obtained after the reduction process. As it can be seen, the materials contain the yttrium ions and the concentration of Y3+ increases in order from Y0.5 to Y2. However, in all cases the real concentration is approximately two times lower than assumed. The presence of yttrium ions and the absence of any additional crystal phases of yttrium in the obtained materials confirm that the yttrium ions are incorporated into the crystal lattice.
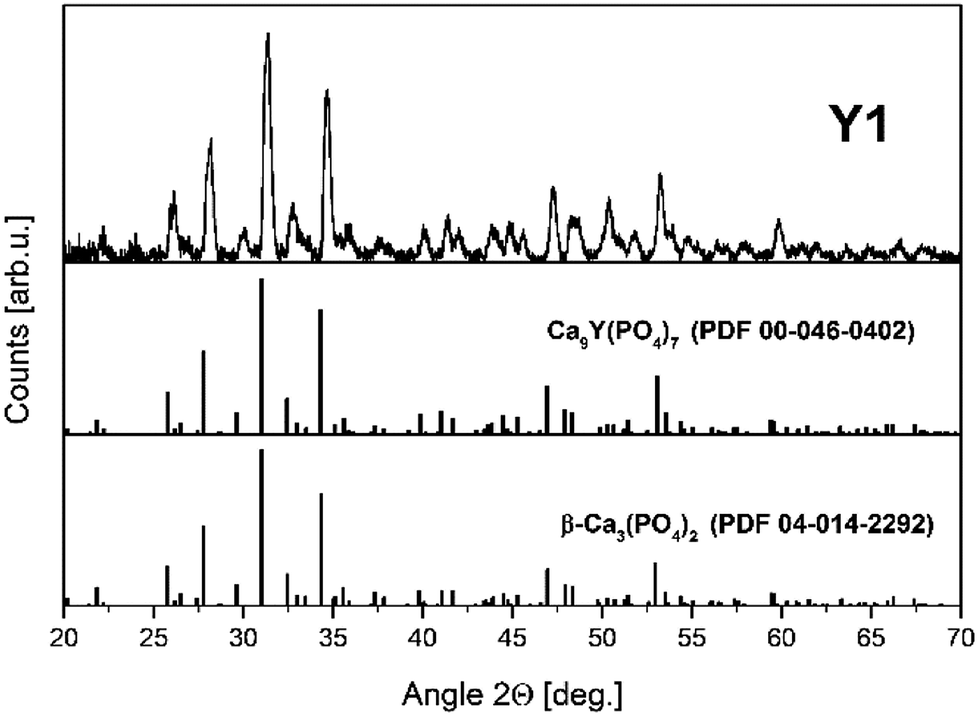 | ||
| Fig. 5 XRD pattern of Y1 sample with Ca9Y(PO4)7 and Ca3(PO4)2 PDF standards. | ||
| Sample | Nominal atomic% | Experimental atomic% | ||
|---|---|---|---|---|
| Ca | Y | Ca | Y | |
| Y0.5 | 95.0 | 5.0 | 97.3 | 2.7 |
| Y0.75 | 92.5 | 7.5 | 94.8 | 5.2 |
| Y1 | 89.9 | 10.1 | 94.3 | 5.7 |
| Y1.5 | 84.9 | 15.1 | 86.7 | 13.4 |
| Y2 | 79.9 | 20.1 | 82.1 | 17.9 |
Optical properties
The normalized, partial photoluminescence excitation (PLE) and photoluminescence (PL) spectra obtained at room temperature for the Ca9Y(PO4)7:Eu3+ system with different Y/Ca ratios (Y0.5; Y0.75; Y1; Y1.5; Y2) are presented in Fig. 6. PLE spectra are shown in narrow spectral region between 390 and 405 nm to reveal the differences between the individual spectra. PL spectra of materials obtained after the first step of the synthesis under excitation at 393 nm and 394 nm consist of narrow lines, which correspond to the 5D0 → 7FJ (J = 1, 2, 3, 4) transitions in Eu3+ ion. In the case of Y0.5 and Y0.75 materials, the emission spectra do not depend on the excitation wavelength (Fig. 6a and b). For the stoichiometric material (Y1) and materials with the excess of yttrium (Y1.5 and Y2), it is observed that PL spectra depend on the excitation wavelength. Under 393 nm excitation, it is observed that the emission spectra are identical as the ones obtained for Y0.5 and Y0.75 (Fig. 6c), whereas under 394 nm excitation, the emission spectral shapes are clearly different from the ones obtained with 393 nm excitation. The PL spectra under excitation at 394 nm are characterized by higher intensity of magnetic dipole transition 5D0 → 7F1 and electric dipole transition 5D0 → 7F4 than the respective ones obtained under 393 nm excitation (Fig. 6d). It is worth noting that emission related to the Eu2+ was not observed in the investigated samples.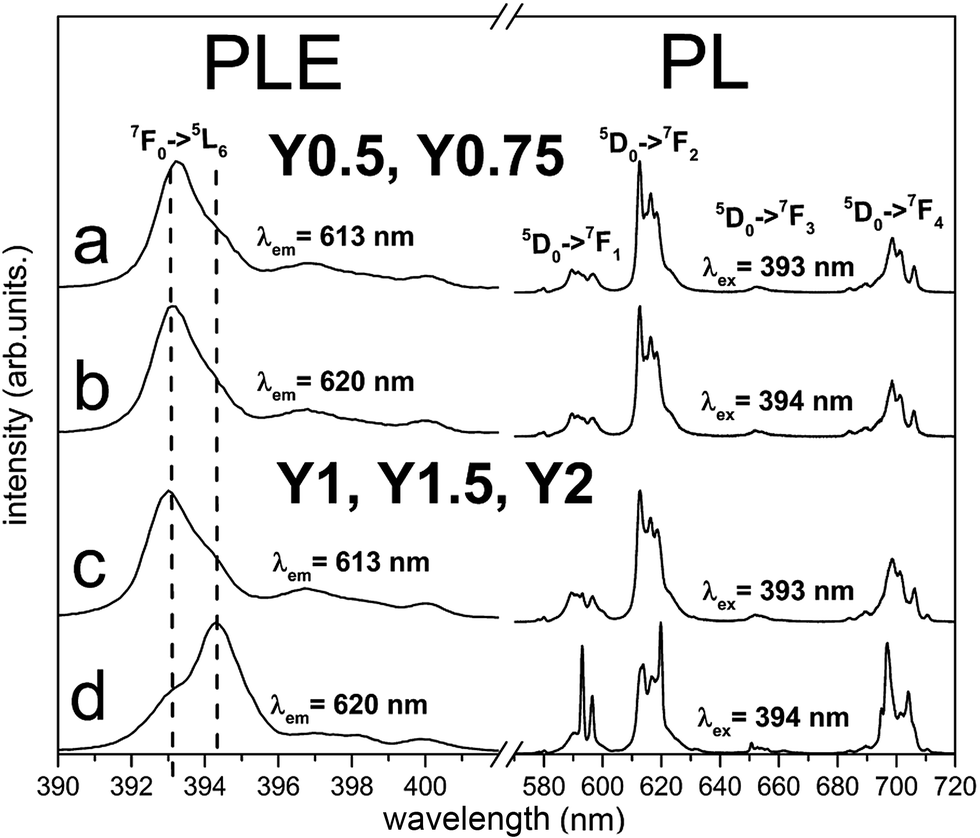 | ||
| Fig. 6 PL and partial PLE spectra of Ca9Y(PO4)7:Eu3+ measured at RT before reduction. PLE spectra are recorded monitoring at 613 nm and 620 nm wavelength for all samples. The emission spectra were collected under excitation at 393 nm and 394 nm for all samples. | ||
The PLE spectra for all samples were recorded monitoring luminescence at 613 nm (Fig. 6a and c) and 620 nm (Fig. 6b and d) and the excitation line shown on Fig. 6 corresponds to 7F0 → 5L6 transition. The most intensive lines seen in PLE spectra have peaks at 393 nm and 394 nm. It can be noticed that the relative intensities of these lines depend on the monitored emission wavelength and Y/Ca concentration. For Y0.5 and Y0.75, the PLE spectra do not depend on the observation wavelength and the 7F0 → 5L6 line is seen at 393 nm. In the case of Y1, Y1.5 and Y2 different excitation spectra were obtained by monitoring 613 and 620 nm luminescence. With observation at 613 nm, the excitation line attributed to the 7F0 → 5L6 transition is seen at 393 nm, while by monitoring at 620 nm, the line is observed at 394 nm. These spectroscopic features provide evidence that in the case of Y1, Y1.5 and Y2 samples, there is an additional center of Eu3+ which is not observed for samples with deficiency of yttrium (Y0.5 and Y0.75). The ratio of emission intensities attributed to the 5D0 → 7F2 and the 5D0 → 7F1 transitions, denoted as asymmetric ratio, is used as a measure for the asymmetry of Eu3+ centers in phosphors. For the Eu3+ center excited with 393 nm, the asymmetric ratio is equal to 6, while for Eu3+ center excited with 394 nm this ratio diminishes to about 1.5. This leads to the conclusion that Eu3+ ions excited with 394 nm occupy the sites in Ca9Y(PO4)7 with a higher inversion symmetry than the ones excited with 393 nm. More distorted sites are attributed to Eu3+ replacing divalent Ca2+ sites with a triclinic C1 point group. The sites with higher overall symmetry were attributed to Eu3+ replacing Y3+ sites with a trigonal C3 point group.
According to the Tanner work28 where the theoretically allowed transition lines of 5D0 → 7FJ of Eu3+ ions at certain point symmetry groups are present, in our case the 3 peaks of 5D0 → 7F1, 5 peaks of 5D0 → 7F2 and 9 peaks of 5D0 → 7F4 transitions should be observed in the spectra of Eu3+ occupying the sites with C1 symmetry, while in the sites of C3 symmetry only 2 peaks of 5D0 → 7F1, 3 peaks of 5D0 → 7F2 and 6 peaks of 5D0 → 7F4 transitions should be present. As it can be seen in Fig. 6, the aforementioned splitting is observed only in the emission spectra of Eu3+ excited at 394 nm for the Y1, Y1.5, Y2 materials. In this case, the 394 nm excites mainly Eu3+ ions that occupy sites with C3 symmetry. In the case of Eu3+ incorporated into the sites with C1 symmetry, the situation is much more complicated due to the presence of three deferent C1 sites that are available for Eu3+ substitution. These sites are present in all materials and the Eu3+ luminescence cannot be easily distinguished among the sites.
Therefore considering the spectra presented in Fig. 6, one can conclude that when there is a deficiency of yttrium (the case of Y0.5 and Y0.75), Eu3+ ions replace almost only divalent Ca2+ sites, while for the stoichiometric material (Y1) and materials with the excess amount of yttrium (Y1.5 and Y2), Eu3+ ions occupy, besides the Ca2+ sites, also Y3+ sites.
Another approach to study the number and distortions symmetry of Eu3+ centers is to analyze Eu3+ time-resolved luminescence spectra. This technique was used for the samples obtained before the reduction and with both: deficiency (Y0.5) and excess (Y2) of yttrium. The spectra were measured under 290 nm excitation wavelength. This excitation wavelength corresponds to the charge transfer transition from the oxygen anion to the empty state of 4f7 of Eu3+ and excites Eu3+ incorporated in the both sites simultaneously.14 This excitation was used because there was no possibility to use 393 nm and 394 nm excitation wavelength which can be used to excite Eu3+ centers independently.
The time-resolved measurement technique is very useful, because one can observe changes of the emission spectrum shape in time.22 The time-resolved luminescence spectra obtained under 290 nm excitation and for acquisition times: 0–3 ms (solid curves) and 7–10 ms (dotted curves) for Y0.5 and Y2 samples are presented in Fig. 7a and b, respectively. In the case of Y0.5, the shape of the emission profile and the intensity ratio of the individual lines do not change significantly in time. Decay curves of Y0.5 monitoring luminescence at different wavelengths with the spectral width of 2 nm (λobs = 593 nm, 612 nm and 696 nm) are plotted in Fig. 8a. All curves are single exponential and, to obtain decay times, single exponential functions were fitted. The decay profiles are plotted along with the calculated decay times. Taking into account the fact that the emission profile does not change in time significantly and that the decay times with a measurement error of monitoring luminescence at different wavelengths are equal, we can conclude and confirm the existence of a single Eu3+ site in Y0.5 sample. A different situation is seen for Y2 sample. In the case of Y2, the intensity ratio of the individual lines changes in time, for 0–3 ms time acquisition the collected emission spectra are similar to the ones collected for Y0.5, while in 7–10 ms time acquisition the higher intensity magnetic dipole transition 5D0 → 7F1 and electric dipole transition 5D0 → 7F4 are observed (Fig. 7b). A similar spectrum to the ones collected in 7–10 ms time acquisition was obtained for Y1, Y1.5 and Y2 samples at 394 nm steady state excitation (see Fig. 6d). The calculated decay times for Y2 ranges from 1.50 to 1.98 ms with an error of 0.2 ms monitoring 5D0 → 7F1,2,4 transitions at 593, 612 and 696 nm wavelengths. Taking into account the fact that the emission profile changes in time significantly and that the decay times with a measurement error of monitoring luminescence at different wavelengths differs, we can conclude the existence of more than one Eu3+ site in Y2 sample. As it was discussed above, the more distorted sites are attributed to Eu3+ replacing divalent Ca2+ sites with a C1 point group and these sites are expected to have a shorter decay time than the site of Eu3+ replacing Y3+, which is a more symmetrical site.
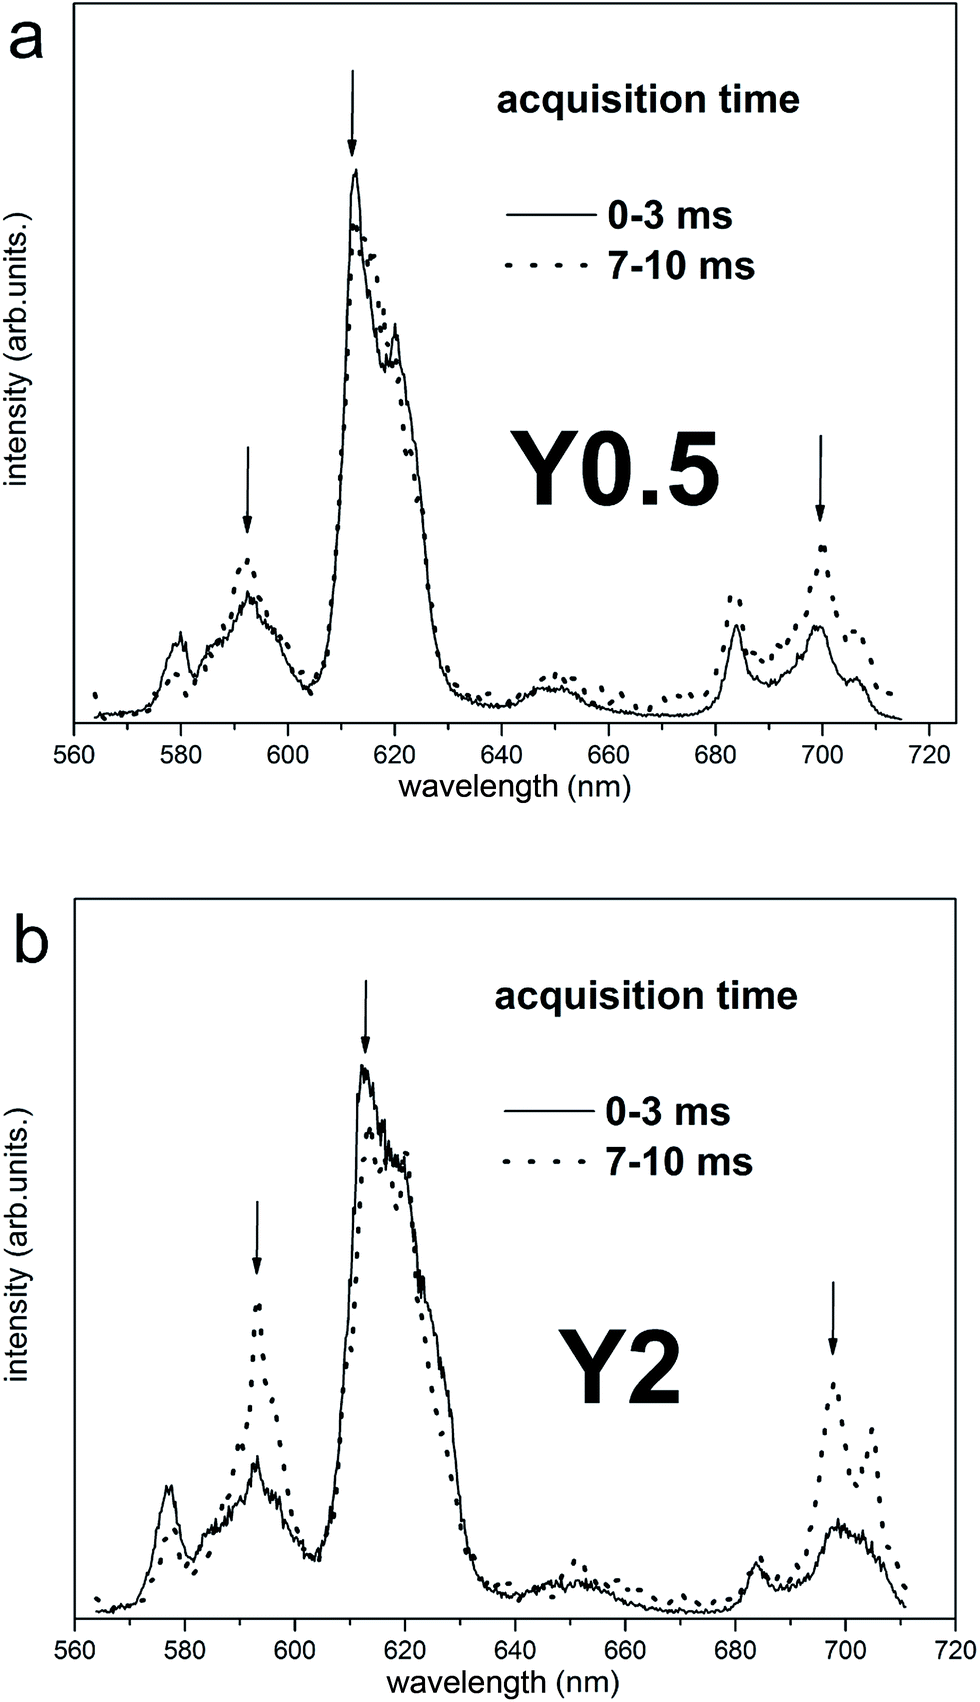 | ||
| Fig. 7 Time-resolved luminescence spectra for Y0.5:0.05 Eu3+ (a) and Y2:0.05 Eu3+ (b) excited with wavelength 290 nm for two different acquisition time. | ||
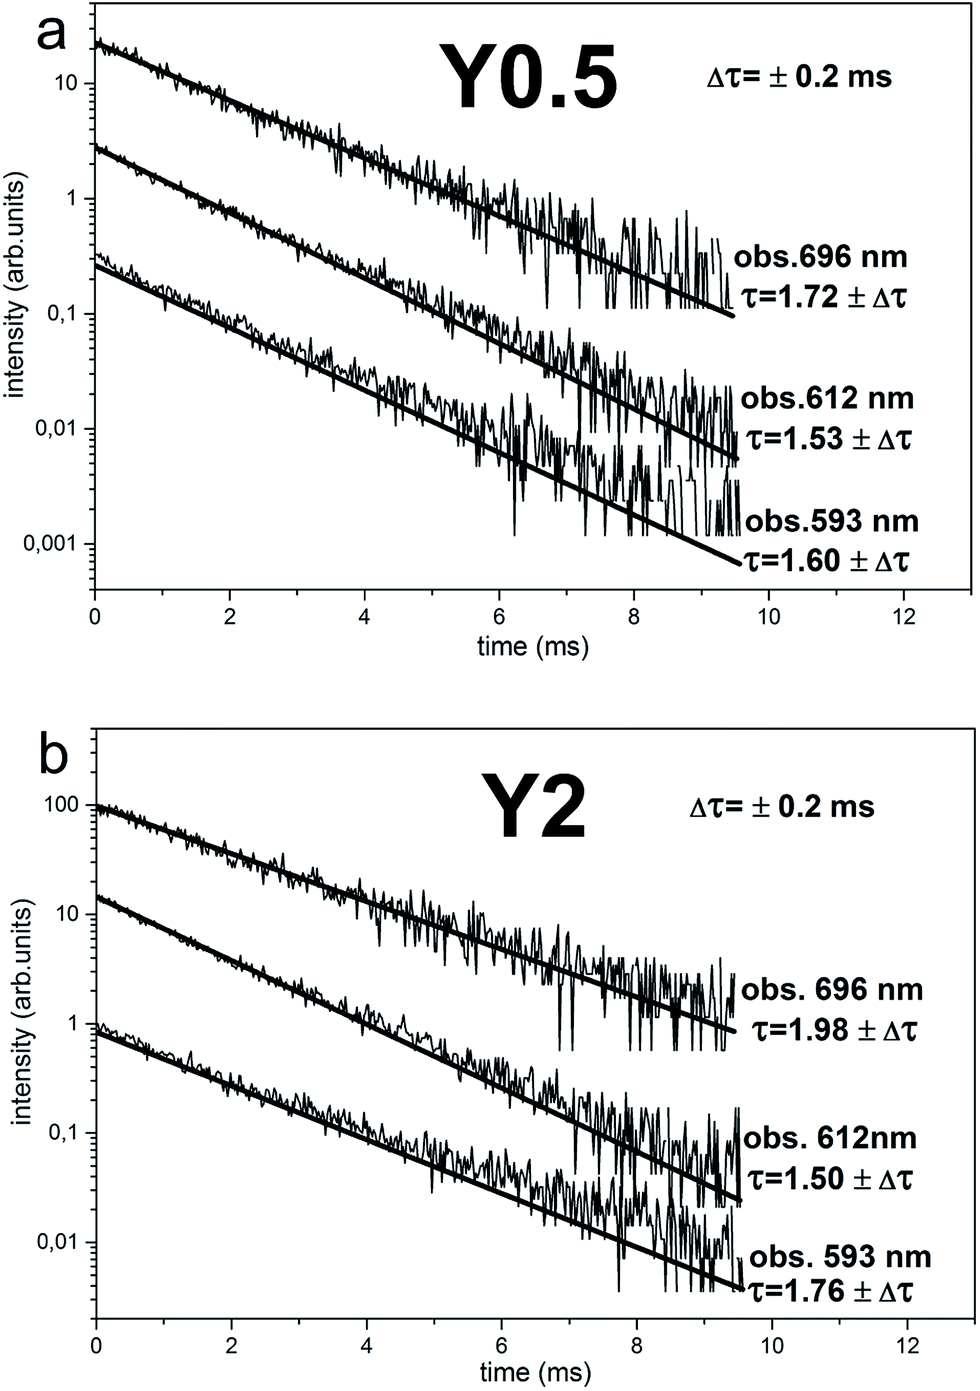 | ||
| Fig. 8 Decay curves of Eu3+ emission for Y0.5:0.05 Eu3+ (a) and Y2:0.05 Eu3+ (b). The luminescence observed at 593, 612 and 698 nm. | ||
The normalized emission spectra obtained for the samples after the reduction using excitation wavelength equal to 270 nm are presented in Fig. 9. The chosen wavelength is justified since it excites the europium in both oxidation states and corresponds to the intersection of both Eu2+ excitation spectra (Fig. 9) as well as ligand–metal charge transfer band of Eu3+.14 The emission spectra for all samples consist of broad bands related to the 4f65d1 → 4f7 transitions occurring in the Eu2+ ions and the narrow emission lines attributed to the 5D0 → 7FJ transitions in Eu3+. The presence of the latter in all cases indicates that the complete reduction did not occur. However, the intensity of the Eu3+ in comparison to intensity of Eu2+ luminescence diminishes with increasing of the nominal concentration of yttrium in the series of samples. The luminescence of Eu2+ consists of two separated bands: first one with a maximum at 420 nm and the second with a maximum at 488 nm. The contribution of these two bands to the overall emission spectra changes, depending on the Y/Ca ratio in the studied materials. In PL spectrum of the Y0.5 sample, the band with a maximum at 420 nm dominates. For higher concentration of Y in the material series (Y0.75, Y1), the contribution of the band at 488 nm suddenly emerges, and for the materials with an excess of yttrium (Y1.5, Y2), the band at 488 nm can solely be seen. The Fig. 9 also shows the excitation spectra observed for 430 and 510 nm wavelengths. As it can be seen the PLE spectra, the line shape depends on the observation wavelength. The excitation spectrum collected for emission, monitored at 430 nm, consists of a single band with a maximum at 268 nm, whereas in the PLE spectrum, monitored at 510 nm, two clear broad bands with maximums at 285 nm and 325 nm can be seen.
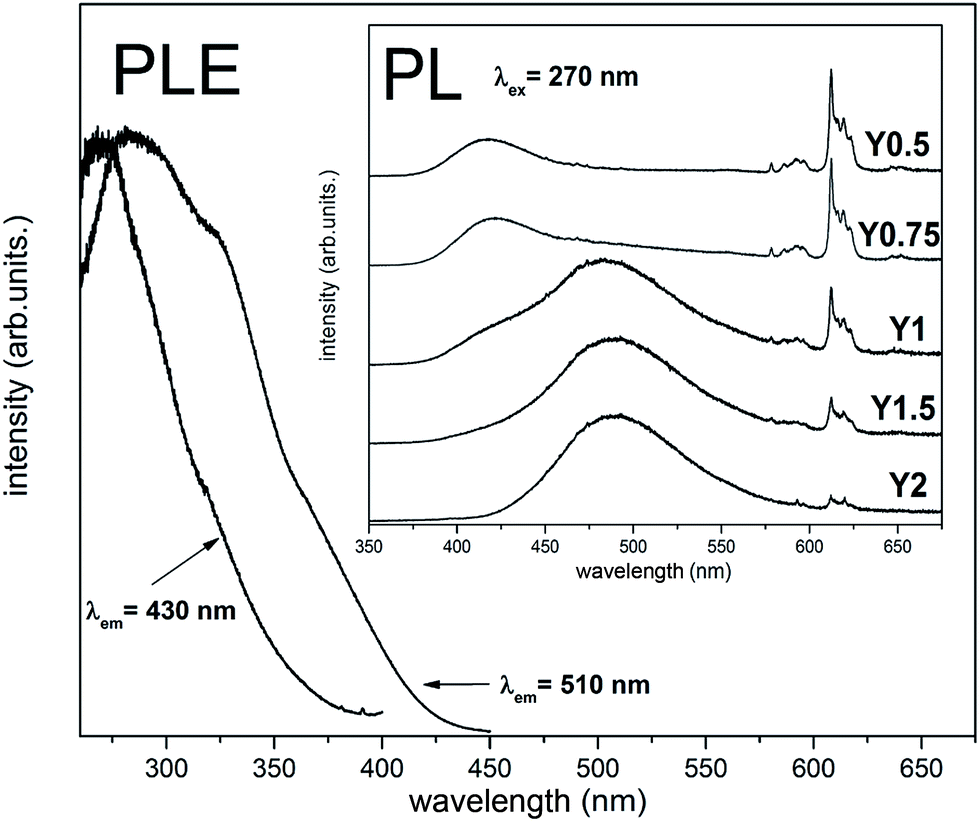 | ||
| Fig. 9 Excitation spectra monitored at two wavelength corresponding to maxima of luminescence (for materials Y0.5 and Y0.75-obs. 430 nm and for materials Y1, Y1.5 and Y2-obs. 510 nm). Inset: the emission spectra of Ca9Y(PO4)7 after reduction, collected at RT under excitation at 270 nm for all samples. | ||
To analyze the Eu3+ sites remaining after the reduction process, emission spectra under 393 and 394 nm excitation were also measured and the results are presented in Fig. 10. The emission and excitation spectra of Eu3+ collected for all materials after the reduction have the same profile as respective ones before the reduction, but with lower intensities. Here, as previously, it can be observed that Eu3+ ions incorporated into the Y0.5 and Y0.75 samples occupy only one site, as opposed to the two sites in the Y1 and Y2 samples.
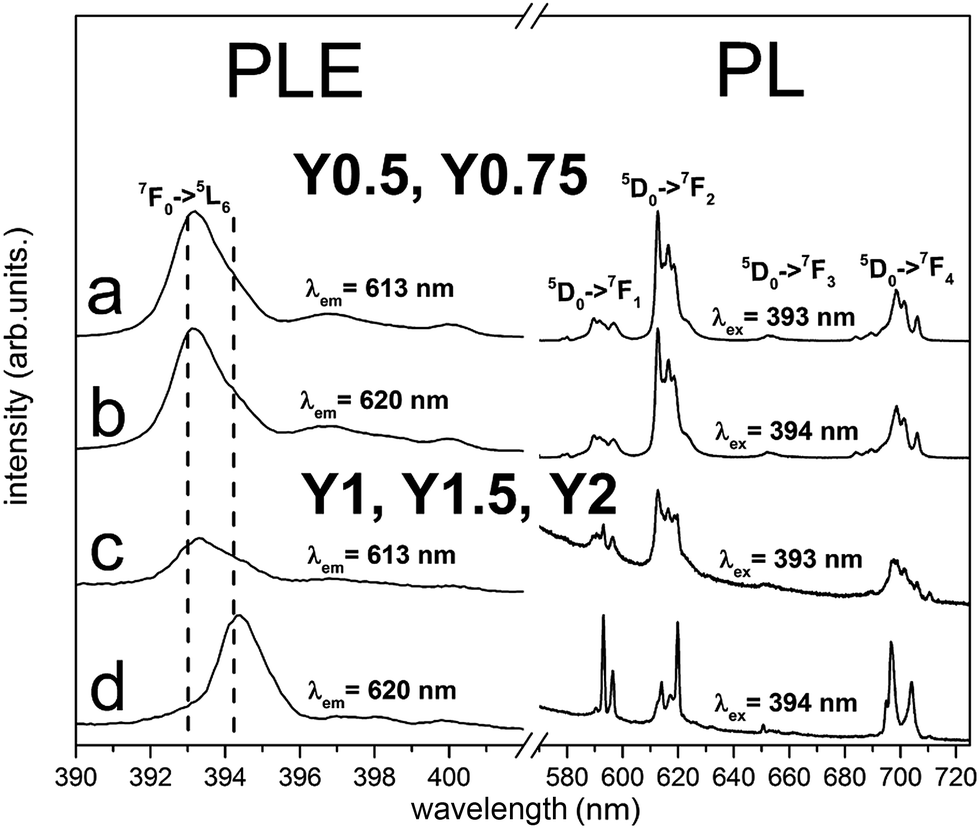 | ||
| Fig. 10 PL and partial PLE spectra of Ca9Y(PO4)7:Eu after reduction measured at room temperature. PLE spectra of the emission were recorded at (613 nm) for all samples and at 620 nm for Y1–Y2. The emission spectra was collected under excitation at 393 nm and 394 nm for all samples. | ||
Taking into account the criteria for short and long distance charge compensation described in detail in ref. 29 the temperature dependence of Eu2+/Eu3+ emission intensity ratio was also checked for Y0.5 and Y2 materials. The spectra are presented in Fig. 10a and b. The excitation wavelength was 270 nm since it allows to excite the Eu3+ trough the charge transfer transition and the Eu2+ through the 8S7/2 → 4f65d transition. The mutual relationship of the emission intensity of Eu3+ and Eu2+ depends on the given sample, as discussed above. The emission spectra were scaled to Eu3+ intensity (multiplied or divided by a specific value) to maintain a constant intensity of Eu3+ emission for all temperatures for a given sample. Such a normalization is justified assuming that there are no non-radiative processes that cause Eu3+ emission decrease in measured temperature range24 and allows to observe changes in Eu2+ intensity. It is seen in Fig. 11 that for both Y0.5 and Y2 samples, the intensity of Eu2+ decreases in respect to Eu3+ when temperature is increased from 10 K to 400 K. Since the intensity of Eu2+ does not increase when temperature increases (and in fact decreases due to non-radiative processes), we postulate that the compensation of Eu3+ replacing Ca2+ ions takes place at a short distance for both samples.
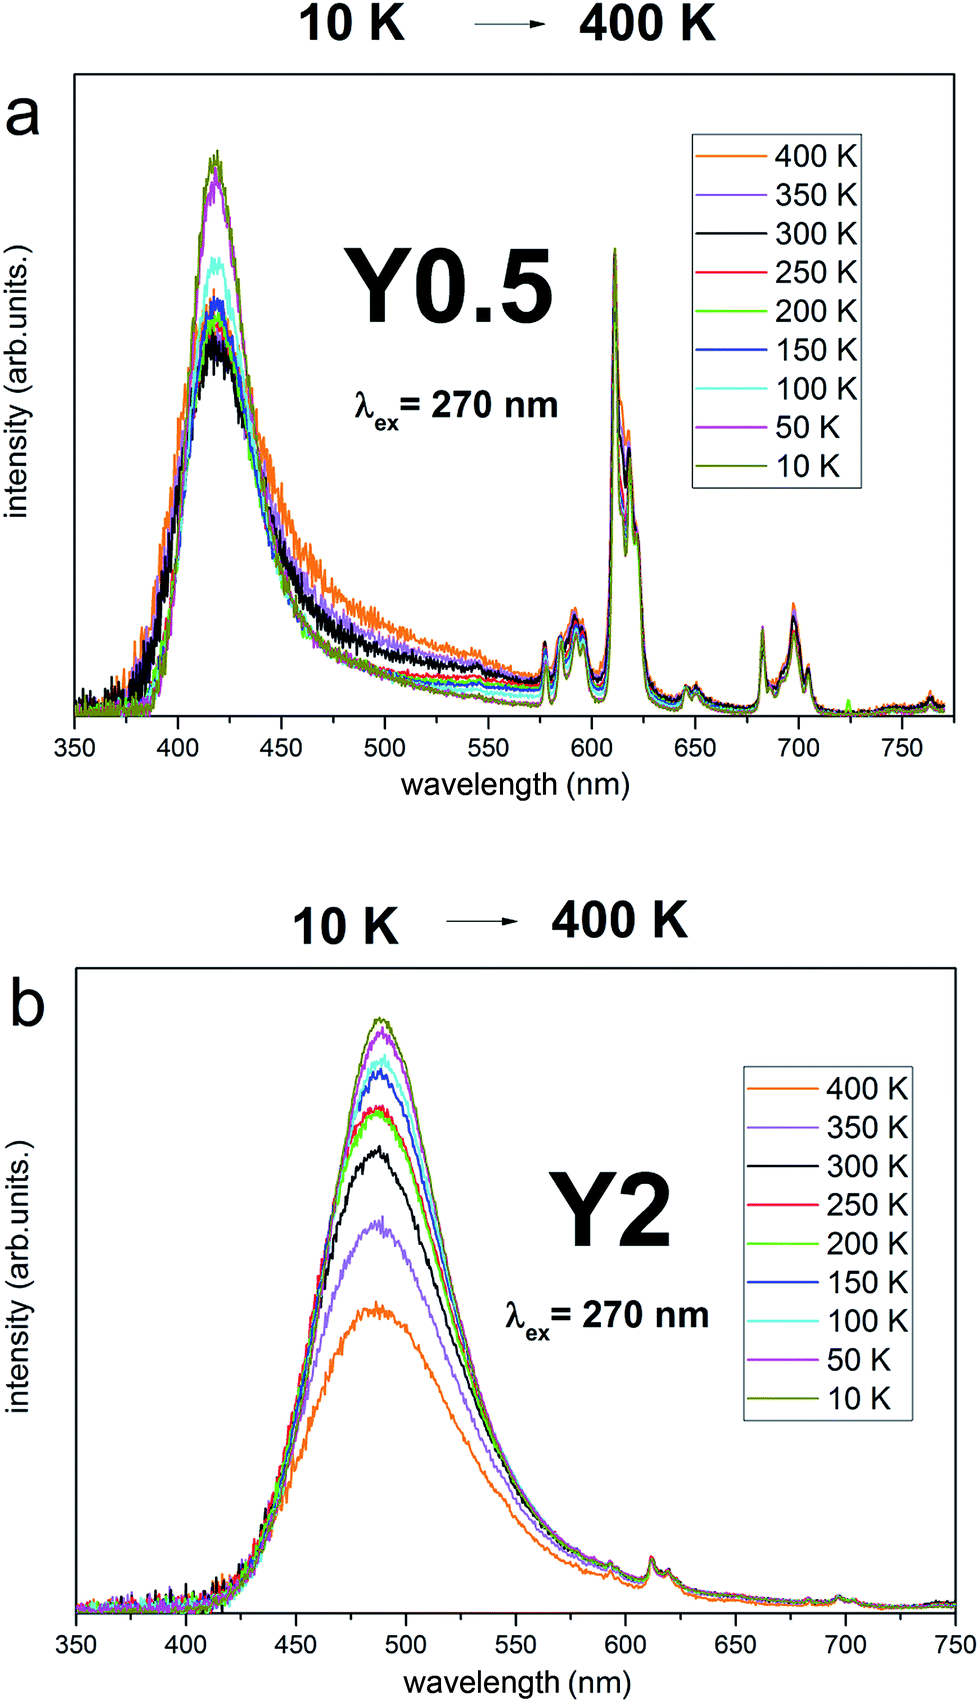 | ||
| Fig. 11 Luminescence spectra of Y0.5:Eu2+,Eu3+ (a) and Y2:Eu2+,Eu3+ (b) at different temperature under pulsed excitation with 270 nm. | ||
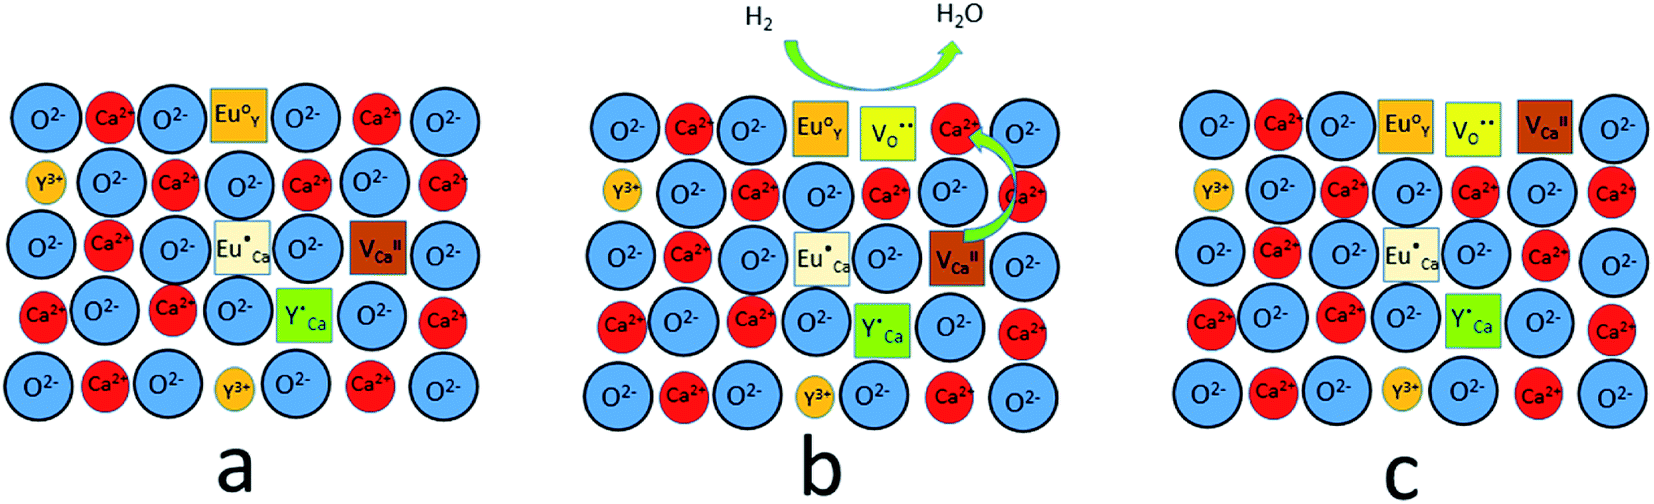
Mechanisms proposed
The observed differences in the emission spectra collected for samples obtained after the reduction can be qualitatively explained considering differences in charge compensation mechanisms. The differences arise from the changes in Y/Ca concentration ratio in materials series. In the case of materials with deficiency of Y3+ (Y0.5 and Y0.75), the additional positive charge created during the incorporation of Eu3+ ions into the Ca2+ sites (in those materials only Ca2+ sites are occupied by the Eu3+; see discussion of Fig. 5 and 8) is compensated by the chemically induced defects. Moreover, the concentration of
  is higher than
  and the excess of the negative charge is compensated by the e.g. oxygen vacancies
  . Generally, during a reduction process, the gaseous hydrogen, considered as a reducing agent, creates additional oxygen vacancies
  on the surface of the material particles.30 Because the charge compensation in the materials has a local character (short distance compensation), the reduction of Eu3+ to Eu2+ will occur, when the compensation defect of
  is locally eliminated. The
  created on the surface during the reduction cannot cause the elimination of
  from the surroundings of Eu3+ and for the reduction of the europium ion, the created oxygen vacancy has to be moved from the surface to the vicinity of the Eu3+ and
  . The situation described above is presented in Fig. 12. This kind of compensation mechanism changes the local environment of Eu2+ center, because one oxygen anion is removed from the vicinity of a reduced europium ion. The emission occurring from this luminescent center is strongly shifted to the blue region in comparison to the other Eu2+ site observed in Ca9Y(PO4)7. The maximum of Eu2+ appears at 420 nm. Such an effect has been observed by Fang et al.31 in BaMgSiO4:Eu and has been attributed to the creation of oxygen vacancy in the first coordination sphere of the europium ion. It is worth noting that the emission of Eu2+ with a maximum at 420 nm is typical for europium doped Ca3(PO4)2 in rhombohedral form.32,33 Thus, the explanation can be the presence of a local crystal domain: e.g. similar symmetry and coordination number of Eu2+ as in the case of Ca3(PO4)2. This situation is achieved after the removal of the oxygen anion from the vicinity of europium in the samples with an excess of calcium.
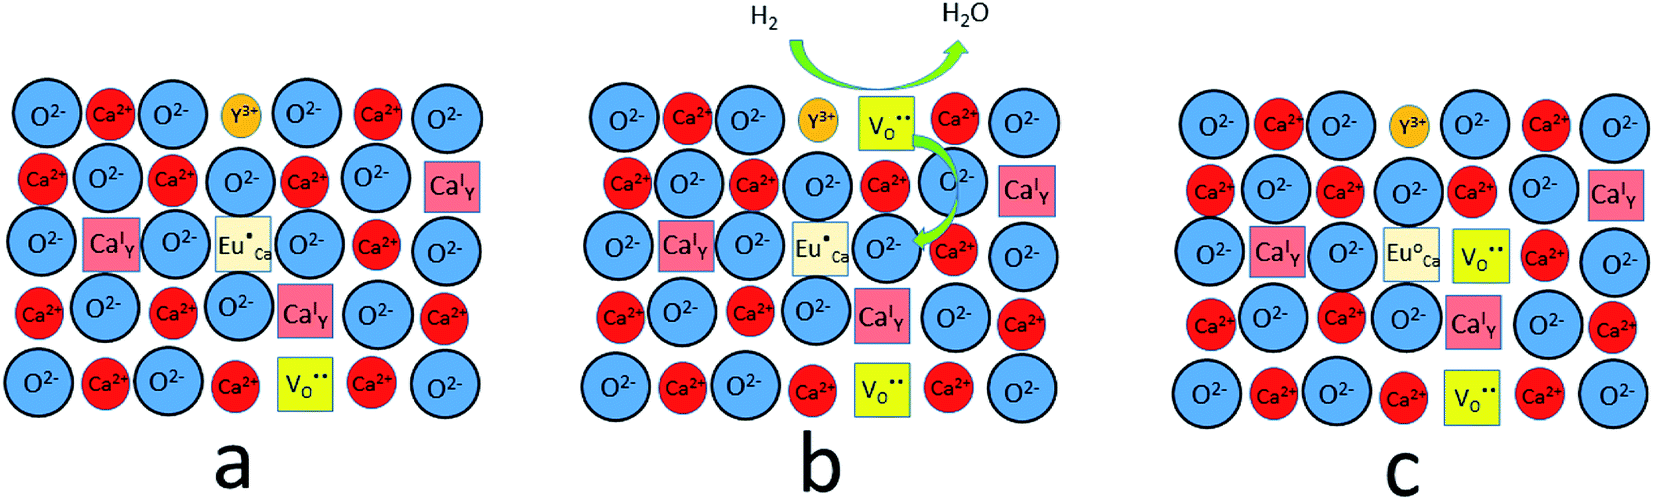 | ||
| Fig. 12 A scheme of the compensation mechanism occurred in deficiency of Y3+; (a) defects created after synthesis in air; (b) reduction process; (c) distribution of defects after reduction process. | ||
In the studied phosphates, the oxygen ions are a part of phosphorus tetrahedrons, in which elements are bonded with partially covalent bonds. For this reason, the energy necessary for migration of oxygen vacancies,  , is relatively high (compared to e.g. calcium vacancies,
  ). It means that via the proposed compensation mechanism, only a small part of Eu3+ ions (mostly located on the surface) are reduced during the process and intense emission lines of Eu3+ are observed in the spectra (Fig. 9).
A different situation is observed in the case of materials with an excess of Y3+ (Y1.5 and Y2). Here, the Eu3+ ions are incorporated in Ca2+ and Y3+ sites. The  impurity does not need compensation due to the same oxidation state of Eu3+ and Y3+, while the additional charge of
  defects is compensated by the naturally created cation vacancies (e.g.
  ). Moreover, in the Y1.5 and Y2 materials, chemically induced, positively charged
  defects are also compensated by the cation vacancies. During the reduction process, the
  defects are created in the same way as described previously. Due to the short distance charge compensation, the reduction of Eu3+ will occur if
  compensating agent
  is eliminated. Due to the difference in the type of calcium and oxygen bonding with the nearest neighbors, it is expected that the energy necessary for migration of
  is much smaller than in the case of the
  defects. From the energy difference, it stems that the migration of calcium vacancies to the surface is much more probable than the migration of oxygen vacancies to the bulk crystal to compensate each other.30 Fig. 13 shows the scheme of the described situation. This mechanism does not change the local environment of the reduced europium ions and the luminescence of Eu2+ occurs with a maximum of the emission band located at 488 nm.24 Due to the high migration rate of
  , all Eu3+ ions compensated with the calcium vacancies are reduced and the Eu2+ luminescence is relatively intense. However, a part of the europium ions is incorporated into the yttrium sites without compensation defects. It suggests that the luminescence of unreduced Eu3+ ions observed in the emission spectra (Fig. 10) mostly originates from the
  luminescent centers. However, it is assumed that both compensation mechanisms are present in all materials, depending on the randomly occurring distribution of Eu3+ compensating defects. It should be emphasized that the probability of encountering a given compensation mechanism depends on the Y/Ca concentration ratio. For the materials with deficiency of Y3+, the mechanism that includes
  migration is more probable and in the case of the materials with the excess of Y3+, a more probable mechanism involves migration of
  defects. For the stoichiometric material (Y1), both of them are almost equally probable.
 | ||
| Fig. 13 A scheme of the compensation mechanism occurred in excess of Y3+; (a) defects created after synthesis in air; (b) reduction process; (c) distribution of defects after reduction process. | ||
Conclusions
The series of luminescent materials based on Ca9Y(PO4)7 matrix with different Y/Ca concentration ratios were obtained in order to study the influence of charge compensation defects on the luminescence of europium ions incorporated into the matrix. Depending on the value of the ratio, different defects are created to compensate the additional positive charge of . For the materials with the deficiency of Y3+,
  are mainly created, while for the materials with the excess of Y3+, the main defects are
  . It was assumed that both of the defects have different migration rates. The differences in the luminescence of Eu2+ observed in the series of materials were attributed to the differences in the defects migration rates. Moreover, it has been shown that the presence of Eu2+ emission band with a maximum at 420 nm observed for the materials with the deficiency of Y3+ is a result of changes in the local environment of Eu2+ center, because one oxygen anion is removed from the vicinity of the reduced europium ion.
Acknowledgements
This research is supported by the National Science Centre, Poland, agreement number: UMO 2014/13/D/ST3/04032. The authors would like to thank Prof. Adriana Zaleska for the opportunity to perform the materials syntheses and M. Sc. Michał Nischk for his support during the syntheses. D. M. and M. G. have been supported by the National Centre for Research and Development by grant TAZOLED, PBS3/A5/48/2015.Notes and references
- Q. Dong, Y. Wang, Z. Wang, X. Yu and B. Liu, J. Phys. Chem. C, 2010, 114, 9245–9250 CAS.
- A. A. Reddy, S. Das, S. Ahmad, S. S. Babu, J. M. F. Ferreirab and G. V. Prakasha, RSC Adv., 2012, 2, 8768–8776 RSC.
- C. Wu, K. Chen, C. Lee, T. Chen and B. Cheng, Chem. Mater., 2007, 19, 3278–3285 CrossRef CAS.
- G. Dong, H. Ma, Y. Liu, Z. Yang and Q. Liu, Opt. Commun., 2012, 285, 4097–4101 CrossRef CAS.
- M. Xie, Y. Li and R. Li, J. Lumin., 2013, 136, 303–306 CrossRef CAS.
- V. B. Taxak, S. Dayawati and S. P. Khatkar, Curr. Appl. Phys., 2013, 13, 594–598 CrossRef.
- K. N. Shinde, S. J. Dhoble, H. C. Swart and K. Park, Springer Series in Materials Science, vol. 174, 2012 Search PubMed.
- S. Du, D. Wang, Y. Wang, S. Xin, Q. Qiang and X. Ma, New J. Chem., 2015, 39, 5605 RSC.
- C.-H. Huang, L. Luo and T.-M. Chen, J. Electrochem. Soc., 2011, 158, 341 CrossRef.
- H. K. Li, B. K. Yang, B. Moon, Ch. Choi, J. H. Jeong, K. Jang, H. S. Lee and S. S. Yi, Opt. Mater. Express, 2012, 2(4), 443 CrossRef CAS.
- J. Sun, W. Zhou, Y. Sun and J. Zeng, Opt. Commun., 2013, 296, 84 CrossRef CAS.
- X. Wu, Y. Liang, R. Chen, M. Liu and Z. Cheng, Mater. Chem. Phys., 2011, 129, 1058 CrossRef CAS.
- A. Watras, I. Carrasc, R. Pazik, R. J. Wiglusz, F. Piccinelli, M. Bettinelli and P. J. Deren, J. Alloys Compd., 2016, 672, 45 CrossRef CAS.
- F. Du, Y. Nakai, T. Tsuboi, Y. Huang and H. J. Seo, J. Mater. Chem., 2011, 21, 4669 RSC.
- F. Piccinelli, M. Trevisani, J. R. Plaisier and M. Bettinelli, J. Rare Earths, 2015, 33, 977 CrossRef CAS.
- A. Lecointre, A. Bessière, B. Viana, R. AïtBenhamou and D. Gourier, Radiat. Meas., 2010, 45, 273 CrossRef CAS.
- Q. Liu, Y. Liu, Z. Yang, X. Li and Y. Han, Spectrochim. Acta, Part A, 2012, 87, 190 CrossRef CAS PubMed.
- B. Wang, Y. Lin and H. Ju, J. Alloys Compd., 2014, 584, 167 CrossRef CAS.
- V. N. Golubev and B. I. Lazoryak, Izv. Akad. Nauk SSSR, Neorg. Mater., 1991, 27, 576 CAS.
- Y. Lu, C. H. Huang, T. M. Chen, J. H. Lin, Y. R. Ma, J. L. Chen, C. C. Hsu, C. L. Chen, C. L. Dong and T. S. Chan, Chem. Phys. Lett., 2011, 515, 245 CrossRef CAS.
- X. Zhang, L. Zhou and M. Gong, Opt. Mater., 2013, 35, 993 CrossRef.
- K. Li, Y. Zhang, X. Li, M. Shang, H. Lian and J. Lin, Dalton Trans., 2015, 44, 483 Search PubMed.
- A. Watras, P. J. Deren, R. Pazik and K. Maleszka-Bagińska, Opt. Mater., 2012, 34, 2041 CrossRef CAS.
- H. Lee, M. Hong, S. Bae, H. Lee, E. Park and K. Kim, J. Mater. Chem., 2003, 13, 2626 RSC.
- M. Puchalska, Y. Gerasymchuk and E. Zych, Opt. Mater., 2010, 32, 1117 CrossRef CAS.
- R. Pazik, K. Zawisza, A. Watras, K. Malesza-Bagińska, P. Boutinaud, R. Mahiou and P. J. Deren, Mater. Res. Bull., 2013, 48, 337 CrossRef CAS.
- A. A. Kubicki, P. Bojarski, M. Grinberg, M. Sadownik and B. Kukliński, Opt. Commun., 2006, 263, 275 CrossRef CAS.
- A. Tanner, Chem. Soc. Rev., 2013, 42, 5090 RSC.
- A. Baran, J. Barzowska, M. Grinberg, S. Mahlik, K. Szczodrowski and Y. Zorenko, Opt. Mater., 2013, 35, 2107 CrossRef CAS.
- K. Szczodrowski, J. Barzowska, N. Górecka and M. Grinberg, RSC Adv., 2016, 6, 48001 RSC.
- W. Ji, M.-H. Lee, L. Hao, X. Xu, S. Agathopoulos, D. Zheng and C. Fang, Inorg. Chem., 2015, 54, 1556 CrossRef CAS PubMed.
- K. Li, D. Chen, J. Xu, R. Zhang, Y. Yu and Y. Wang, Mater. Res. Bull., 2014, 49, 677 CrossRef CAS.
- Y.-j. Zhang, Z.-y. Mao, D.-J. Wang and J. Zhao, Mater. Res. Bull., 2015, 67, 1 CrossRef.
| This journal is © The Royal Society of Chemistry 2017 |