DOI:
10.1039/C7RA06362H
(Paper)
RSC Adv., 2017,
7, 40558-40562
Roles of reaction kinetics of CO2 on a PrBaCo2O5.5+δ surfaces†
Received
7th June 2017
, Accepted 10th August 2017
First published on 18th August 2017
Abstract
A symmetric PBCO/YSZ/PBCO cell (where PBCO refers to PrBaCo2O5.5+δ, and YSZ to yttria stabilized zirconia) was designed and fabricated for the investigation of the catalytic nature and reaction kinetics of CO2 on PBCO surfaces. The electrochemical impedance spectroscopy was employed to probe the CO2 reaction behavior on the PBCO electrode. The symmetric equivalent circuit cell characterization reveals that the surface resistance of CO2 on PBCO is only 30.2 Ω cm2 and the maximum surface exchange coefficient kchem is 2.0 × 10⁻⁴ cm s−1 at 1147 K, suggesting that PBCO can be an excellent candidate for CO2 reduction.
Introduction
Carbon dioxide (CO2) is a stable chemical species because of its strong C![[double bond, length as m-dash]](https://www.rsc.org/images/entities/char_e001.gif) O bonds.1 Various technologies for CO2 reduction have been developed.2 In the electrolysis process, CO2 can be converted to CO or methane at the cell cathode.3 The cathodes are normally made up of metals such as nickel,4 platinum,5 palladium.6 Nickel and copper have been widely studied, but the poisonous oxidation at high CO2 concentration shortens their catalytic life. The noble metals (Pt and Pd)7,8 can have better chemical stability but suffer from carbon deposition on the surface, which significantly degrades their catalytic functionality. Promising catalysts for the CO2 reduction are complex oxides because they are efficient, inexpensive and stable. Gadolinium-doped ceria (GDC) was proposed for this application,9 and Cu-doped GDC10 showed that its operation temperature is reduced to as low as 1023 K. However, the chemical stability of GDC-based cathode materials becomes a critical issue under reduction environment. Recently, it was demonstrated11 that the (La, Sr)(Cr, Mn)O3/GDC is a stable CO2 reduction cathode for electrolyzer, and that the CO2 reduction can be achieved by (La, Sr)TiO3 (LSTO) and doped LSTO.12–14 These oxides avoid the carbon deposition, but their ionic conductivity is poor so that their use requires the device to operate at high operation temperature. The Cu-doped La0.58Sr0.4Co0.2Fe0.8O3−δ/GDC cathode can be operated at 1073–1173 K,15 suggesting that this family of materials can be a new cathode material with good chemical stability and low operation temperature for the CO2 reduction. Therefore, it is important to understand the kinetics of CO2 reduction on the surface of this new class of cathode materials.
O bonds.1 Various technologies for CO2 reduction have been developed.2 In the electrolysis process, CO2 can be converted to CO or methane at the cell cathode.3 The cathodes are normally made up of metals such as nickel,4 platinum,5 palladium.6 Nickel and copper have been widely studied, but the poisonous oxidation at high CO2 concentration shortens their catalytic life. The noble metals (Pt and Pd)7,8 can have better chemical stability but suffer from carbon deposition on the surface, which significantly degrades their catalytic functionality. Promising catalysts for the CO2 reduction are complex oxides because they are efficient, inexpensive and stable. Gadolinium-doped ceria (GDC) was proposed for this application,9 and Cu-doped GDC10 showed that its operation temperature is reduced to as low as 1023 K. However, the chemical stability of GDC-based cathode materials becomes a critical issue under reduction environment. Recently, it was demonstrated11 that the (La, Sr)(Cr, Mn)O3/GDC is a stable CO2 reduction cathode for electrolyzer, and that the CO2 reduction can be achieved by (La, Sr)TiO3 (LSTO) and doped LSTO.12–14 These oxides avoid the carbon deposition, but their ionic conductivity is poor so that their use requires the device to operate at high operation temperature. The Cu-doped La0.58Sr0.4Co0.2Fe0.8O3−δ/GDC cathode can be operated at 1073–1173 K,15 suggesting that this family of materials can be a new cathode material with good chemical stability and low operation temperature for the CO2 reduction. Therefore, it is important to understand the kinetics of CO2 reduction on the surface of this new class of cathode materials.
The family of LnBaCo2O5.5+δ (LnBCO) (Ln = rare earth element) has been studied as cathode materials for efficient intermediate-temperature solid oxide fuel cells (SOFCs),16 because they have excellent transport properties,17 low polarization resistance and low activation energy.18,19 Especially, the ordered double perovskite PrBaCo2O5.5+δ (PBCO) exhibits superfast ionic conductivity, rapid oxygen ion diffusion and surface exchange kinetics.20 Recently, various single crystalline thin films of LnBCO, which have highly ordered oxygen vacancies, have been fabricated for systematic studies on their physical properties and reaction kinetics.21–23 These studies indicate that the diffusion of oxygen and hydrogen is ultrafast and occurs via layer-by-layer exchange diffusion with oxygen vacancies.21 From the electrochemical impedance spectroscopy study on the symmetric cell based on the PBCO thin film electrode,24 this electrode was found to have low polarization resistance and low activation energy than many other complex oxide systems. Thus PBCO is a prominent candidate for the low/intermediate temperature SOFC cathode material, suggesting that it would also be good for the CO2 reduction. In this work we examine the surface chemical kinetics of CO2 reduction on the PBCO surfaces by employing electrochemical impedance spectroscopy (EIS), with an objective to evaluate the feasibility of PBCO as the cathode material for CO2 reduction. Our work complements the previous studies on Pt electrodes25 and the symmetric cell GDC electrodes for the reduction of CO2 (ref. 9) and many other materials.26,27 In what follows we report results of our study.
Experimental
The symmetric cell of PBCO/YSZ/PBCO was fabricated by pulsed laser deposition (PLD) technique. The thin films of ordered double perovskite structure PBCO were deposited on the surfaces of the double-side polished YSZ (100) substrate. The symmetric electrodes are constrained in a round shape with 0.1 cm2 area by Pt mask. Epitaxial PBCO thin film electrodes were grown in 250 m Torr oxygen ambient at 1123 K under the KrF Excimer laser with 248 nm wavelength, which was operated with the energy density of 1.5 J cm−2 and repetition rate of 5 Hz. After the deposition, the films were annealed in 200 Torr oxygen ambient at 1123 K for 15 min and cooled down by the rate of 5 K min−1 to room temperature. The typical thickness of as-synthesized symmetric cell electrodes is around 350 nm and the YSZ electrolyte is 0.5 mm thick and 5 mm in diameter. Details of the epitaxial growth of LnBCO thin films on various substrates were described in the previous reports.15,18,24,28
An as-fabricated symmetric cell was connected with platinum wires using silver paste on both electrodes of the symmetric cell. The cell was placed in the exhaust water-sealed tube furnace, and the CO2 (99.999% pure Praxair) flow was introduced into the furnace in the flow rate of 100 cm3 min−1. The Solartron 1287/1260 system is applied to conduct the temperature dependent two-probe EIS measurement. The furnace temperature was set at a rate of 5 K min−1 for each temperature change and the EIS measurement was conducted at each 25 K step from 973 K to 1173 K after the temperature became stable. A constant AC amplitude of 10 mV is applied and the frequency is scanned from 1 MHz to 0.01 Hz. Three cycles of EIS measurements were carried out for the sample from 973 K to 1173 K.
Results and discussions
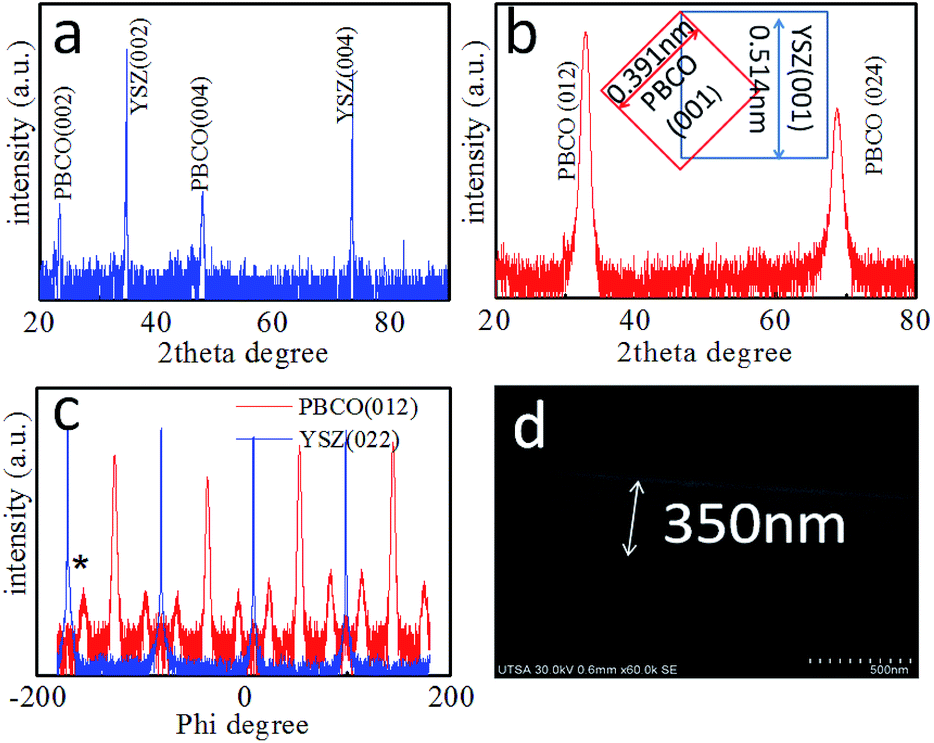
The microstructure of the as-grown symmetric cell is characterized by X-ray diffraction (XRD) and SEM. Fig. 1(a) shows the XRD θ–2θ spectrum of the symmetric PBCO/YSZ/PBCO cell. Only the (00l) peaks of the YSZ substrate and PBCO thin film electrode appear in the diffraction pattern, suggesting that the thin film electrode is c-axis oriented with good crystallinity (c(PBCO) = 0.763 nm and a(YSZ) = 0.5123 nm). The c-lattice parameter of PBCO thin film is equal to that of the bulk state.29 To confirm the epitaxial quality, a tilted θ–2θ (κ rotation) was performed, as seen in Fig. 1(b), showing the 45° tilted XRD θ–2θ pattern. Only PBCO (012) and (024) appear in the pattern, confirming that the PBCO film has good single crystallinity. Fig. 1(c) is a phi-scan pattern from the (022) YSZ or (012) PBCO plane, indicating that the cubic-on-cubic growth of PBCO (001) on YSZ (001) is achieved by 45° rotation along (00l) axis to reduce the lattice misfit from 31% to 7% (Fig. 1(b) inset). It is interesting to note that the phi-scan of PBCO (012) shows a group of peaks separated in 30° each other appeared in the spectrum. These peaks can be attributed to the ordered oxygen vacancy structures and the as-induced lattice deformation. Details are still under investigation. The thickness of PBCO electrode is about 350 nm, which is obtained by the cross-section scanning electron microscopy (Fig. 1(d)). Fig. 2 shows the Nyquist plots of the temperature-dependent EIS measurements of the PBCO/YSZ/PBCO symmetric cell in pure CO2 ambient. The Nyquist spectra consist of two overlapping compressed semi-circles but become clearly distinguishable at lower temperatures. These two overlapping compressed semi-circles are attributed to electrode surface and electrode/electrolyte interface. At high temperature, the spectra reveal compressed semi-circle in which the gas–electrode interface contributes at low frequency region with large polarization resistance, but overlaps with the electrolyte–electrode interface at intermediate frequency. The characteristic frequency with the largest negative value of Z′′ is 1 Hz at 1172 K, which is much smaller than that found for PBCO in oxygen24 indicating that the dissociation of CO2 is much slower than that of O2. The latter is consistent with the finding of the previous studies that the smaller oxygen partial pressure in oxygen ambient, the smaller characteristic frequency.30,31,31,32 At frequencies higher than 7000 Hz, a purely inductive response can be observed (i.e., positive imaginary impedance), which results from the loss of ohmic conductivity between the electrolyte and the leads.
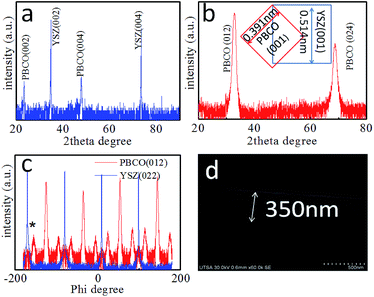 |
| | Fig. 1 (a) θ–2θ XRD profile for the PBCO/YSZ/PBCO symmetric cell. (b) The tilted θ–2θ XRD pattern of PBCO film and the inset shows the epitaxial relationship between PBCO and YSZ lattice. (c) Is the phi scan of PBCO (012): red line and YSZ (022) blue line. (d) the cross-section SEM image shows PBCO/YSZ structure. The thickness of PBCO electrode is about 350 nm. | |
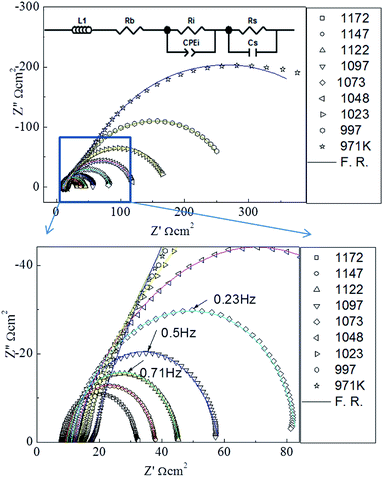 |
| | Fig. 2 The Nyquist plot of the PBCO/YSZ/PBCO symmetric cell in CO2 ambient from 973 to 1173 K. The inset shows the equivalent circuit used for the fitting of the Nyquist plot. The solid lines are the fitting results. | |
The fitting analysis of the EIS spectra data was performed by using the equivalent circuit of Zview.33 The equivalent circuit is shown in the inset of Fig. 2, where Rb is the bulk contribution of the cell, Rs is the surface resistance of the electrochemical reaction, Ri is the interface resistance between the electrode and the electrolyte, Cs is the surface capacitance of the electrode reaction, and CPE is the capacitance in the electrode–electrolyte interface diffusion. The parallel phase (Rs, Cs) represents the surface reaction of the CO2 molecule and the PBCO electrode, and the parallel phase (Ri, CPE) the process of the oxygen ion transportation at the PBCO/YSZ interface. The electrode contacts and the platinum wires can usually cause an inductive behavior, which is denoted by the inductance L. We employ this equivalent circuit model, similar to that employed in our previous studies on the symmetric cell EIS studies,19,24,34,35 to characterize the dominant surface and interface processes in the chemical reactions with symmetric cell thin film electrode structures. The fitting results from the EIS data (from the cycle 2) are shown in the Table 1. The small fitting errors of Rs and Cs (<5%) and Ri (<6%) suggest that the nature of the symmetric cell structures is well described by the equivalent circuit model although it leads to errors slightly greater than those from the symmetric cell in oxygen.34,36 This is due most likely to the complicated processes of the interaction between CO2 and PBCO electrode.
| | |
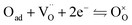
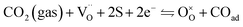
CO2(gas) + 2S ⇌ Oad + COad
| (1) |
| |
 | (2) |
| |
 | (3) |
Table 1 Parameters of the equivalent circuit extracted from the fitting analysis taken from the second-cycle EIS measurement
| T, K |
Ri, ohm |
δRi, error% |
Rs, ohm |
δRs, error% |
Cs, F |
δCs, error% |
| 1172 |
81.81 |
3.7 |
241.6 |
1.3 |
0.000774 |
1.5 |
| 1147 |
91.37 |
3.4 |
302.5 |
1.0 |
0.000575 |
1.2 |
| 1122 |
105.7 |
3.1 |
432.7 |
0.7 |
0.00043 |
0.8 |
| 1097 |
141.8 |
3.2 |
629.5 |
0.6 |
0.000342 |
0.7 |
| 1073 |
223.5 |
3.6 |
899.8 |
0.6 |
0.000293 |
0.7 |
| 1048 |
400.1 |
4.4 |
1321 |
0.7 |
0.000262 |
0.9 |
| 1023 |
831.5 |
5.6 |
2045 |
0.91 |
0.000242 |
1.1 |
| 997 |
1847 |
6.4 |
3186 |
1.1 |
0.000234 |
1.3 |
| 971 |
3822 |
6.8 |
4775 |
1.3 |
0.000236 |
1.4 |
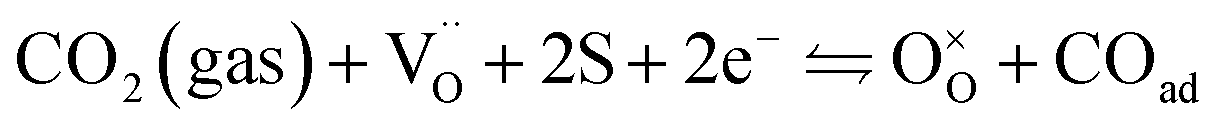
For the reduction of CO2 on Pt/YSZ (Yttria-stabilized zirconia), it was proposed37 that, after the dissociation of CO2 into CO and O, the oxygen atom is adsorbed on the electrolyte surface and the CO on the Pt electrode. PBCO thin films are of the typical mixed ionic electronic conductor, so both of O and CO can be adsorbed on the PBCO electrode surfaces during the reaction of CO2 on them. Accordingly, the dissociation reaction of CO2 on the PBCO electrode may proceed in two steps, namely, the dissociative adsorption (eqn (1)) and the incorporation (eqn (2)) processes: where S,  , and
, and  denote the adsorption site, the oxygen vacancy on the PBCO surface, and the oxygen atom in the PBCO lattice, respectively. In the dissociative adsorption process, CO2 is first adsorbed on the PBCO thin film to form various intermediates depending upon the processing temperatures.38 At the temperature from 973 to 1173 K, the intermediates are unstable and can quickly dissociate into CO and O at the oxygen vacancy positions on the PBCO surfaces (eqn (1)). Subsequently, the adsorbed atomic O will be ionized and incorporated into the oxygen vacancy on the PBCO surface lattices (eqn (2)). The previous study24 on the PBCO thin film electrode for the oxygen reduction showed that, at higher temperatures, the rate limiting step is not the incorporation but the adsorption process. The reactions of CO2 and O2 on PBCO have the same incorporation process, so that the rate limiting step in the CO2 reduction should also be the dissociative adsorption process. This is also the reason for the much smaller characterization frequency. At 973 to 1173 K, the reaction (2) should be very fast, so that the dissociative and incorporation processes may be combined together to give eqn (3). The rate of the reaction is dominantly governed by chemisorptions or the dissociative adsorption on the limited vacancy sites on the surface.
On the PBCO electrode surface, the electrochemical reaction involves the extraction and incorporation of oxygen atom or oxygen ion. For our discussion, we assume that the charge carrier concentration is uniform inside the electrode, because the critical length of PBCO for the oxygen ion diffusion at 873 K is around 140 μm,20 which is more than 2 orders larger than the thickness of the electrode (typically, 350 nm). The resistance of reduced PBCO is 5 orders larger than that of oxidized one.39 Accordingly, we assume that the conductivity of the electrode is linearly proportional to the oxygen vacancy concentration, which is uniformly distributed inside the dense thin film electrodes. The rates of both the forward and backward surface reactions are taken to be unity since the processing was taken in the near equilibrium. For the reaction, a small voltage of 10 mV was applied to the symmetric cell. Then, the kinetic response of the reaction should be linear19,24 so that the first order exchange kinetics can be written as35,36
| |
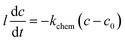 | (4) |
where
l is the thickness of the electrode,
c the concentration of the oxygen vacancy in the electrode,
kchem the constant for the surface oxygen exchange, and
c0 the initial concentration of oxygen vacancy. Since the electrical conductivity
σ is linearly proportional to the concentration of the oxygen vacancy
c, then
| |
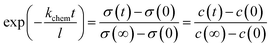 | (5) |
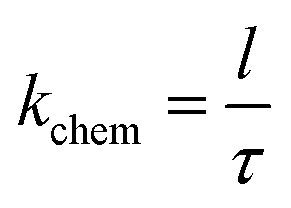
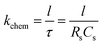
and the surface exchange constant is related to the time constant
τ of the above the exponential function as
| |
 | (6) |
Thus, the constant for the oxygen surface exchange process can be determined by the time constant. The frequency domain represents the process of the oxygen extraction and incorporation. Thus, the parallel of Rs and Cs circuit will determine the time constant τ.
where
ω is the frequency from the impedance spectra so that the chemical surface exchange coefficient can be represented by the resistance and capacitance data.
| |
 | (8) |
We now examine the results of our EIS measurements on the basis of the reaction kinetics discussed in the previous section. Since the dissociative adsorption and the incorporation processes of CO2 reduction would involve some activation energies Ea, one would expect kchem ∝ exp(−Ea/RT). Thus, we examine the Arrhenius plots, ln![[thin space (1/6-em)]](https://www.rsc.org/images/entities/char_2009.gif) kchem vs. 1/T, to probe the activation energy. In our analysis we employ the results of the second and third cycle EIS measurements, because the Arrhenius plots for the first cycle EIS measurements exhibit a nonlinear behavior unlike those of the second and third cycle data. The latter is due most likely to the fact that, during the first cycle EIS measurements, the temperature increases from 973 to 1173 K in CO2 ambient would totally alter the oxygen vacancy distribution in the PBCO electrodes because the as-grown symmetric cells were annealed under 200 Torr oxygen at 1123 K (for further discussion, see the ESI†).
kchem vs. 1/T, to probe the activation energy. In our analysis we employ the results of the second and third cycle EIS measurements, because the Arrhenius plots for the first cycle EIS measurements exhibit a nonlinear behavior unlike those of the second and third cycle data. The latter is due most likely to the fact that, during the first cycle EIS measurements, the temperature increases from 973 to 1173 K in CO2 ambient would totally alter the oxygen vacancy distribution in the PBCO electrodes because the as-grown symmetric cells were annealed under 200 Torr oxygen at 1123 K (for further discussion, see the ESI†).
The kchem of the CO2 reduction is approximately two orders smaller than that in oxygen.24 As presented in Fig. 3, the lnkchem vs. 1/T plots. These are linear when T is lower than ∼1073 K leading to Ea = 1.1 eV. The maximum of kchem reaches 2.0 × 10⁻⁴ cm s−1 at 1147 K. As the temperature is increased above ∼1073 K, the lnkchem vs. 1/T plots become nonlinear such that Ea decreases gradually eventually becoming zero at ∼1147 K and becoming negative above ∼1172 K. The similar behavior of the conductivity of PBCO powder was reported by Choi.40 To gain further insight into the change in Ea discussed above, it is important to note that kchem is proportional to 1/RsCs (eqn (8)). Therefore, one should examine the Arrhenius plots, lnRs vs. 1/T and lnCs vs. 1/T plots. The ln(1/Rs) vs. 1/T plot is linear in the whole temperature region (Fig. 3(a)). However, the ln(1/Cs) vs. 1/T plot (Fig. 3(b)) is not linear for the entire measured temperature region. It is Cs that makes the lnkchem vs. 1/T deviate from a linear behavior. By carefully examining the nonlinear behavior of the surface capacitance, it is interesting to find that there is a transition occurs around 1073 K in the surface capacitance curve. This transition can be interpreted to be associated with the different surface distributions in two temperature zones. (it is highly like that the order oxygen vacancy forms at the low temperature region and disorder oxygen vacancy at the high temperature region)41 More exact to say, the surface charge density quickly changes with the increases of the temperature, which will result from the change of the oxygen vacancy structure and density at high temperatures.42 Similar behaviors were reported in the previous research by Choi et al.37 and the oxygen reaction kinetics in the LaBCO thin films system.17
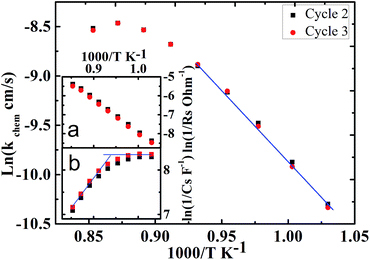 |
| | Fig. 3 The Arrhenius plots lnkchem vs. 1/T, the inset (a) ln(1/Rs) vs. 1/T, and (b) ln(1/Cs) vs. 1/T. | |
Conclusions
The CO2 reduction on the PBCO electrodes of PBCO/YSZ/PBCO symmetric cell was systematically studied by EIS measurements. The Arrhenius plot, lnkchem vs. 1/T, shows low activation energy of Ea = 1.1 eV below ∼1073 K for the CO2 reduction. However, the activation energy decreases gradually and becomes negative in the higher temperature region. The kchem reaches a maximum 2.0 × 10⁻⁴ cm s−1 at 1147 K. The change in Ea at temperatures above ∼1073 K can be attributed to the change in the stoichiometry of the PBCO electrode and that in the physisorption and chemisorptions mode of CO2 on the electrode surface.
Conflicts of interest
There are no conflicts to declare.
Acknowledgements
This work was supported by the Department of Energy under DE-FE0003780. Dr Xing Xu and Dr Shanyong Bao would like to acknowledge the supports from the “China Scholarship Council” for their PhD research at UTSA and “Materials Research Graduate (MRG) Fellowship” of UTSA.
References
- H. J. Freund and M. W. Roberts, Surf. Sci. Rep., 1996, 25, 225–273 CrossRef.
- R. J. Lim, M. S. Xie, M. A. Sk, J. M. Lee, A. Fisher, X. Wang and K. H. Lim, Catal. Today, 2014, 233, 169–180 CrossRef CAS.
- M. E. Dry, Appl. Catal., A, 2004, 276, 1–3 CrossRef CAS.
- T. Kim, S. Moon and S. I. Hong, Appl. Catal., A, 2002, 224, 111–120 CrossRef CAS.
- G. Tao, K. R. Sridhar and C. L. Chan, Solid State Ionics, 2004, 175, 615–619 CrossRef CAS.
- F. Bidrawn, G. Kim, G. Corre, J. T. S. Irvine, J. M. Vohs and R. J. Gorte, Electrochem. Solid-State Lett., 2008, 11, B167–B170 CrossRef CAS.
- G. O. Lauvstad, R. Tunold and S. Sunde, J. Electrochem. Soc., 2002, 149, E497–E505 CrossRef CAS.
- G. O. Lauvstad, R. Tunold and S. Sunde, J. Electrochem. Soc., 2002, 149, E506–E514 CrossRef.
- R. D. Green, C.-C. Liu and S. B. Adler, Solid State Ionics, 2008, 179, 647–660 CrossRef CAS.
- C. Y. Cheng, G. H. Kelsall and L. Kleiminger, J. Appl. Electrochem., 2013, 43, 1131–1144 CrossRef CAS.
- X. Yue and J. T. S. Irvine, J. Electrochem. Soc., 2012, 159, F442–F448 CrossRef CAS.
- O. A. Marina, N. L. Canfield and J. W. Stevenson, Solid State Ionics, 2002, 149, 21–28 CrossRef CAS.
- S. Li, Y. Li, Y. Gan, K. Xie and G. Meng, J. Power Sources, 2012, 218, 244–249 CrossRef CAS.
- W. Qi, Y. Gan, D. Yin, Z. Li, G. Wu, K. Xie and Y. Wu, J. Mater. Chem. A, 2014, 2, 6904–6915 CAS.
- T.-J. Huang and C.-L. Chou, Electrochem. Commun., 2009, 11, 1464–1467 CrossRef CAS.
- S. Pang, X. Jiang, X. Li, Z. Su, H. Xu, Q. Xu and C. Chen, Int. J. Hydrogen Energy, 2012, 37, 6836–6843 CrossRef CAS.
- Z. Yuan, J. Liu, C. L. Chen, C. H. Wang, X. G. Luo, X. H. Chen, G. T. Kim, D. X. Huang, S. S. Wang, A. J. Jacobson and W. Donner, Appl. Phys. Lett., 2007, 90, 3 Search PubMed.
- J. Liu, M. Liu, G. Collins, C. Chen, X. Jiang, W. Gong, A. J. Jacobson, J. He, J. Jiang and E. I. Meletis, Chem. Mater., 2010, 22, 799–802 CrossRef CAS.
- J. Liu, G. Collins, M. Liu and C. Chen, APL Mater., 2013, 1, 031101 CrossRef.
- G. Kim, S. Wang, A. J. Jacobson, L. Reimus, P. Brodersen and C. A. Mims, J. Mater. Chem., 2007, 17, 2500–2505 RSC.
- S. Bao, C. Ma, G. Chen, X. Xu, E. Enriquez, C. Chen, Y. Zhang, J. L. Bettis Jr, M.-H. Whangbo, C. Dong and Q. Zhang, Sci. Rep., 2014, 4, 4726 CrossRef PubMed.
- H. B. Wang, S. Y. Bao, J. Liu, G. Collins, C. R. Ma, M. Liu, C. L. Chen, C. Dong, M. H. Whangbo, H. M. Guo and H. J. Gao, J. Mater. Chem. C, 2014, 2, 5660–5666 RSC.
- C. Ma, M. Liu, G. Collins, J. Liu, Y. Zhang, C. Chen, J. He, J. Jiang and E. I. Meletis, Appl. Phys. Lett., 2012, 101, 021602 CrossRef.
- J. Liu, G. Collins, M. Liu, C. L. Chen, J. He, J. C. Jiang and E. I. Meletis, Appl. Phys. Lett., 2012, 100, 4 Search PubMed.
- J. J. Sprague, O. Porat and H. L. Tuller, Sens. Actuators, B, 1996, 36, 348–352 CrossRef CAS.
- S. D. Ebbesen, R. Knibbe and M. Mogensen, J. Electrochem. Soc., 2012, 159, F482–F489 CrossRef CAS.
- F. M. Sapountzi, S. Brosda, K. M. Papazisi, S. P. Balomenou and D. Tsiplakides, J. Appl. Electrochem., 2012, 42, 727–735 CrossRef CAS.
- M. Liu, J. Liu, G. Collins, C. R. Ma, C. L. Chen, J. He, J. C. Jiang, E. I. Meletis, A. J. Jacobson and Q. Y. Zhang, Appl. Phys. Lett., 2010, 96, 132106 CrossRef.
- G. Kim, S. Wang, A. J. Jacobson, Z. Yuan, W. Donner, C. L. Chen, L. Reimus, P. Brodersen and C. A. Mims, Appl. Phys. Lett., 2006, 88, 024103 CrossRef.
- V. C. Kournoutis, F. Tietz and S. Bebelis, Fuel Cells, 2009, 9, 852–860 CrossRef CAS.
- W. Zhou, B. An, R. Ran and Z. Shao, J. Electrochem. Soc., 2009, 156, B884–B890 CrossRef CAS.
- T. Horita, K. Yamaji, N. Sakai, H. Yokokawa, A. Weber and E. Ivers-Tiffee, Electrochim. Acta, 2001, 46, 1837–1845 CrossRef CAS.
- B. A. Boukamp, Solid State Ionics, 1986, 20, 31–44 CrossRef CAS.
- Y. M. L. Yang, A. J. Jacobson, C. L. Chen, G. P. Luo, K. D. Ross and C. W. Chu, Appl. Phys. Lett., 2001, 79, 776–778 CrossRef CAS.
- Y. L. Yang, C. L. Chen, S. Y. Chen, C. W. Chu and A. J. Jacobson, J. Electrochem. Soc., 2000, 147, 4001–4007 CrossRef CAS.
- F. S. Baumann, J. Fleig, H. U. Habermeier and J. Maier, Solid State Ionics, 2006, 177, 1071–1081 CrossRef CAS.
- J. Mizusaki, H. Tagawa, Y. Miyaki, S. Yamauchi, K. Fueki, I. Koshiro and K. Hirano, Solid State Ionics, 1992, 53, 126–134 CrossRef.
- U. Burghaus, Prog. Surf. Sci., 2014, 89, 161–217 CrossRef CAS.
- S. Y. Bao, X. Xu, E. Enriquez, B. E. Mace, G. Chen, S. P. Kelliher, C. L. Chen, Y. M. Zhang, M. H. Whangbo, C. Dong and Q. Y. Zhang, Appl. Phys. Lett., 2015, 107, 243903 CrossRef.
- S. Choi, J. Shin and G. Kim, J. Power Sources, 2012, 201, 10–17 CrossRef CAS.
- S. Streule, A. Podlesnyak, D. Sheptyakov, E. Pomjakushina, M. Stingaciu, K. Conder, M. Medarde, M. V. Patrakeev, I. A. Leonidov, V. L. Kozhevnikov and J. Mesot, Phys. Rev. B, 2006, 73, 094203 CrossRef.
- C. Frontera, A. Caneiro, A. E. Carrillo, J. Oro-Sole and J. L. Garcia-Munoz, Chem. Mater., 2005, 17, 5439–5445 CrossRef CAS.
Footnote |
| † Electronic supplementary information (ESI) available. See DOI: 10.1039/c7ra06362h |
|
| This journal is © The Royal Society of Chemistry 2017 |
Click here to see how this site uses Cookies. View our privacy policy here. 
 Open Access Article
 This Open Access Article is licensed under a
  *a and
Myung-Hwan Whangbob
*a and
Myung-Hwan Whangbob

 , and
, and  denote the adsorption site, the oxygen vacancy on the PBCO surface, and the oxygen atom in the PBCO lattice, respectively. In the dissociative adsorption process, CO2 is first adsorbed on the PBCO thin film to form various intermediates depending upon the processing temperatures.38 At the temperature from 973 to 1173 K, the intermediates are unstable and can quickly dissociate into CO and O at the oxygen vacancy positions on the PBCO surfaces (eqn (1)). Subsequently, the adsorbed atomic O will be ionized and incorporated into the oxygen vacancy on the PBCO surface lattices (eqn (2)). The previous study24 on the PBCO thin film electrode for the oxygen reduction showed that, at higher temperatures, the rate limiting step is not the incorporation but the adsorption process. The reactions of CO2 and O2 on PBCO have the same incorporation process, so that the rate limiting step in the CO2 reduction should also be the dissociative adsorption process. This is also the reason for the much smaller characterization frequency. At 973 to 1173 K, the reaction (2) should be very fast, so that the dissociative and incorporation processes may be combined together to give eqn (3). The rate of the reaction is dominantly governed by chemisorptions or the dissociative adsorption on the limited vacancy sites on the surface.