 Open Access Article
Creative Commons Attribution 3.0 Unported Licence
Crystallization and melting behavior of i-PP: a perspective from Flory's thermodynamic equilibrium theory and DSC experiment
Abdullah K. Ahmeda,
Muhammad Atiqullah*b,
Dev R. Pradhanc and
Mamdouh A. Al-Harthi*a
aDepartment of Chemical Engineering, King Fahd University of Petroleum & Minerals, Dhahran 31261, Saudi Arabia. E-mail: mamdouh@kfupm.edu.sa
bCenter for Refining & Petrochemicals, Research Institute, King Fahd University of Petroleum & Minerals, Dhahran 31261, Saudi Arabia. E-mail: matiq@kfupm.edu.sa
cAnalytical Laboratory, SABIC Technical Center, Riyadh 11551, Saudi Arabia
First published on 1st September 2017
Abstract
Crystallization and melting are integral parts of the isotactic polypropylene (i-PP) end-product fabrication process. Therefore, the nonisothermal crystallization kinetics and melting behavior of an un-nucleated commercial i-PP have been pursued by integrating a new nonisothermal crystallization model, Flory's thermodynamic equilibrium theory, Gibbs–Thompson equation, and DSC experiments. By applying this simple conceptual integration, the relative crystallinity α, temperature-dependent instantaneous crystallinity χ, the crystallization kinetic triplet, and the lamellar thickness distribution have been duly correlated, as appropriate, to the level of undercooling θ, crystal surface free energy D, and critical stable crystallite sequence number n*. Consequently, new insightful results, interpretations, and explanations have been concluded. The nonisothermal primary and secondary crystallizations of i-PP occur isokinetically with constant (temperature-, entropy-, and cooling rate-invariant) apparent kinetic energy Ea, which is also unaffected by θ, D, and the lamella-inclusive pendant –CH3 group of the propylene repeat unit. The crystal dimension nd varies, irrespective of θ and D, from cylinder to sphere, depending on the system entropic disorder. Instantaneous (athermal/heterogeneous) and sporadic (thermal/homogeneous) nucleation processes may co-prevail. The occurrence of lamellar thickening with increasing melting temperature has been discussed, considering the chain sliding diffusion theory proposed by Hikosaka et al., and the variation of θ and D. The present approach also applies to the evaluation of the influence of catalyst structure, backbone defect types, and their distribution on the crystallization and melt behavior of i-PP.
1. Introduction
Isotactic polypropylene (i-PP) is a polymorphic semi-crystalline large-volume low-price thermoplastic. It has several unique features such as high toughness, elasticity, transparency, and impermeability; ease of processability; excellent water and chemical resistance; and balanced physical and chemical properties. Therefore, it is gaining high importance in the polyolefin business, end-use, and application. Its major applications relate to the automobile industry, food packaging, and the manufacture of toys and furniture.1–6The fabrication of i-PP end-products involves heating and cooling which occur during processing. It melts and crystallizes upon heating and cooling, respectively. These phenomena affect the polymer structure which controls the ultimate properties listed above. The crystallization can be isothermal as well as nonisothermal. However, practical processes such as injection molding, extrusion molding, extrusion blow molding, and vacuum forming mostly undergo non-isothermal crystallization. Hence, it is very important to investigate i-PP nonisothermal crystallization, particularly the kinetics, and melting behavior to generate knowledge that can be used to efficiently operate industrial fabrication processes and manufacture end-products with better properties and improved performance.1–6
A review of the literature on overall polypropylene thermal behavior shows the following. The published nonisothermal crystallization studies relate to i-PP with and without nucleating agents7–10 and i-PP/inorganic filler micro- and nanocomposites.11–14 Here, the crystallization kinetics was investigated using Caze–Chuah, Jeziorny, Ozawa, Mo, and Seo–Kim models (as appropriate).7–14 However, the following can be commented regarding these models. They are not mechanistic; they are empirical; and they lack fundamental and phenomenological formalism. The model parameters do not always have adequate physical significance. Some of them do not represent the entire crystallization profile, and some experience double logarithm insensitivity and linearization problems. See ref. 15 for the details.
We particularly summarize the study by Alamo et al.16 who investigated, among several subjects, the effects of chain-walking defects on i-PP % crystallinity and melting point, considering Flory's equilibrium theory. These regio-defects, resulting from 3, 1 enchainment, were introduced into the polymer backbone by polymerizing propylene using selected nickel α-diimine precatalysts and methylaluminoxane (MAO) cocatalyst. They lowered the above thermal properties with reference to the corresponding Flory's equilibrium values. However, these authors did not investigate the influence of i-PP regio-defects on nonisothermal crystallization kinetics, which is an important subject.
We observe that the aforementioned i-PP nonisothermal crystallization studies and the report by Alamo et al.16 did not study the i-PP dynamic melting behavior and crystallization from Flory's equilibrium theory perspective, particularly considering the following three temperature-dependent dimensionless factors—level of undercooling θ, crystal surface free energy D, and critical stable crystallite sequence number n*. Our focused objective is the following. Can the integration of the fundamental mechanistic crystallization model (which we published in 2013),15 Flory's thermodynamic equilibrium theory.16–18 Gibbs–Thompson equation,19–23 and DSC experiments generate new and/or better insightful results, interpretations, and explanations regarding nonisothermal i-PP crystallization and melt process? Note that such an integrated conceptual framework to study the overall polyolefin thermal behavior, as far as we know, has not been yet published. Therefore, we undertake this study. The merits of our above crystallization model over the other literature models are well documented.15,24–26 This is based on mechanistic consideration. It applies to the entire DSC nonisothermal crystallization curve. The model-predicted kinetic parameters—apparent kinetic energy Ea, Avrami exponent n, and crystallization frequency factor k0—have physical significance.
We plan to pursue the above objective by correlating the relative crystallinity α, temperature-dependent instantaneous crystallinity χ, Ea, crystal dimension nd, nucleation mode nc, k0, and the lamellar thickness and melting temperature, as appropriate, to θ, D, and n*. The DSC experiments, as a function of heating/cooling rates, will be conducted using an alpha-phase commercial Ziegler–Natta i-PP without adding a nucleating agent.
2. Experimental
2.1 Materials
The pristine un-nucleated isotactic polypropylene (PP H1030) used in this study was a gift from National Industrialization Company (Tasnee), Saudi Arabia. As per the Tasnee data sheet, it has a melt flow rate (MFR) of 3 g/10 min at 230 °C and 2.16 kg load; and a density of 0.900 g cm−3.2.2 Molecular weight and polydispersity index
The experimental i-PP was characterized in terms of weight average molecular weight (Mw) and polydispersity index (PDI), using a Viscotek multidetector high temperature GPC (HT GPC Module 350A) instrument. The column temperature was set at 140 °C. The polypropylene sample (about 21.50 mg), taken in a 40 mL glass vial, was dissolved in 10.0 mL butylated hydroxy toluene BHT-stabilized-1,2,4 trichlorobenzene (TCB) as follows. The vial was closed with a Teflon cap. Then the sample was completely dissolved by placing it into the Vortex Auto Sampler for 3 h at 140 °C under mild stirring.Before injecting a sample, all the detectors—refractive index (RI) detector, and low angle and right angle light scattering (LALS and RALS) detectors—and the inlet pressure (IP), and the differential pressure (DP) cells were purged for 3 h using TCB to obtain a stable baseline. The flow rate of TCB was 1.0 mL min−1. The experimental i-PP sample, having a concentration of 2.15 mg mL−1, was injected into the system. The run time was 60 min. Viscotek OmniSEC software acquired the response data, generated by the LALS and RALS detectors, and calculated the weight average molecular weight Mw and the PDI, which are reported in Table 1. The measured Mw is comparable with the viscosity average molecular weight Mv of an equivalent MFR i-PP reported in the literature.27
| Properties | Heating/cooling rates β (°C min−1) | ||||
|---|---|---|---|---|---|
| 5.0 | 10.0 | 12.5 | 15.0 | 20.0 | |
| a Measured using GPC with light scattering detector.b Estimated from the work of Grein et al.27 Comparable with measured GPC Mw.c Matches very well the values determined by DSC.d ρpoly is comparable with that of Tasnee data sheet. Properties such as Tpm, Tpc, χc, ϕa, LWAV DSC GT, LMP DSC GT, TMP, θMP, and DMP are fairly invariant of cooling/heating rates. | |||||
| Weight average molecular weight Mwa (g mol−1) | 427![[thin space (1/6-em)]](https://www.rsc.org/images/entities/char_2009.gif) 500 500 |
||||
| Polydispersity index (PDI)a | 4.9 | ||||
| Viscosity average molecular weight Mvb (g mol−1) | 440![[thin space (1/6-em)]](https://www.rsc.org/images/entities/char_2009.gif) 500 500 |
||||
| Peak melting point Tpm (°C) | 161.7 | 160.7 | 161.1 | 161.7 | 160.7 |
| Peak crystallization point Tpc (°C) | 119.9 | 113.0 | 116.3 | 115.8 | 114.5 |
| Crystallinity χc (%) 3rd cycle | 44.54 | 46.57 | 46.34 | 46.70 | 44.68 |
| Crystallinity χc (%) 2nd cycle | 59.07 | 56.23 | 55.91 | 59.27 | 55.31 |
| i-PP material density ρpoly (g cm−3) | 0.893 | 0.899 | 0.895 | 0.904 | 0.895 |
| Amorphous volume fraction ϕa | 0.579 | 0.517 | 0.562 | 0.464 | 0.555 |
| Weight average lamellar thickness LWAV DSC GT (nm) | 7.1 | 6.9 | 6.4 | 6.7 | 6.1 |
| Most probable lamellar thickness LMP DSC GT (nm) | 6.7 | 6.8 | 6.8 | 6.8 | 6.7 |
| Variance of LTD σLTD (nm) | 2.8 | 2.8 | 2.5 | 2.7 | 2.5 |
| Most probable TMP (K) | 446.0 | 442.5 | 440.0 | 438.5 | 437.0 |
| Level of undercooling θMP | 0.37 | 0.35 | 0.33 | 0.31 | 0.28 |
| Crystal surface free energy DMP × 106 | 26.8 | 25.3 | 24.5 | 24.0 | 22.0 |
![[thin space (1/6-em)]](https://www.rsc.org/images/entities/char_2009.gif) |
|||||
| Tasnee data sheet properties | |||||
| Melt flow rate MFR (g/10 min) | 3.00 | ||||
| i-PP material density ρpoly (g cm−3) | 0.900c | ||||
2.3 Thermal property, density, and amorphous volume fraction
The thermal properties of the experimental i-PP were measured in terms of peak melting (Tpm) and crystallization (Tpc) temperatures, and % crystallinity (Xc) using a differential scanning calorimeter (DSC Q2000, Texas Instrument). The instrument was calibrated using indium. The three-cycle (heating–cooling–heating) experimental procedure reported in the literature was followed.24,28,29 About 5.50 mg i-PP flake sample was taken in an aluminum pan and was tightly crimped with a lid. A similar empty pan was used as a reference. The following heating/cooling rates—5.0, 10.0, 12.5, 15.0, and 20.0 °C min—were used under nitrogen flow. After keeping the sample and reference pans in the DSC instrument, Cycle 1 was completed as follows to remove thermal history and recrystallization. The sample was first heated from room temperature to 200.0 °C at a selected heating rate; then it was kept at this temperature for 5 min. In Cycle 2, it was cooled to room temperature at the same ramp. Finally, in Cycle 3, the sample was heated to 200.0 °C, also using the same heating rate. This means that Cycles 1 to 3 experienced the same heating or cooling rate in a typical DSC run.The data were acquired for each cycle and handled using the TA explorer software. The % crystallinity was determined using Cycle 3 DSC output and the following relation:  , where ΔHf and
  (207 J g−1)16,30,31 are the heats of fusion of the experimental sample and the perfect (defect-free) i-PP crystal (of infinite lamellar thickness and molar mass), respectively. The measured χc was subsequently used to calculate the material density ρpolym, following the rule of additivity of volumes of polypropylene amorphous and crystalline phases:32 χc = (1/ρpolym − 1/ρa)/(1/ρc − 1/ρa); where ρ = density; a = amorphous phase; c = crystalline phase; and polym = polymer. For polypropylene, ρc = 0.950 g mL−1 and ρa = 0.850 g mL−1.30 Next, the amorphous volume fraction ϕa was estimated using the relation ϕa = (ρc − ρ)/(ρc − ρa). Table 1 reports the above thermal properties of the experimental i-PP.
2.4 Microstructure of the experimental i-PP
The microstructural parameters (meso-pentad mole fractions) of the experimental i-PP were determined using 13C NMR spectroscopy. For this, a Bruker 600 MHz spectrometer was used. The sample was prepared at 120 °C by dissolving about 250 mg of the sample in a 10 mm NMR tube using 3 mL of the deuterated dimethyl sulfoxide (DMSO-d6)/trichlorobenzene (TCB) 10/90% (v/v) mixed solvent. The DMSO-d6 was used as an internal lock.The spectrum was recorded at 120 °C using WALTZ-16 decoupler, 30° pulse angle with pulse repetition time of 10 s. The free induction decays (FIDs) were stored in 32 K data points using a spectral width of 70 ppm. The experimental data were processed and analyzed using TOPSPIN software (version 2.0).
The spectral region of methyl carbon signals (22.60–19.50 ppm) was divided into three triad configurational sequences, that is, mm (22.60–21.10 ppm), mr (21.10–21.40 ppm), and rr (21.40–19.50 ppm). Each of the above triad regions was further split into three pentad configurational sequences using Lorentzian distribution functions.33 All the pentad sequence assignments and their mole fractions are listed in Table 2. These were used to calculate the meso-pentad sequence length (MSL)34 which is also called average isotactic sequence length.
| Configurational meso-pentad sequences | Chemical shift (in ppm) | Mole fractions | |
|---|---|---|---|
a  . The signals of mmrm and rmrr pentads overlap in the spectrum; hence, the sum (mmrm + rmrr) is obtained. To calculate MSL, the contribution of rmrr has been taken equal to that of rmrr.34 MSL is also called average isotactic sequence length. *Xmmmm = 0.855. . The signals of mmrm and rmrr pentads overlap in the spectrum; hence, the sum (mmrm + rmrr) is obtained. To calculate MSL, the contribution of rmrr has been taken equal to that of rmrr.34 MSL is also called average isotactic sequence length. *Xmmmm = 0.855. |
|||
| mmmm | mm-centered | 21.75 | 0.855* |
| mmmr | mm-centered | 21.56 | 0.028 |
| rmmr | mm-centered | 21.31 | 0.004 |
| mmrr | mr-centered | 20.02 | 0.032 |
| mmrm + rmrr | mr-centered | 20.87 | 0.016 |
| rmrm | mr-centered | 20.72 | 0.013 |
| rrrr | rr-centered | 20.35 | 0.011 |
| mrrr | rr-centered | 20.22 | 0.014 |
| mrrm | rr-centered | 19.92 | 0.027 |
3. Theoretical
3.1 Modeling of polypropylene crystallization kinetics
A new nonisothermal crystallization model15 for crystalline polymer using the Avrami–Erofeev equation was published by us in 2013. This model, with detailed assumptions and mathematical derivation, is reported in the above reference. Here, a summary is provided as follows.The nonisothermal Avrami–Erofeev polymer crystallization rate, involving nucleation and growth, can be written as:
 | (1) |
 | (2) |
 | (3) |
Ea (apparent![[thin space (1/6-em)]](https://www.rsc.org/images/entities/char_2009.gif) crystallization crystallization![[thin space (1/6-em)]](https://www.rsc.org/images/entities/char_2009.gif) energy) = Egrow − Enucl energy) = Egrow − Enucl
| (4) |
 | (5) |
 | (6) |
 | (7) |
In the above equations, f(α) is called Avrami–Erofeev nonisothermal crystallization function, and α is the temperature- or time-dependent volume fraction of the molten polymer solidified due to cooling. Therefore, α concerns the phase morphology of the whole sample (melt plus solid). It is called relative crystallinity or degree of crystallization. β is the cooling rate. n is the dimension of the growing crystal. No is the number of germ nuclei, that is, the potential nucleus formation sites/defects. Vo is the initial volume of the molten polymer. Ks is the shape factor for the growing nuclei. kgrow,0 and Egrow are the frequency factors and activation energy of crystal growth, respectively. Knucl,0 and Enucl represent the corresponding terms for nucleation, respectively. R is the universal gas constant, and To is the centering temperature.
The Avrami index n, in eqn (1), illustrates two aspects—the crystal dimension and the nature of nucleation process. Therefore, n is written in terms of the following two components:35
| n = nd + nn | (8) |
α(T) is related to the corresponding weight fraction relative crystallinity αw(T) through the following expression:15
 | (9) |
αw can be calculated from a typical constant cooling rate nonisothermal DSC experiment by using eqn (10):
 | (10) |
The experimental confirmation of the above new non-isothermal crystallization model is available in one of our recent publications.25 See Harkin-Jones et al.3 that comprehensively reviews the literature models.
3.2 Polypropylene melt behavior and crystallization: Flory's equilibrium theory treatment
Here, we first summarize the microstructural defects of a typical Ziegler–Natta (Z–N) i-PP. Ti-based Z–N catalysts, in the presence of internal and external donors, synthesize i-PP predominantly with stereo-defects introduced in the crystallizable isotactic propylene sequence of the backbone.38–40 The origin of stereo-defects has been elaborated elsewhere in the literature.41 This makes the i-PP backbone resembling that of, for example, a typical ethylene–α-olefin copolymer where the α-olefin introduces branching defects in the ethylene sequence of the backbone. Hence, an i-PP can be microstructurally defined to be a random stereo-copolymer with configurational defects along the backbone.40–42 See Scheme 1. Accordingly, the i-PP stereo-defect disrupts the backbone as the addition of the α-olefin does in polyethylene.41 Therefore, Flory's copolymer equilibrium theory16–18 can also be applied to the stereo-irregular Z–N i-PP.40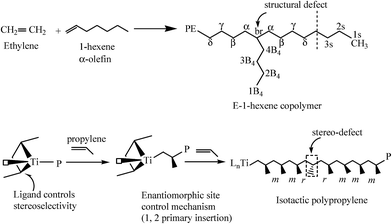 | ||
| Scheme 1 Comparison of the stereo-defect of an i-PP with the structural defect of a typical ethylene–α-olefin copolymer. The i-PP stereo-defects originate from enantiofacial error, chain-end epimerization, and chain-end effect.41 | ||
In a random ethylene–α-olefin copolymer, the ethylene perpetuation probability p, that is, the probability that a crystallizable unit is succeeded by another such unit is given by [XE + (1 − XE)/2] where XE is the average ethylene mole fraction.19,43 The term (1 − XE)/2 is the correction due to the incorporation of one –CH2– unit (or half C2H4 unit) per insertion of one α-olefin comonomer and exclusion of the pendant alkyl group (greater than methyl) from the chain fold. As per Scheme 1 and what is stated above, for an i-PP, the analogous propylene perpetuation probability p can be approximated by the crystallizable isotacticity index Xmmmm (meso-pentad) mole fraction.
According to the above description and Flory's copolymer equilibrium theory, the propylene perpetuation probability p can be related to the critical (limiting) sequence number n*(T) of the stable crystallite, that equilibrates with the melt at a given temperature, using the following equations:16–18
 | (11) |
 | (12) |
| D (crystal surface free energy effect) = e−2σeao/RT (dimensionless) | (13) |
Note that n*, θ, and D are dimensionless. Therefore, they offer a common footing to compare the melt behavior and crystallization of i-PPs of different structures under varying experimental conditions. In eqn (12), T0m (459.1 K) is the melting point of an isotactic polypropylene perfect crystal (completely defect-free i-PP of infinite lamellar thickness and molar mass). This is also called polypropylene equilibrium melting point. ΔHu (2100 cal mol−1 = 2 × 10⁹ erg cm−3) is the heat of fusion for perfect crystal i-PP repeat unit –[CH2–CH(CH3)]–, σe (96 erg cm−3) is the polypropylene basal/fold free surface energy, and ao (2.05 × 10⁵ m2 mol−1) is the cross-sectional area of a polypropylene chain.16,30,31 All these properties relate to alpha-phase i-PP. For a constant cooling rate nonisothermal DSC crystallization process, n*(T) evaluates the temperature-dependent dynamic critical crystallite stability. Only isotactic propylene sequences, greater than n*(T), form stable crystals. With increasing temperature, the crystals melt and n*(T) increases, and n* → ∞ represents the thickest possible crystals.18
4. Results and discussion
4.1 Crystallization kinetics of the experimental isotactic polypropylene
In this section, we address the nonisothermal crystallization kinetics of the experimental i-PP in terms of apparent crystallization activation energy Ea, frequency factor k0, crystal dimension nd, and nucleation mode nc. We discuss them considering five different Cycle 2 DSC cooling rates. . See eqn (14) and (15). Next, we converted the temperature integral into a real part and an exponential integral part.44 See eqn (16). This is how we integrated the temperature integral, which we finally transformed to the non-linear algebraic form. We solved this modified model equation using the Mathematica 8.0 Nonlinear Model Fit software. To = 370 K was used as the centering temperature. The LHS of eqn (16), containing −ln(1 − α), has a point of discontinuity at αfinal = 1. This was resolved by approximating αfinal ≅ 0.9999. Depending on the cooling rates, 30 to 45 experimental data points were considered for kinetic parameter estimation.
 | (14) |
 | (15) |
 | (16) |
 is the exponential integral of
  .
.We estimated the model parameters considering the following statistical criteria—95% confidence interval, coefficient of determination (R2), estimated variance, and standard error. The aforementioned Mathematica software eventually generates them. Convergence was accepted when the objective function changed less than the specified tolerance of 10−8. For the sake of brevity and sufficiency, we list only R2 for each of the estimated kinetic parameters. See Table 3.
| DSC cooling rates °C min−1 | Crystallization kinetics parameters | i-PP homopolymer |
|---|---|---|
| 5.0 | n | 3.50 |
| k0 (min−1) | 0.20 | |
| Ea (kJ mol−1) | 123.06 | |
| R2 | 0.9904 | |
| 10.0 | n | 3.00 |
| k0 (min−1) | 0.54 | |
| Ea (kJ mol−1) | 123.63 | |
| R2 | 0.9891 | |
| 12.5 | n | 2.60 |
| k0 (min−1) | 0.75 | |
| Ea (kJ mol−1) | 123.55 | |
| R2 | 0.9858 | |
| 15.0 | n | 2.38 |
| k0 (min−1) | 1.02 | |
| Ea (kJ mol−1) | 123.71 | |
| R2 | 0.9886 | |
| 20.0 | n | 2.13 |
| k0 (min−1) | 1.69 | |
| Ea (kJ mol−1) | 123.56 | |
| R2 | 0.9881 |
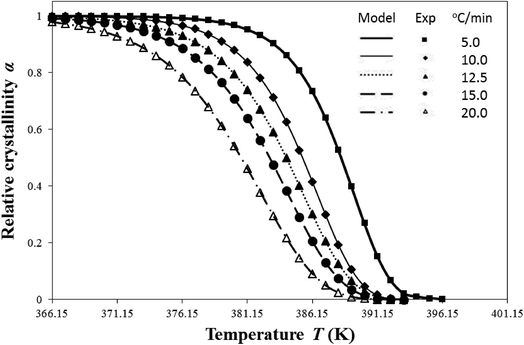 | ||
| Fig. 1 Comparison of model-predicted i-PP relative crystallinity profiles with DSC experiments for different cooling rates. | ||
Table 3 shows that the model-predicted nd ranges between 2 and 3, and it depends on the cooling rates. For β = 5.0 and 10.0 °C min−1, nd = 3; and for β = 12.5, 15.0, and 20.0 °C min−1, nd = 2. Hence, the resulting i-PP crystal dimension varies between spherical and cylindrical, that is, two and three dimensional alignments of the polymer backbone lamellae, corresponding to low and high cooling rates, respectively. Further, n has an integral part nd and a fractional part nn. Therefore, according to eqn (8), for the subject i-PP, instantaneous (athermal/heterogeneous) as well as sporadic (thermal/homogeneous) nucleations (0.00 ≤ nn ≤ 0.60) simultaneously prevail under the experimental cooling rates. The conformation of the –CH3 group, that is, the i-PP backbone stereo-defect does not deflect this model-prediction. Consider particularly the 5.0 °C min−1 model prediction in Table 3. Here, nd = 3 which indicates the formation of spherulite i-PP crystals. This model finding matches what Sajkiewicz et al.4 experimentally observed for crystallization of pristine i-PP at the above cooling rate, using polarized light microscopy.
The crystallization profiles—α versus T relations—feature very fast primary and slow (impinged) secondary crystallizations. We shall discuss them from the perspective of Flory's equlibrium theory, particularly in terms of the level of dimensionless undercooling θ and the crystal surface free energy D, at a later section.
Fig. 1 also confirms that a single Ea fits the well-known isokinetic Avrami–Erofeev crystallization mechanism throughout the entire i-PP crystallization process (primary plus secondary crystallization). Therefore, Ea is essentially constant of crystallization time or temperature and relative crystallinity α. Now we compare this finding with that published in the literature.
First, we consider the report by Harkin-Jones et al.3 who modeled nonisothermal DSC crystallization of an un-nucleated i-PP (FINA 4060S, MFR = 3.00 g/10 min at 230.0 °C and 2.16 kg load). Note that this MFR equals to that of our experimental sample. They evaluated a number of literature models, all of which incorporate arbitrary curve-fitting parameters. The two-parameter modified Ozawa model (with induction period), extended by Hammami, Spruiell, and Mehrotra49 performed the best.
Second, Zheng et al.5 modeled the nonisothermal crystallization of i-PP (MFR = 3.88 g/10 min at 230.0 °C and 2.16 kg load) considering an empirical nuclei density function, induction period, and temperature-dependent Hoffman–Lauritzen spherulite growth rate. This heuristic simulation model has the following limitations. It does not represent secondary crystallization for cooling rates exceeding 5.0 °C min−1. It also shows that effective activation energy varies with relative crystallinity α.
Both the above curve-fitting models have unfortunately no mechanistic, kinetic, and thermodynamic basis. Hence, the model parameters and predictions, unlike those of ours, are of limited physical significance.
Third, Supaphol et al.50 modeled the nonisothermal crystallization activation energy of selected aromatic polyesters and showed that it is a function of the relative crystallinity α. Depending on the polymer structure, it either monotonically increases, or it first increases and then it decreases as α increases. This variational trend was ascribed to the dependence of nucleation energy barrier on temperature. However, note that this explanation ignores isokinetic concept, crystal growth, as well as primary and secondary crystallizations. Hence, their model prediction and explanation are insufficient and unacceptable.
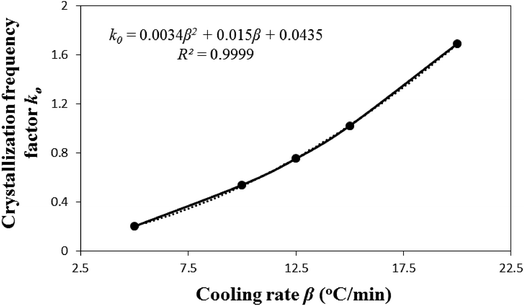
Fig. 2 illustrates that the model-predicted nonisothermal crystallization frequency factor k0 [defined by eqn (5)], for the experimental i-PP, well correlates to the cooling rate β (R2 = 0.9999). k0 progressively increases as β increases. Our physical interpretation of this correlation follows. Considering the relation between kinetics and thermodynamics, it can be shown that k0 ⇒ exp(S/R) or S ⇒ R![[thin space (1/6-em)]](https://www.rsc.org/images/entities/char_2009.gif) ln
ln![[thin space (1/6-em)]](https://www.rsc.org/images/entities/char_2009.gif) k0 where S is entropy of the system and R is the universal gas constant.51 Therefore, the entropy of the experimental i-PP nonisothermal crystallization increases as k0 and the cooling rate β increase. k0 is, therefore, a measure of entropy (system disorder) and it is cooling rate-dependent. Now, we revisit the growth of crystal dimension nd from the thermodynamic entropy perspective. Recall the results reported in Table 3. Low and increasing system disorders, among other factors, favor the growth of spherulitic and cylindrical crystals, respectively. This is a new model prediction for nonisothermal i-PP crystallization.
k0 where S is entropy of the system and R is the universal gas constant.51 Therefore, the entropy of the experimental i-PP nonisothermal crystallization increases as k0 and the cooling rate β increase. k0 is, therefore, a measure of entropy (system disorder) and it is cooling rate-dependent. Now, we revisit the growth of crystal dimension nd from the thermodynamic entropy perspective. Recall the results reported in Table 3. Low and increasing system disorders, among other factors, favor the growth of spherulitic and cylindrical crystals, respectively. This is a new model prediction for nonisothermal i-PP crystallization.
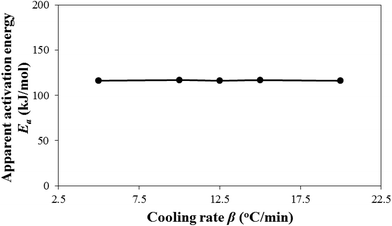
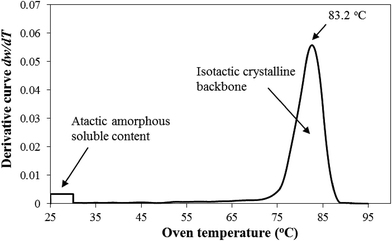
Fig. 3 shows the effect of cooling rates on the model-predicted apparent activation energy Ea = Egrow − Enucl. This is a major motif of this study. Ea does not practically vary with cooling rate β. Hence, it, unlike k0, is entropy-independent for the experimental i-PP nonisothermal crystallization. This result particularly differs from what Sahay and Krishnan have reported regarding the influence of β on activation energy of aromatic polyester crystallization.52 To fit the DSC data, these authors considered an effective activation energy Eea that consists of cooling rate-independent activation energy E0 and cooling rate-dependent activation energy E1, which are related to each other as follows: Eea = E0 + E1![[thin space (1/6-em)]](https://www.rsc.org/images/entities/char_2009.gif) ln(Aβ), where A is an arbitrary constant. Regrettably, this treatment, like the model by Hammami, Spruiell, and Mehrotra.49 has no mechanistic, kinetic, and thermodynamic basis. This is a purely data-fitting approach. Hence, the above effective crystallization activation energy concept cannot be accepted. By contrast, our model duly considers isokinetic concept, crystal growth, as well as primary and secondary i-PP crystallizations; and mathematically shows that the activation energy is temperature-, entropy-, and cooling rate-independent. The pendant –CH3 (methyl) group of i-PP, with that of the stereo-defect, despite being inclusive in the crystal lamella,18,38,42 does not affect the invariance of Ea. Fig. 4 shows the qualitative stereo-defect distribution (SDD) of the experimental i-PP. This was determined using Crystaf and following the procedure reported in the literature.53 The SDD is segregated mainly into the following two regions: (i) the defect-rich atactic (amorphous) soluble content (4.0 wt%), and (ii) defect-lean highly isotactic crystalline backbones (around peak crystallization temperature of 83.2 °C in TCB). The interference of the former into the melt crystallization of the latter, as per the model prediction, does not affect Ea either. The overall discrete meso-pentad distributions listed in Table 2 complement Fig. 4. They were determined using 13C NMR spectroscopy.34,54
ln(Aβ), where A is an arbitrary constant. Regrettably, this treatment, like the model by Hammami, Spruiell, and Mehrotra.49 has no mechanistic, kinetic, and thermodynamic basis. This is a purely data-fitting approach. Hence, the above effective crystallization activation energy concept cannot be accepted. By contrast, our model duly considers isokinetic concept, crystal growth, as well as primary and secondary i-PP crystallizations; and mathematically shows that the activation energy is temperature-, entropy-, and cooling rate-independent. The pendant –CH3 (methyl) group of i-PP, with that of the stereo-defect, despite being inclusive in the crystal lamella,18,38,42 does not affect the invariance of Ea. Fig. 4 shows the qualitative stereo-defect distribution (SDD) of the experimental i-PP. This was determined using Crystaf and following the procedure reported in the literature.53 The SDD is segregated mainly into the following two regions: (i) the defect-rich atactic (amorphous) soluble content (4.0 wt%), and (ii) defect-lean highly isotactic crystalline backbones (around peak crystallization temperature of 83.2 °C in TCB). The interference of the former into the melt crystallization of the latter, as per the model prediction, does not affect Ea either. The overall discrete meso-pentad distributions listed in Table 2 complement Fig. 4. They were determined using 13C NMR spectroscopy.34,54
Based on the overall findings of Fig. 1 and 3, this study confirms the invariance of activation energy articulated by Galwey and co-thinkers,55,56 and does not support the concept of variable instantaneous activation49,50,52,57–59 which is practiced in analyzing nonisothermal crystallization kinetic data. This conclusion originates from the correct application of isokinetic concept and the current nonisothermal Avrami–Erofeev crystallization model, and the appropriate calculation algorithm that we developed. This is how we address in this study the mathematical artefact that exists in the literature.
Now, we evaluate the effect cooling rate β on the rate of nucleation with respect to that of the crystal growth as follows.
Using eqn (4) to (7), we drive the following relation:
 | (17) |
We expand  of eqn (17), according to Taylor series, as:
 | (18) |
We calculated  (dimensionless apparent crystallization energy), as a function of β for the experimental i-PP, using the present crystallization model-predicted Ea and the Cycle 2 DSC data. We found the following: 0.0355 ≤
  ≤ 0.0384; hence,
  ≪ 1. So, eqn (18) can be written as
  . This reduces eqn (17) to
  . Accordingly, we estimated
  . Fig. 5 shows how β affects
  . The effect is more pronounced at lower value of β such as 5.0 °C min−1; with the increase in β,
  decreases and tends to assume an asymptotic value.
  , as shown above, is inversely related to k0 where k0 ⇒ exp(S/R) or S ⇒ R
![[thin space (1/6-em)]](https://www.rsc.org/images/entities/char_2009.gif) ln
ln![[thin space (1/6-em)]](https://www.rsc.org/images/entities/char_2009.gif) k0, and k0 increases with β (see Fig. 2). Therefore, low system entropic disorder, that corresponds to low β, increases the nucleation rate by several folds over the crystal growth rate. This effect, with the increase in β, that is, entropy shows to gradually diminish. The above finding is another manifest of the merit of the new crystallization model. Such a result does not appear in the literature.
k0, and k0 increases with β (see Fig. 2). Therefore, low system entropic disorder, that corresponds to low β, increases the nucleation rate by several folds over the crystal growth rate. This effect, with the increase in β, that is, entropy shows to gradually diminish. The above finding is another manifest of the merit of the new crystallization model. Such a result does not appear in the literature.
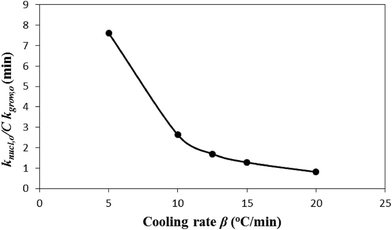 | ||
Fig. 5 Effect of cooling rate β on  that predicts the rate of nucleation with respect to that of crystal growth. that predicts the rate of nucleation with respect to that of crystal growth. | ||
Based on the preceding discussion, we conclude that the nonisothermal primary and secondary crystallizations of the experimental i-PP occur isokinetically with constant (temperature-, entropy-, and cooling rate-invariant) apparent kinetic energy. The crystal dimension varies between cylinder and sphere while instantaneous (athermal/heterogeneous) and sporadic (thermal/homogeneous) nucleations can co-occur. The cooling rate and system entropy influence the rate of nucleation over that of the crystal growth.
4.2 Melting behavior and crystallization of i-PP: Flory's equilibrium theory perspective
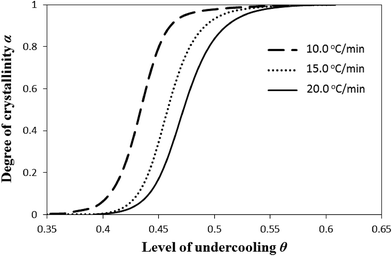
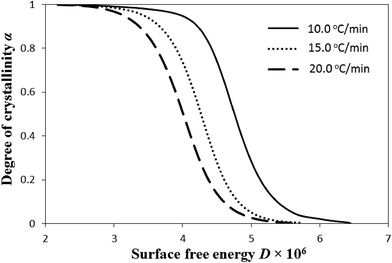
In this section, we discuss the melting behavior and crystallization of the experimental i-PP from Flory's equilibrium theory perspective, particularly considering the following three temperature-dependent dimensionless factors—critical stable crystallite sequence number n*, level of undercooling θ, and crystal surface free energy D. See eqn (11)–(13), respectively.First, we evaluate the influence of the level of undercooling θ and crystal surface free energy D on the nonisothermal crystallization of i-PP. θ and D were calculated using eqn (12) and (13), respectively, and the Cycle 2 DSC data. Fig. 6 demonstrates that for a given cooling rate β and beyond induction/nucleation regime (α = 0.1), increasing θ sharply enhances the primary crystallization profile, and makes it proceed very fast. The plots shift rightward with the increase in β. Here, for a given value of the relative crystallinity (degree of crystallization) α, θ increases as β increases, without changing the apparent crystallization energy Ea. Also, see Fig. 2. On the other hand, the slower secondary crystallization (impingement of crystal growth) shows milder impact of θ on α; α gradually increases with the increase in θ. This finding differs from what we notice to happen in primary crystallization. The values of θ that correspond to the onset of primary and secondary crystallizations increase with the increase in β.
Fig. 7 investigates how crystal surface free energy D affects the nonisothermal crystallization of i-PP. The overall impact is opposite to that of the level of undercooling θ on relative crystallinity α. This is elaborated as follows. Here, a decrease in D rapidly accelerates the primary crystallization α. The plots shift leftward with the increase in the cooling rate β. For the same α, D decreases as β increases, without affecting Ea. On the contrary, during the slower secondary crystallization, α very gradually increases with the decrease in D. This trend deflects from the situation that prevails in primary crystallization. The onset secondary crystallization D decreases with the increase in β.
From the above overall findings of Fig. 6 and 7, we conclude that primary and secondary crystallizations originate from the increase and decrease in the level of undercooling and crystal surface free energy, respectively. In primary crystallization, the dα/dθ and −dα/dD are much higher than the corresponding derivatives in secondary crystallization. However, these two competitive temperature-dependent equilibrium theory parameters (θ and D), despite having opposite variational trend, do not change the apparent crystallization energy Ea, either as a function of cooling temperature or rate. To the best of our knowledge, these are insightful new explanations for the observed characteristics of the fairly fast nonisothermal primary crystallization and very slow secondary crystallization of i-PP.
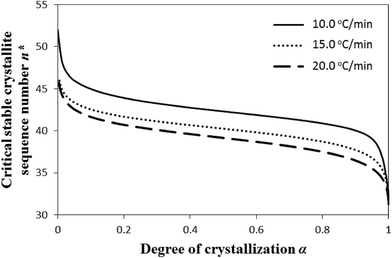
Fig. 8 is the consequence of the combined effect of the level of undercooling θ and crystal surface free energy D, expressed in terms of critical (limiting) sequence number n*, on the nonisothermal crystallization of i-PP. See eqn (11); Xmmmm = 0.855 (13C NMR value); MSL (meso sequence length) = 31 (Table 2). Xmmmm = 0.855 fairly matches the value that Tm = 161.0 °C, the melting point of our experimental i-PP, reads from Fig. 4 of Zhang et al.60 Note that n* signifies the sequence of the i-PP repeat unit –[CH2–CH(CH3)]– of the stable crystallite, that equilibrates with the melt at a given melt temperature. Hence, it measures the temperature-dependent dynamic critical crystallite stability. This figure shows how n* varies as a function of α with the progressive development of the crystallinity profile. For a given cooling rate β and beyond induction/nucleation regime (α = 0.1), n* fairly decreases as α sharply increases during primary crystallization. Here, for a given value of α, n* increases with the decrease in cooling rate β. During secondary crystallization, n* steeply decreases as α slowly increases. All the plots shift rightward with the decrease in β. The n* versus α functional variation does not affect the apparent crystallization energy Ea.
Fig. 9 compares the profiles of DSC-determined temperature-dependent instantaneous (dynamic) crystallinity χ(T) for different cooling rates. χ(T) was estimated using the following relation:
 | (19) |
 is the heat of fusion (8786.4 J mol−1 = 207 J g−1) of the perfect i-PP crystal (of infinite lamellar thickness and molar mass). Therefore, χ(T), unlike relative crystallinity α(T), is heat of fusion-based crystallinity that concerns the phases of the material solidified from the cooling melt.
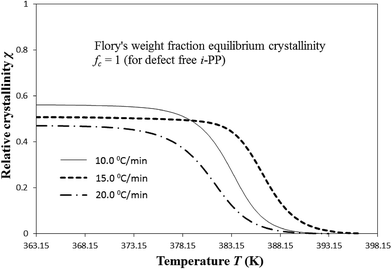 | ||
| Fig. 9 Variation of temperature-dependent instantaneous Cycle 2 crystallinity χ with cooling temperature. | ||
The Cycle 2 DSC crystallization data were applied to calculate χ(T). For each cooling rate β, the χ versus T relation shows the following common trend. χ initially increases fairly sharply as T decreases with continued cooling. However, below a critical cooling temperature Tc,critical, it asymptotically flattens (which indicates hindrance (impingement) to the further development of crystallinity), and is not any further affected by decreasing T and hence, the level of undercooling θ and crystal surface free energy D. At T < Tc,critical, defect-rich i-PP chains, having slower melt chain dynamics, crystallize.16 Tc,critical decreases with the increase in β. Only above Tc,critical, the following happens:
(i) χ shows to be temperature-dependent; and
(ii) χ(T) increases as θ increases, and D and critical stable crystallite sequence number n* decrease with the decrease in T.
The asymptotic value of χ equals to the Cycle 2 DSC % crystallinity of the i-PP sample. χ (asymptotic or non-asymptotic), for a given cooling rate, is always much less than Flory's weight fraction equilibrium crystallinity fc, which for a defect-free i-PP homopolymer is equal to unity. The predicted crystallinity difference (with respect to fc = 1) may be attributed to the topology and the eventual kinetic restraint with reference to Flory's equilibrium theory.16,61–64 Therefore, crystallinity may be improved by decreasing the kinetic and topological restraints. By topology, we mean the crystallizable isotactic polypropylene sequence length distribution SLD (due to stereo-defects), the density of chain entanglement, and the configuration of the folding lamellae. Note that according to the equilibrium theory, only sequences exceeding a certain critical length crystallize. The SLD reduces the exceedingly long sequences required for equilibrium. On the other hand, the resulting kinetic constraint imposes hindrance to nucleation and crystal growth, and impinges the growing centers. The crystallization of particularly the very long sequences becomes especially difficult. Consequently, the experimental i-PP does not achieve the structural topology stipulated by the equilibrium requirements, and its melting point, heat of fusion, and crystallinity decrease.
Here, we address the effects of the level of undercooling θ and crystal surface free energy D on the melting behavior of i-PP. See Fig. 10. θ and D were calculated using eqn (12) and (13), respectively, and the Cycle 3 DSC melting data. The lamellar thickness L of folded chain crystal (FCC) of the experimental Z–N i-PP—a random stereo-copolymer40–42 with configurational defects along the backbone—was calculated using the following version of Gibbs-Thompson thermodynamic equation:19–23
 | (20) |
 | (21) |
 | (22) |
 | ||
| Fig. 10 Variation of lamellar thickness L, level of undercooling θ, and crystal surface free energy D as a function of cooling temperature. Plots for all the experimental heating rates overlapped. | ||
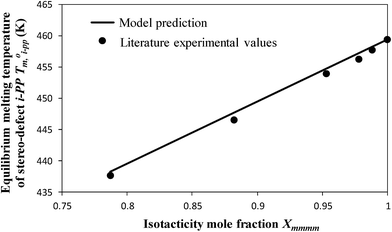 | ||
| Fig. 11 Comparison of the thermodynamic model-predicted equilibrium melting temperature T0m,i-PP of an i-PP (with stereo-defects) with that published in the literature. | ||
The following alpha-phase perfect crystal (of infinite lamellar thickness and molar mass) parametric values16,30,31 were applied to the above equations: T0m = 459.1 K,  = 8786.4 J mol−1 (207 J g−1), and σe (crystal specific surface free energy) = 0.096 J m−2.
As per Flory's thermodynamic equilibrium theory, melting and crystallization are both reversible. This figure shows that melting first starts with the smaller defect-rich lamellae at lower temperatures, and higher undercooling favors this. On the other hand, the larger defect-free lamellae melt later at higher temperatures, which occurs due to lower level of undercoling θ. In either case, the lamella melting temperature is always less than the equilibrium melting temperature T0m of the perfect crystalline i-PP (459.1 K). Compare Fig. 10 observation with that of Fig. 4. However, the effect of crystal surface free energy D on melting behavior of i-PP differs from that of θ. Here, D, unlike θ, increases as the melting temperature increases, and consequently the smaller to larger lamellae sequentially melt. In summary, lamellar thickening occurs with the decrease of θ, and increase of melting temperature and D. This phenomenon significantly increases in the molten mobile phase. The chain sliding diffusion theory proposed by Hikosaka et al.,66–68 combined with the above variation of θ and D support this lamellar thickening behavior. The heating rate does not affect this phenomenon. These are insightful findings, and to the best of our knowledge, they have not been reported earlier in the literature.
Overall, θ and D inversely influence the i-PP melting phenomenon. This can be explained as follows. Eqn (12) shows that θ linearly increases as a function of  (where ΔT = T0m − T), and it mathematically expresses the undercooling profile of the experimental i-PP with reference to the polypropylene perfect crystal (having infinite MW and lamellar thickness, and θ = 0). Hence, it eventually shows the temperature gradient effect on i-PP melting. On the other hand, D decreases exponentially as a function of non-dimensional crystal surface free energy
  . See eqn (13). The above variational trends of θ and D are fundamentally related to the topologies of the lamellae and crystallite surface, which are affected by the architecture of the i-PP backbones. See Fig. 4.
Fig. 12 illustrates that the lamellar thickness L of the experimental i-PP crystal shows a distribution during melting. We calculated this lamellar thickness distribution (LTD) as follows. L was estimated using eqn (20) and (21), and the corresponding mass fraction mTj (at a given temperature Tj), by applying eqn (23) and the Cycle 3 DSC data:25
 | (23) |
 | ||
| Fig. 12 Variation of mass fraction of crystal lamellae melted, level of undercooling θ, and crystal surface free energy D as a function of lamellar thickness L. | ||
The above figure also demonstrates the relation that exists among the LTD, the level of undercooling θ, and crystal surface free energy D. The LTD plots particularly show that a substantial mass fraction of the crystal lamellae melts at lower θ and higher D. See the LTD at the right side of the vertical line. Also, the most probable lamellar thickness LMP, melting temperature TMP, level of undercooling θMP, and crystal surface free energy DMP are found to be a weak function of cooling rate β. See Table 1. All these most probable properties, for a given β, that correspond to the maximum mass fraction of the LTD, show lower θ and higher D.
5. Conclusions
Isotactic polypropylene (i-PP) is a highly important polyolefin thermoplastic that fabricates multitude of end-products. Melting and crystallization are integral parts of this fabrication process. Therefore, this report revisits the nonisothermal crystallization kinetics and melt behavior of a commercial Ziegler–Natta i-PP by integrating a new nonisothermal crystallization model (which we published in 2013), Flory's thermodynamic equilibrium theory, Gibbs–Thompson equation, and nonisothermal DSC experiments. Flory's equilibrium theory has been applied by considering that an i-PP can be microstructurally defined to be a random stereo-copolymer having configurational defects along the backbone. By applying the above simple conceptual integration, the relative crystallinity α, temperature-dependent instantaneous crystallinity χ, the crystallization kinetic triplet, and lamellar thickness and melting temperature have been duly correlated, as appropriate, to the following dimensionless factors—level of undercooling θ, crystal surface free energy D, and critical stable crystallite sequence number n*. Consequently, new insightful results, interpretations, and explanations have been concluded. In particular, the following can be listed:• The nonisothermal primary and secondary crystallizations of i-PP occur isokinetically with constant (temperature-, entropy-, and cooling rate-invariant) apparent kinetic energy Ea, which is also unaffected by the level of undercooling θ, crystal surface free energy D, and the lamella-inclusive pendant –CH3 group of the i-PP repeat unit. The crystal dimension nd varies, independent of θ and D, from cylinder to sphere. Low and high system disorder (entropy), among other factors, favor the growth of spherulitic and cylindrical crystals, respectively. Instantaneous (athermal/heterogeneous) and sporadic (thermal/homogeneous) nucleation processes may co-occur. The cooling rate and system entropy influence the rate of nucleation over that of the crystal growth.
• The very rapid primary and slow secondary crystallizations originate from the increase and decrease in the level of undercooling θ and crystal surface free energy D, respectively. In primary crystallization, the dα/dθ and −dα/dD are much higher than the corresponding derivatives in secondary crystallization. Despite having inverse characteristics, θ and D, do not change Ea, either as a function of cooling temperature T or rate β.
• The temperature-dependent instantaneous (dynamic) crystallinity χ(T) increases as the level of undercooling θ increases, and crystal surface free energy D decreases with the decrease in T till an asymptotic value is reached.
• Smaller lamellae first melt at lower temperatures and higher level of undercooling θ. The reverse applies to the larger lamellae. The overall lamella melting temperature is always below the equilibrium melting temperature i-PP (459.1 K). The crystal surface free energy D, unlike θ, increases as the melting temperature increases, and consequently the smaller to larger lamellae sequentially melt. A substantial mass fraction of the lamella melts at lower θ and higher D.
• Lamellar thickening occurs with the decrease of θ, and increase of melting temperature, and D. This phenomenon significantly increases in the molten mobile phase. The chain sliding diffusion theory proposed by Hikosaka et al.,66–68 combined with the above variation of θ and D support this lamellar thickening behavior.
The approach of this study also applies to evaluate the influence of catalyst structure, backbone defect types, and their distribution on the crystallization and melt behavior of i-PP.
Conflicts of interest
There are no conflicts to declare.Acknowledgements
The authors greatly acknowledge the financial support provided for this study by King Abdulaziz City for Science and Technology (KACST) via the Science and Technology Unit (STU) at King Fahd University of Petroleum & Minerals (KFUPM) through Project Number 14-PET-283-04 as part of the National Science and Technology Innovation Plan (MAARIFAH). The technical assistance provided by the Department of Chemical Engineering, the Center for Refining & Petrochemicals (CRP) at KFUPM, Dhahran, Saudi Arabia; and SABIC Technical Center at Riyadh is also gratefully acknowledged. The technical assistance of Messrs. Anwar Hossaen and Sarath P. Unnikari and the gift of the polypropylene sample by National Industrialization Company (Tasnee) are thankfully appreciated.References
- C. C. Hsu, P. H. Geil, H. Miyaji and K. Asai, J. Polym. Sci., Part B: Polym. Phys., 1986, 24, 2379–2401 CrossRef CAS.
- M. L. Di Lorenzo and C. Silvestre, Prog. Polym. Sci., 1999, 24, 917–950 CrossRef CAS.
- Y. Mubarak, E. M. A. Harkin-Jones, P. J. Martin and M. Ahmad, Polymer, 2001, 42, 3171–3182 CrossRef CAS.
- A. Gradys, P. Sajkiewicz, A. A. Minakov, S. Adamovsky, C. Schick, T. Hashimoto and K. Saijo, Mater. Sci. Eng., A, 2005, 413, 442–446 CrossRef.
- S. Qiu, Y. Zheng, A. Zeng and Y. Guo, Thermochim. Acta, 2011, 512, 28–33 CrossRef CAS.
- M. Van Drongelen, T. B. Van Erp and G. W. M. Peters, Polymer, 2012, 53, 4758–4769 CrossRef CAS.
- S. Zhao and Z. Xin, J. Appl. Polym. Sci., 2009, 112, 1471–1480 CrossRef CAS.
- L. Xu, X. Zhang, K. Xu, S. Lin and M. Chen, Polym. Int., 2010, 59, 1441–1450 CrossRef CAS.
- J. Qin, X. Chen, J. Xu, Y. Wang, Y. Tian and S. Wu, J. Appl. Polym. Sci., 2010, 117, 1047–1054 CrossRef CAS.
- Y. H. Shi and Q. Dou, J. Therm. Anal. Calorim., 2013, 112, 901–911 CrossRef CAS.
- S. C. Tjong and S. A. Xu, Polym. Int., 1997, 44, 95–103 CrossRef CAS.
- W. Xu, M. Ge and P. He, J. Polym. Sci., Part B: Polym. Phys., 2002, 40, 408–414 CrossRef CAS.
- A. Fereidoon, M. G. Ahangari and S. Saedodin, J. Macromol. Sci., Part B: Phys., 2009, 48, 25–40 CrossRef CAS.
- M. G. Ahangari, A. Fereidoon, M. Kordani and H. Garmabi, Polym. Bull., 2011, 66, 239–258 CrossRef.
- M. Atiqullah, M. M. Hossain, M. S. Kamal, M. A. Al-Harthi, M. J. Khan, A. Hossaen and I. Hussain, AIChE J., 2013, 59, 200–212 CrossRef CAS.
- C. Ruiz-Orta, J. P. Fernandez-Blazquez, A. M. Anderson-Wile, G. W. Coates and R. G. Alamo, Macromolecules, 2011, 44, 3436–3451 CrossRef CAS.
- P. J. Flory, Trans. Faraday Soc., 1955, 51, 848–857 RSC.
- B. Crist and P. R. Howard, Macromolecules, 1999, 32, 3057–3067 CrossRef CAS.
- S. Hosoda, Y. Nozue, Y. Kawashima, K. Suita, S. Seno, T. Nagamatsu, K. B. Wagener, B. Inci, F. Zuluaga, G. Rojas and J. K. Leonard, Macromolecules, 2011, 44, 313–319 CrossRef CAS.
- P. J. Flory, J. Chem. Phys., 1949, 17, 223–240 CrossRef CAS.
- F. Chen, R. A. Shanks and G. Amarasinghe, Polym. Int., 2004, 53, 1795–1805 CrossRef CAS.
- M. R. Kamal, L. Feng and T. Huang, Can. J. Chem. Eng., 2002, 80, 432–442 CrossRef CAS.
- L. Feng and M. R. Kamal, Can. J. Chem. Eng., 2004, 82, 1239–1251 CrossRef CAS.
- M. Atiqullah, S. Anantawaraskul, A. M. Emwas, M. A. Al-Harthi, I. Hussain, A. Ul-Hamid and A. Hossaen, Ind. Eng. Chem. Res., 2013, 52, 9359–9373 CrossRef CAS.
- M. Atiqullah, M. M. Hossain, S. Adamu and A. Hossaen, Polym. Int., 2014, 63, 1824–1834 CrossRef CAS.
- M. Atiqullah, S. Adamu, M. M. Hossain, M. A. Al-Harthi, S. Anantawaraskul and A. Hossaen, J. Taiwan Inst. Chem. Eng., 2014, 45, 1982–1991 CrossRef CAS.
- C. Grein, M. Gahleitner, B. Knogler and S. Nestelberger, Rheol. Acta, 2007, 46, 1083–1089 CrossRef CAS.
- M. Atiqullah, M. S. Winston, J. E. Bercaw, I. Hussain, A. Fazal, M. A. Al-Harthi, A. H. Emwas, M. J. Khan and A. Hossaen, Polym. Degrad. Stab., 2012, 97, 1164–1177 CrossRef CAS.
- G. D. Wignall, R. G. Alamo, J. D. Londono, L. Mandelkern, M. H. Kim, J. S. Lin and G. M. Brown, Macromolecules, 2000, 33, 551–561 CrossRef CAS.
- G. W. Ehrenstein and R. P. Theriault, Polymeric Materials: Structure, Properties, and Applications, Hanser Verlag, 2001, pp. 67–78 Search PubMed.
- D. W. Van der Meer, Structure-property Relationship in Isotactic Polypropylene, PhD Thesis, University of Twente, The Netherlands, 2003.
- M. Atiqullah, M. A. Al-Harthi, S. Anantawaraskul and A. H. M. Emwas, J. Chem. Sci., 2015, 127, 717–728 CrossRef CAS.
- T. Hayashi, Y. Inoue, R. Chûjô and T. Asakura, Polymer, 1988, 29, 138–143 CrossRef CAS.
- R. Paukkeri, T. Väänänen and A. Lehtinen, Polymer, 1993, 34, 2488–2494 CrossRef CAS.
- M. Avrami, J. Chem. Phys., 1939, 7, 1103–1112 CrossRef CAS.
- A. T. Lorenzo, M. L. Arnal, J. Albuerne and A. J. Müller, Polym. Test., 2007, 26, 222–231 CrossRef CAS.
- M. Muthukumar, Adv. Chem. Phys., 2004, 128, 1–64 Search PubMed.
- D. L. Vanderhart, M. R. Nyden, R. G. Alamo and L. Mandelkern, Polym. Prepr., 2000, 82, 140–142 CAS.
- V. Busico, Adv. Polym. Sci., 2013, 257, 37–58 CrossRef CAS.
- D. W. Meer, J. Varga and G. J. Vancso, eXPRESS Polym. Lett., 2015, 9, 233–254 CrossRef.
- J. R. Severn and J. C. Chadwick, Tailor-made Polymers: Via Immobilization of Alpha-Olefin Polymerization Catalysts, Wiley-VCH Verlag GmbH & Co. KGaA, Weinheim, Germany, 2008 Search PubMed.
- S. Z. D. Cheng, J. J. Janimak, A. Zhang and E. T. Hsieh, Polymer, 1991, 32, 648–655 CrossRef CAS.
- G. Allegra, R. Marchessault and S. Bloembergen, J. Polym. Sci., Part B: Polym. Phys., 1992, 30, 809–815 CrossRef CAS.
- I. S. Gradshteyn and I. M. Ryzhik, Table of Integrals, Series, and Products, Academic Press, New York, 4th edn, 1980, p. 93 Search PubMed.
- G. Z. Papageorgiou, D. S. Achilias and G. P. Karayannidis, Polymer, 2010, 51, 2565–2575 CrossRef CAS.
- I. Acar, A. Durmuş and S. Özgümüş, J. Appl. Polym. Sci., 2007, 106, 4180–4191 CrossRef CAS.
- D. Olmos, C. Dominguez, P. D. Castrillo and J. Gonzalez-Benito, Polymer, 2009, 50, 1732–1742 CrossRef CAS.
- A. Adhikari and K. Lozano, J. Polym. Res., 2011, 18, 875–880 CrossRef CAS.
- A. Hammami, J. E. Spruiell and A. K. Mehrotra, Polym. Eng. Sci., 1995, 35, 797–804 CAS.
- P. Supaphol, N. Dangseeyun, P. Srimoaon and M. Nithitanakul, Thermochim. Acta, 2003, 406, 207–220 CrossRef CAS.
- K. A. Jackson, Kinetic Processes: Crystal Growth, Diffusion, and Phase Transitions in Materials, Wiley-VCH, Weinheim, Germany, 2nd edn, 2012 Search PubMed.
- S. S. Sahay and K. Krishnan, Thermochim. Acta, 2005, 430, 23–29 CrossRef CAS.
- B. Monrabal and P. del Hierro, Anal. Bioanal. Chem., 2011, 399, 1557–1561 CrossRef CAS PubMed.
- J. C. Randall, Polymer Sequence Determination: Carbon 13 NMR Method, Academic Press, New York, 1977 Search PubMed.
- A. K. Galwey, Eradicating Erroneous Arrhenius Arithmetic, Thermochim. Acta, 2003, 399, 1–29 CrossRef CAS.
- A. K. Galwey, Thermochim. Acta, 2003, 397, 249–268 CrossRef CAS.
- K. Chrissafis, K. M. Paraskevopoulos, S. Y. Stavrev, A. Docoslis, A. Vassiliou and D. N. Bikiaris, Thermochim. Acta, 2007, 465, 6–17 CrossRef CAS.
- G. Papageorgiou, D. N. Bikiaris and K. Chrissafis, Polym. Int., 2010, 59, 1630–1638 CrossRef CAS.
- H. Eloussifi, J. Farjas, P. Roura and M. Dammak, J. Therm. Anal. Calorim., 2012, 108, 597–603 CrossRef CAS.
- Q. Zhou, A. Wang, H. Li, Z. Luo, T. Zheng, L. Zhang and Y. Hu, RSC Adv., 2016, 6, 75023–75031 RSC.
- R. Alamo, R. Domszy and L. Mandelkern, J. Phys. Chem., 1984, 88, 6587–6595 CrossRef CAS.
- R. Alamo and L. Mandelkern, Macromolecules, 1991, 24, 6480–6493 CrossRef CAS.
- R. Alamo and L. Mandelkern, Thermochim. Acta, 1994, 238, 155–201 CrossRef CAS.
- B. Crist and T. M. Finerman, Polymer, 2005, 46, 8745–8751 CrossRef CAS.
- K. Yamada, M. Hikosaka, A. Toda, S. Yamazaki and K. Tagashira, Macromolecules, 2003, 36, 4790–4801 CrossRef CAS.
- M. Hikosaka, S. Rastogi, A. Keller and H. Kawabata, J. Macromol. Sci., Part B: Phys., 1992, 31, 87–131 CrossRef CAS.
- S. Rastogi, M. Hikosaka, H. Kawabata and A. Keller, Macromolecules, 1991, 24, 6384–6391 CrossRef CAS.
- M. Hikosaka, H. Okada, A. Toda, S. Rastogi and A. Keller, J. Chem. Soc., Faraday Trans., 1995, 91, 2573–2579 RSC.
| This journal is © The Royal Society of Chemistry 2017 |

