 Open Access Article
Synthesis and properties of an intrinsic flame retardant silicone rubber containing phosphaphenanthrene structure
Wei Chena,
Yuansen Liub,
Changan Xu*b,
Yuan Liu *a and
Qi Wanga
aThe State Key Laboratory of Polymer Materials Engineering, Polymer Research Institute of Sichuan University, Chengdu 610065, China. E-mail: liuyuan42001@163.com; Fax: +86-28-85402465; Tel: +86-28-85405133
bEngineering Research Centre of Marine Biological Resource Comprehensive Utilization, Third Institute of Oceanography, State Oceanic Administration, PR China. E-mail: xuchangan@tio.org.cn
First published on 15th August 2017
Abstract
A novel intrinsic flame retardant silicone rubber (SR) containing phosphaphenanthrene structure was synthesized in the present research. A series of characterizations including vertical burning testing, limiting oxygen index (LOI), microscale combustion calorimetry (MCC), thermogravimetric (TG) analysis and scanning electronic microscopy (SEM) showed that this SR possessed much quicker self-extinguishment, lower heat release rate, higher LOI and thermal stability as well as better charring capacity compared with unmodified SR. The char residues of the materials had been investigated in detail by Fourier transform infrared spectra (FT-IR) and X-ray photoelectron spectroscopy (XPS) to reveal the interactions between phosphaphenanthrene group and siloxane in the condensed phase. In addition, the corresponding physical properties such as transparence, dynamic and static mechanical performances were also evaluated.
1. Introduction
As one of the most important synthetic rubbers with excellent high and low temperature resistance, weathering ability, chemical resistance and good transparence, silicone rubber (SR) has been widely used in various fields including electrical industries, aerospace, automobile industry, etc.1,2 Over the past 60 years, the fast development of silicone materials has attracted the attention of the world.3 Despite that it possesses better flame retardancy as compared to other rubbers, SR exhibits self-sustaining combustion once ignited. This flammability restricts the applications of SR in those fields which have strict fire-proofing requirements. Therefore, it is significant to endow SR with satisfactory flame retardance through some modification methods.4 There were many related researches reporting on improving the flame retardance of SR by adding flame retardants or inorganic fillers,4–7 such as red phosphorus, clay, Al(OH)3, silica particles, wollastonite and so on. Yang8 et al. used a solution intercalation method to prepare methyl vinyl silicone rubber/montmorillonite nanocomposites, and the composites showed obviously higher thermal stability and flame-retardant properties than original SR. Chen et al.9 used pentaerythritol, POCl3 and modified expandable graphite to synthesize a new hybrid intumescent flame retardant added into SR; such a flame retardant system could produce a stable and compact charring layer on the SR surface to realize self-extinguishment. However, the additive-type flame retardants mentioned above also displayed some limitations including a decline of the mechanical properties, decrease of transparency and loss of the elasticity.10In order to overcome the shortcomings of physically adding flame retardants, the preparation of intrinsic flame retardant SR by chemically combining Br, Cl, P, etc., is more and more causing the interests of the researchers. However, there is no commercialized intrinsic flame retardant SR reported so far. In the present research, a reactive phosphorus compound, 9,10-dihydro-9-oxa-10-phosphaphenanthrene-10-oxide (DOPO) was used to react with the epoxy group of siloxane monomer to obtain a SR containing phosphaphenanthrene structure. The corresponding structure and properties of such an intrinsic flame retardant silicone rubber were analyzed and investigated.
2. Experimental section
2.1. Materials
9,10-Dihydro-9-oxa-10-phosphaphenanthrene-10-oxide (DOPO) was purchased from Shenzhen Jinlong Chemical Technology Co., Ltd., China. 3-Glycidyloxypropyltrimethoxysiloxane (GS), was purchased from China BlueStar Chengrand Research Institute of Chemical Industry (Chengdu, CHN). Alcohol was supplied by Chengdu kelong chemical reagent factory (Chengdu, CHN).2.2. Synthesis of PPGS and PGS
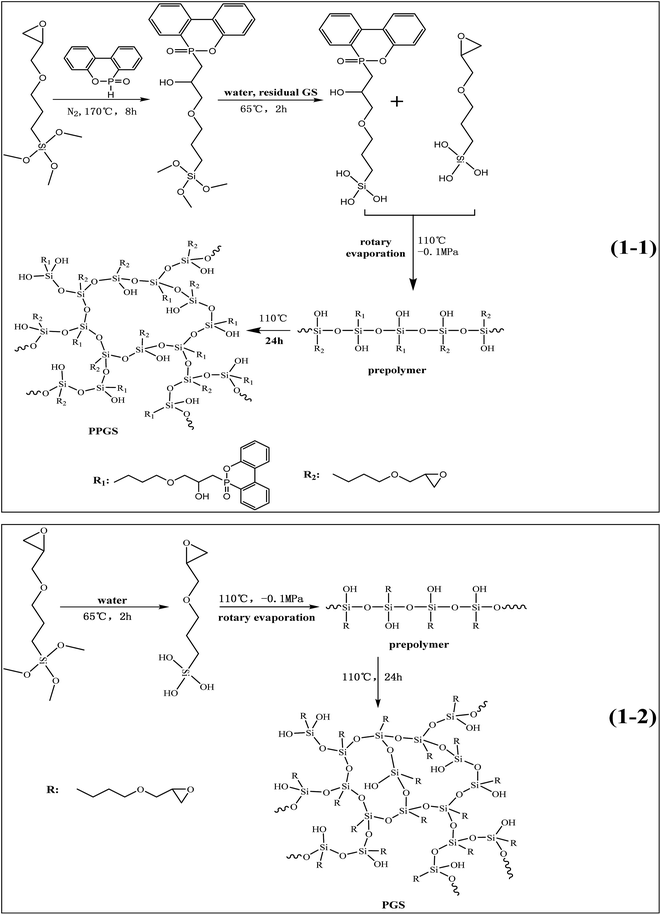
Scheme 1 shows the route of synthesizing PPGS and PGS. 54.00 g DOPO powder and 118.13 g GS (the molar ratio is 1![[thin space (1/6-em)]](https://www.rsc.org/images/entities/char_2009.gif) :
:![[thin space (1/6-em)]](https://www.rsc.org/images/entities/char_2009.gif) 2) were mixed at 120 °C until DOPO was dissolved completely in GS, and then the reagents were poured into a three-necked flask equipped with an oil-bath pot, a mechanical stirrer and a reflux condenser. The reaction temperature was maintained at 170 °C for 8 h under the atmosphere of nitrogen. After cooling to room temperature, adding 26.9 g deionized water, the reaction mixture was stirred at 65 °C for 2 h, then removed the volatiles of low boiling points with rotary evaporation (110 °C, −0.1 MPa) to obtain oily prepolymer. The prepolymer were poured into a mold, and then cured at 110 °C for 24 h. Finally, adding alcohol to wash the products repeatedly for removing the unreacted substance.
2) were mixed at 120 °C until DOPO was dissolved completely in GS, and then the reagents were poured into a three-necked flask equipped with an oil-bath pot, a mechanical stirrer and a reflux condenser. The reaction temperature was maintained at 170 °C for 8 h under the atmosphere of nitrogen. After cooling to room temperature, adding 26.9 g deionized water, the reaction mixture was stirred at 65 °C for 2 h, then removed the volatiles of low boiling points with rotary evaporation (110 °C, −0.1 MPa) to obtain oily prepolymer. The prepolymer were poured into a mold, and then cured at 110 °C for 24 h. Finally, adding alcohol to wash the products repeatedly for removing the unreacted substance.
The synthesis process of PGS was the same with the second and third step of PPGS.
DOPO/PGS composites was obtained by physically mixing DOPO powder (the same DOPO content with PPGS) and PGS prepolymer together, and then cured in a mold to obtain the final samples.
2.3. Characterization
13C and 1H Nuclear Magnetic Resonance (NMR) with prepolymer of PSR was performed using an AVANCE 600 Bruker Spectrometer (Bruker, Switzerland) using dimethyl sulfoxide as a solvent.FT-IR of PSR were recorded by a Nicolet 20SXB Infrared spectrometer (Thermo Fisher Co, USA), using a diamond single reflection attenuated total reflectance (ATR) accessory equipped by a zinc selenide crystal. The DOPO powder and char were ground and pressed with KBr respectively.
The vertical burning test was carried out by an HK-HVRA instrument made by Zhuhai Huake Testing Equipment Co. Ltd. (Zhuahai, CHN), with the bar dimensions of 125.0 × 13.0 × 3.0 mm3 according to ASTM D 3801-10.
LOI was measured using a Dynisco LOI instrument (Dynisco, USA), with the bar dimensions of 150.0 × 10.0 × 4.0 mm3 according to ASTM D2863-97.
TG in air atmosphere was tested in TGA4000 (PerkinElmer, USA). The samples of 8 mg were examined from the room temperature to 700 °C at a heating rate of 10 °C min−1 under a air atmosphere with a flow rate of 60 ml min−1.
MCC test was carried out using a FAA Micro Calorimeter (Fire Testing Technology Co, UK). The samples were heated to 700 °C at a heating rate of 1 °C s−1 in a atmosphere that the proportion of nitrogen to oxygen was 8![[thin space (1/6-em)]](https://www.rsc.org/images/entities/char_2009.gif) :
:![[thin space (1/6-em)]](https://www.rsc.org/images/entities/char_2009.gif) 2.
2.
The morphologies of the charring layers of the samples were observed by a scanning electronic microscope (SEM) (JSM-5900LV, JEOL Ltd., Tokyo, Japan) with a conductive gold layer coated and with an accelerating voltage of 10 kV. The charring samples were obtained after carbonization at 500 °C for 30 min in a muffle furnace.
XPS analysis of burned materials was performed using a Shimadzu/Kratos AXIS Ultra DLD multifunctional X-ray photoelectron spectrometer (Manchester, UK).
Dynamic mechanical analysis was undertaken using a dynamic mechanical thermal analysis (DMTA) apparatus (TA DMA Q800, USA). The specimens (3 mm × 13 mm × 30 mm) were tested in a single bending modes. The thermal transitions were studied in the −80 °C to 90 °C range at a heating rate of 3 °C min−1 and at a fixed frequency of 1 Hz.
The test of the light transmission ratio was performed according to ISO13468 standard by WGT-S Transmittance/Haze Meter (Shanghai, CHN). Each sample was measured five times and an average value was obtained.
The tensile tests of the samples were conducted at room temperature with a crosshead speed of 50 mm min−1 (ISO527) using a Reger RG L-10 universal mechanical testing machine (Shenzhen, CHN).
3. Results and discussion
3.1. Structural analysis
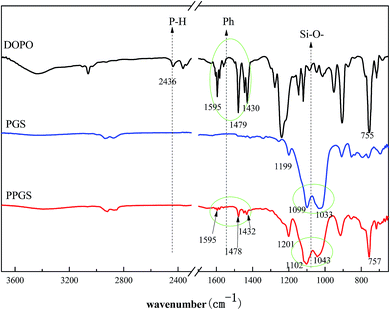
Firstly, FT-IR analysis was employed to analyze the structure of the obtained PSR. Fig. 1 showed the FT-IR spectra of DOPO, PGS and PPGS. The spectrum of PPGS seemed to be a typical combination of DOPO and PGS, it included the absorption peak at 1595 cm−1, 1478 cm−1, 1432 cm−1 which ascribed to stretching vibration of C![[double bond, length as m-dash]](https://www.rsc.org/images/entities/char_e001.gif) C from the phenyl group and 757 cm−1 ascribed to deformation vibration of C–H from the phenyl group, the absorption peak at 1201 cm−1 attributed to the deviational vibration of Si–C, the absorption peak at 1102 cm−1 and 1043 cm −1 attributed to the stretching vibration of the Si–O–Si. Particularly, the disappearance of the characteristic absorption peak assigned to P–H bonds at 2436 cm−1 suggested that DOPO had been completely consumed during the reaction.
C from the phenyl group and 757 cm−1 ascribed to deformation vibration of C–H from the phenyl group, the absorption peak at 1201 cm−1 attributed to the deviational vibration of Si–C, the absorption peak at 1102 cm−1 and 1043 cm −1 attributed to the stretching vibration of the Si–O–Si. Particularly, the disappearance of the characteristic absorption peak assigned to P–H bonds at 2436 cm−1 suggested that DOPO had been completely consumed during the reaction.
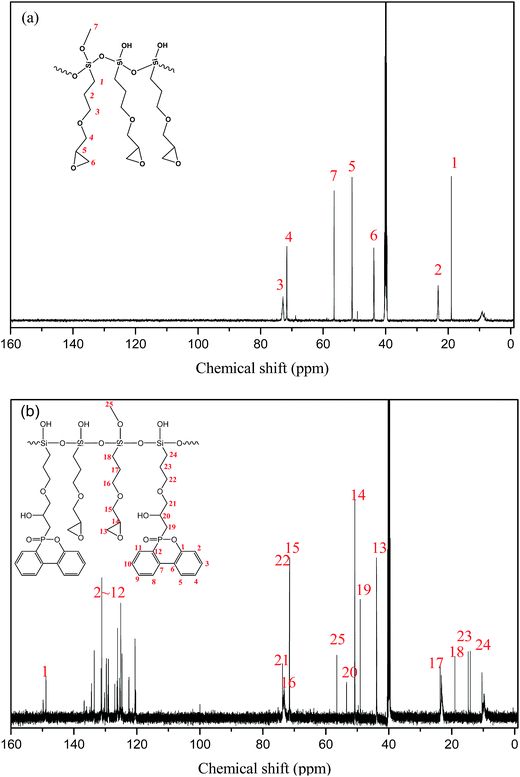
Besides, 13C NMR was utilized to further characterize the fine chemical structure by providing the information on the carbon skeleton as shown in Fig. 2. Comparing the spectra of PGS and PPGS, it could be seen that a series of new absorption peaks appeared in PPGS spectrum relative to PGS one, included the shifts at 120–150 ppm ascribed to phosphaphenanthrene structure, 49.07 ppm to P–C and 53.40 ppm to C–OH. Meanwhile, the peaks shift of the carbon atoms including 21–24 (the number of carbon atoms) displayed small displacement compared with the corresponding ones (15–18) owing to the impact of the phosphaphenanthrene structure. It implied that P–H was completely converted to O![[double bond, length as m-dash]](https://www.rsc.org/images/entities/char_e001.gif) P–C bonds.
P–C bonds.
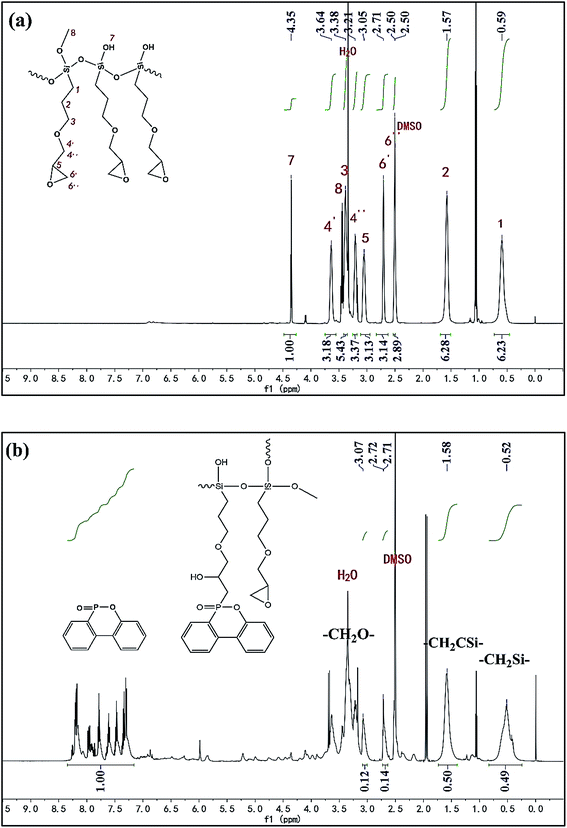
To further check the ratio of epoxy group and phosphaphenanthrene structure in PPGS, 1H NMR spectra was showed in Fig. 3. In 1H NMR spectrum of PGS, the protons of –CH2Si–and –CH2CSi– were observed at 0.59 ppm (2H) and 1.57 ppm (2H) respectively. For epoxy group, the proton of ![[triple bond, length as m-dash]](https://www.rsc.org/images/entities/char_e002.gif) CH corresponded to 3.051 ppm (1H), and the singlet at 2.71 ppm and 2.50 ppm (overlapped by the signal of DMSO) belonged to the two protons of –CH2–. In addition to this, the molar ratio of the protons of –CH2Si– to –CH2CSi– correspond with the integration value of signals (6.23
CH corresponded to 3.051 ppm (1H), and the singlet at 2.71 ppm and 2.50 ppm (overlapped by the signal of DMSO) belonged to the two protons of –CH2–. In addition to this, the molar ratio of the protons of –CH2Si– to –CH2CSi– correspond with the integration value of signals (6.23![[thin space (1/6-em)]](https://www.rsc.org/images/entities/char_2009.gif) :
:![[thin space (1/6-em)]](https://www.rsc.org/images/entities/char_2009.gif) 6.28 ≈ 1
6.28 ≈ 1![[thin space (1/6-em)]](https://www.rsc.org/images/entities/char_2009.gif) :
:![[thin space (1/6-em)]](https://www.rsc.org/images/entities/char_2009.gif) 1). It was also in accordance with its expected structure.
1). It was also in accordance with its expected structure.
In 1H NMR spectrum of PPGS, as the protons of –CH2O– were overlapped by the signal of H2O (from DMSO), the signal of –CH2Si– (0.52 ppm, 2H), –CH2CSi– (1.58 ppm, 2H) were chosen for quantitative determination. The singlet at 3.07 ppm belonged to the proton of ![[triple bond, length as m-dash]](https://www.rsc.org/images/entities/char_e002.gif) CH(1H) of epoxy group, its ratio of the integration value to that of –CH2Si– was 0.12
CH(1H) of epoxy group, its ratio of the integration value to that of –CH2Si– was 0.12![[thin space (1/6-em)]](https://www.rsc.org/images/entities/char_2009.gif) :
:![[thin space (1/6-em)]](https://www.rsc.org/images/entities/char_2009.gif) 0.49 ≈ 1
0.49 ≈ 1![[thin space (1/6-em)]](https://www.rsc.org/images/entities/char_2009.gif) :
:![[thin space (1/6-em)]](https://www.rsc.org/images/entities/char_2009.gif) 4, so the molar ratio of epoxy group to –CH2Si– was 1
4, so the molar ratio of epoxy group to –CH2Si– was 1![[thin space (1/6-em)]](https://www.rsc.org/images/entities/char_2009.gif) :
:![[thin space (1/6-em)]](https://www.rsc.org/images/entities/char_2009.gif) 2. On the other hand, these signals at 7.2–8.3 ppm attributed to phosphaphenanthrene structure (8H), the ratio of the integration value to that of –CH2Si– was 1.00
2. On the other hand, these signals at 7.2–8.3 ppm attributed to phosphaphenanthrene structure (8H), the ratio of the integration value to that of –CH2Si– was 1.00![[thin space (1/6-em)]](https://www.rsc.org/images/entities/char_2009.gif) :
:![[thin space (1/6-em)]](https://www.rsc.org/images/entities/char_2009.gif) 0.49 ≈ 2
0.49 ≈ 2![[thin space (1/6-em)]](https://www.rsc.org/images/entities/char_2009.gif) :
:![[thin space (1/6-em)]](https://www.rsc.org/images/entities/char_2009.gif) 1, so the molar ratio of phosphaphenanthrene structure to –CH2Si– was 1
1, so the molar ratio of phosphaphenanthrene structure to –CH2Si– was 1![[thin space (1/6-em)]](https://www.rsc.org/images/entities/char_2009.gif) :
:![[thin space (1/6-em)]](https://www.rsc.org/images/entities/char_2009.gif) 2. Finally, we can obtain the conclusion that the molar ratio of phosphaphenanthrene structure to epoxy group was about 1
2. Finally, we can obtain the conclusion that the molar ratio of phosphaphenanthrene structure to epoxy group was about 1![[thin space (1/6-em)]](https://www.rsc.org/images/entities/char_2009.gif) :
:![[thin space (1/6-em)]](https://www.rsc.org/images/entities/char_2009.gif) 1.
1.
3.2. Flame retardancy
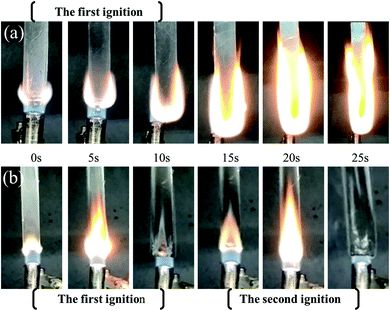
Table 1 exhibited the results of LOI and vertical burning test results of the synthesized SR. The introduction of phosphaphenanthrene structure greatly increased LOI value of PGS. From the combustion process of the above materials (Fig. 4), it could be seen that PGS bar did not extinguish once ignited during vertical flame test. In comparison, PPGS bar quickly self-extinguished after two ignitions. Obviously, the latter showed much better flame retardance and self-extinguishment.| Samples | LOI (%) | Self-extinction time after the first 10 s ignition (t1), s | Self-extinction time after the second 10 s ignition (t2), s | Flaming drips | Rating |
|---|---|---|---|---|---|
| PGS | 27.6 | No self extinction | — | None | NR |
| PPGS | 42.3 | 0 | 0 | None | V-0 |
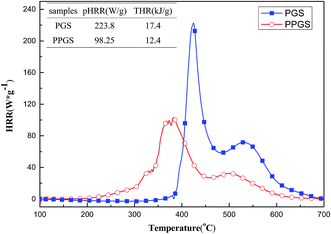
MCC is a convenient way to study the calorimetric behavior and combustion parameters of materials. Fig. 5 showed the HRR curves and the corresponding MCC data of the PGS and PPGS. It can be seen that with the introduced of phosphaphenanthrene structure, the peak heat release rate (PHRR) was decreased from 223.8 W g−1 to 98.25 W g−1, total heat release (THR) was decreased from 17.4 kJ g−1 to 12.4 kJ g−1. The calorimetric analysis results in accordance with the previous real flame tests.
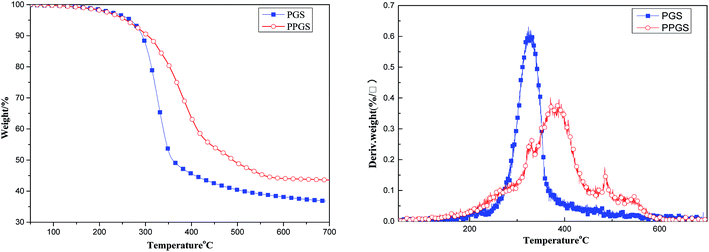
Fig. 6 showed thermogravimetric analysis of the above materials in air atmosphere. Due to the typical rigid structure of the introduced DOPO, the thermal stability of PPGS was greatly improved. From the DTG curves, the maximum decomposition temperature (Tmax) of PGS was only 326 °C, but Tmax of PPGS was increased to 388 °C. It was also observed there was only one step of thermal degradation for PGS, a probable explanation is that the random depolymerization mechanism was accompanied by the oxidation of organic groups combined with the silicon atoms. Oxygen radicals catalyzed the depolymerization of PGS to volatile cyclic oligomers, competing with oxidative crosslinking that stabilizes the material.11 In the case of PPGS, the resulting polyphosphoric acid from the oxidation of P could promote the formation of the charring char layer on the surface to prevent further thermal-oxidation degradation of inner matrix. On this occasion, oxidative crosslinking to form Si–O–Si network structure was dominant relative to degradation. Additionally, the small peak in DTG curve of PPGS at 484 °C was probably belong to the graphitization of the benzene ring in phosphaphenanthrene structure.12 The difference in degradation course between PGS and PPGS also resulted in different charring amount. The residual char ratio at 700 °C was 36.83% for PGS but 43.57% for PPGS.
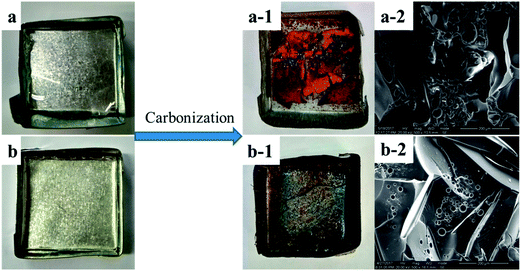
The following analysis focused on the structure and composition of the produced chars in the condensed phase. Fig. 7 showed the appearance of PGS and PPGS before and after carbonization as well as the micro-morphologies of their fracture section of the produced chars. It could be seen that the chars from PGS was broken into pieces, but the formed chars from PGGS could keep an integral shape. In addition, micro-morphology of the latter also showed better continuousness and compactness than that of the former. It is obvious that the char layer of PGGS possessed higher quality.
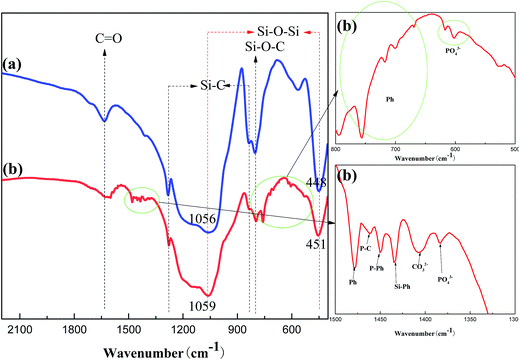
FT-IR was firstly used to analyze the structure of the above char layers as shown in Fig. 8. The FT-IR spectra of the char of PGS and PPGS had many peaks in common, included the stretching vibration of C![[double bond, length as m-dash]](https://www.rsc.org/images/entities/char_e001.gif) O around 1630 cm−1, the stretching vibration of Si–C around 830 cm−1, the deviational vibration of Si–C around 1280 cm−1, the stretching vibration absorption of Si–O–C around 800 cm−1 and stretching vibration absorption of Si–O–Si around 450 cm−1. Moreover, it could be observed that the double stretching vibration of the Si–O–Si structure around 1100 and 1040 cm−1 of PGS and PPGS before carbonization was transformed into a single absorbance peak around 1059 cm−1 after carbonization, meanwhile this peak also became wider, it proved that most of the Si–O–Si of polysiloxane convert to the Si–O–Si of SiO2. On the other hand, there were many new peaks in the spectrum of PPGS chars relative to PGS chars. The absorption peaks at 1478, 756, 717, 700 and 669 cm−1 were respectively ascribed to stretching vibration of C
O around 1630 cm−1, the stretching vibration of Si–C around 830 cm−1, the deviational vibration of Si–C around 1280 cm−1, the stretching vibration absorption of Si–O–C around 800 cm−1 and stretching vibration absorption of Si–O–Si around 450 cm−1. Moreover, it could be observed that the double stretching vibration of the Si–O–Si structure around 1100 and 1040 cm−1 of PGS and PPGS before carbonization was transformed into a single absorbance peak around 1059 cm−1 after carbonization, meanwhile this peak also became wider, it proved that most of the Si–O–Si of polysiloxane convert to the Si–O–Si of SiO2. On the other hand, there were many new peaks in the spectrum of PPGS chars relative to PGS chars. The absorption peaks at 1478, 756, 717, 700 and 669 cm−1 were respectively ascribed to stretching vibration of C![[double bond, length as m-dash]](https://www.rsc.org/images/entities/char_e001.gif) C and deformation vibration of C–H from the various substitution types of the benzene ring, which reflected the presence of polyaromatic structure in PPGS chars. Additionally, the absorption peaks at 602, 617 and 1383 cm−1 were attributed to PO43−, 1450 cm−1 to the stretching vibration of P–Ph, and 1434 cm−1 to the stretching vibration of Si–Ph. The formation of Si–O–P(
C and deformation vibration of C–H from the various substitution types of the benzene ring, which reflected the presence of polyaromatic structure in PPGS chars. Additionally, the absorption peaks at 602, 617 and 1383 cm−1 were attributed to PO43−, 1450 cm−1 to the stretching vibration of P–Ph, and 1434 cm−1 to the stretching vibration of Si–Ph. The formation of Si–O–P(![[double bond, length as m-dash]](https://www.rsc.org/images/entities/char_e001.gif) O)–O13 in PPGS chars probably resulted in these peaks of Si–O–Si shifted to higher wave numbers, corresponding to these peaks at 1056 and 448 cm−1 (in PGS chars) shifted to 1059 and 451 cm−1 (in PPGS chars).
O)–O13 in PPGS chars probably resulted in these peaks of Si–O–Si shifted to higher wave numbers, corresponding to these peaks at 1056 and 448 cm−1 (in PGS chars) shifted to 1059 and 451 cm−1 (in PPGS chars).
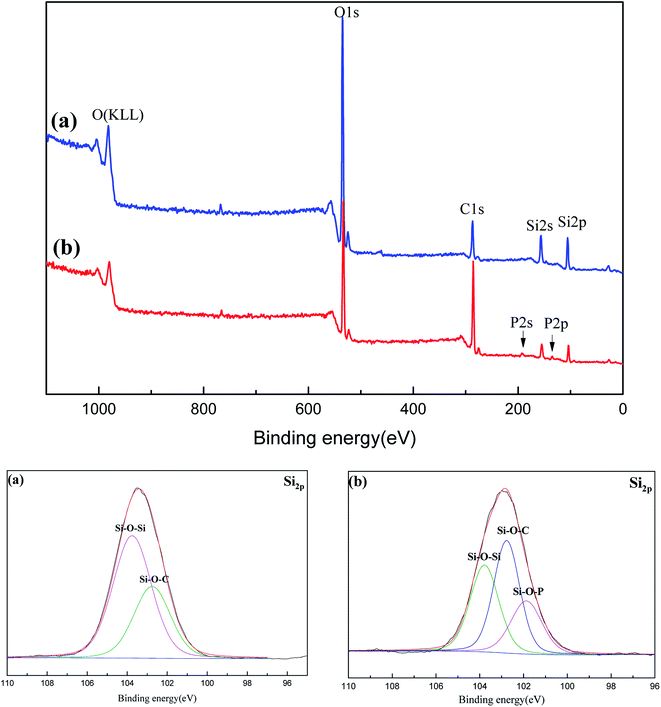
To further investigate the charring process, the surface elements of the carbonized sample were analyzed by XPS in Fig. 9 and Table 2. C element is the main fuel supporting the flame (its complete combustion products: CO and CO2), its real consuming amount reflects the flame degree of materials. As Si element is non-volatile during heated, the decrease degree of C content relative to Si can evaluate the combustion degree. Compared with C/Si ratio of PGS and PPGS before carbonization, the C/Si ratios of theirs carbonized samples were decreased by 70.5% and 40.3% respectively. It demonstrated that the latter remained more fuel element in the condensed phase to construct the chars rather than entrance into gaseous phase for flame. In Si 2p spectra of both the carbonized samples, the peak at 103.8 eV was attributed to Si–O–Si, and 102.8 eV to Si–O–C. However, a new peak at 101.9 eV ascribed to Si–O–P could be observed for PPGS chars, which means the chemical interaction between phosphaphenanthrene structure and polysiloxane. Furthermore, higher peak of Si–O–C for PPGS chars also implied that more –Si–O–C(![[double bond, length as m-dash]](https://www.rsc.org/images/entities/char_e001.gif) O)– linkages generated.
O)– linkages generated.
| Element/at% | C | Si | O | P | C/Si |
|---|---|---|---|---|---|
| PGS (calculation value) | 54.55 | 9.09 | 36.36 | — | 6.00 |
| PPGS (calculation value) | 64.86 | 5.41 | 27.03 | 2.70 | 12.00 |
| Carbonized PGS | 27.07 | 15.27 | 57.66 | — | 1.77 |
| Carbonized PPGS | 55.90 | 7.81 | 34.94 | 1.35 | 7.16 |
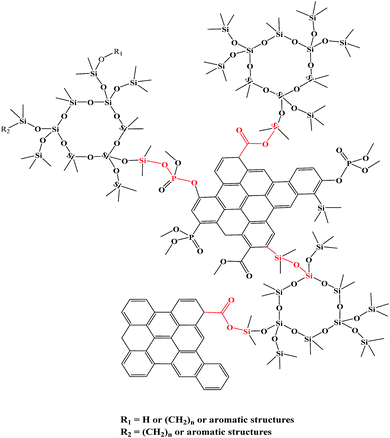
Summarizing the FT-IR and XPS analysis, the charring mechanism of PPGS could be described in terms of the formation of –P(![[double bond, length as m-dash]](https://www.rsc.org/images/entities/char_e001.gif) O)–O–Si– and more –Si–O–C(
O)–O–Si– and more –Si–O–C(![[double bond, length as m-dash]](https://www.rsc.org/images/entities/char_e001.gif) O)– linkages. These linkages connected the three dimensional net of Si(–O)4 and polyaromatic structure like bridges as shown in Scheme 2, thus effectively increasing both the amount and the thermal stability of the chars.
O)– linkages. These linkages connected the three dimensional net of Si(–O)4 and polyaromatic structure like bridges as shown in Scheme 2, thus effectively increasing both the amount and the thermal stability of the chars.
3.3. Physical properties
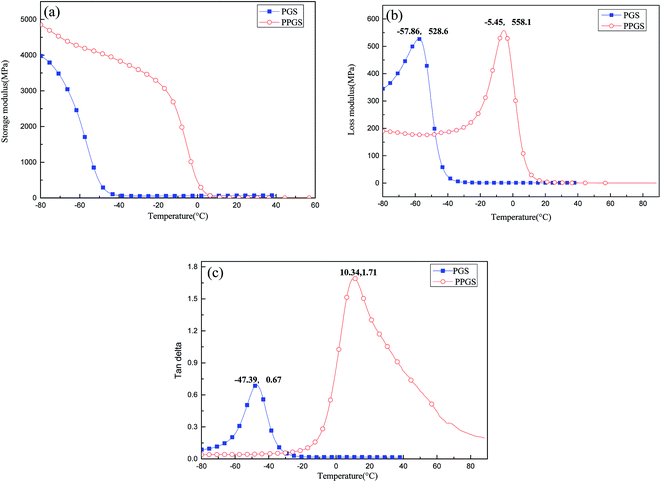
To further research the effect of the large and rigid side group on SR's mechanical properties, the dynamic mechanical behaviors of PGS and PPGS were measured. The curves of the storage modulus (E′), loss modulus (E′′), and tan![[thin space (1/6-em)]](https://www.rsc.org/images/entities/char_2009.gif) δ versus temperature were given respectively in Fig. 10. Compared with PGS, PPGS showed obvious improvement of E′ in the glassy region due to the segmental confinement caused by large rigid phosphaphenanthrene side groups. The crosslink density of the cured product could be estimated from the plateau of the storage modulus in the rubbery state. According to the theory of rubber elasticity, the cross-linking density can be calculated using the equation
δ versus temperature were given respectively in Fig. 10. Compared with PGS, PPGS showed obvious improvement of E′ in the glassy region due to the segmental confinement caused by large rigid phosphaphenanthrene side groups. The crosslink density of the cured product could be estimated from the plateau of the storage modulus in the rubbery state. According to the theory of rubber elasticity, the cross-linking density can be calculated using the equation  ,14 where E′ is the storage modulus at Tg + 30 °C, R is the gas constant, and T is the absolute temperature at Tg + 30 °C. The calculated cross-linking density of PGS was 8527 mol m−3, but PPGS was only 264 mol m−3. Obviously, the steric hindrance of phosphaphenanthrene structure could greatly reduce the cross-linking degree. Loss modulus represents the energy dissipation because of the internal friction from the relative motion of polymer chains. PGS possessed higher cross-linking density but softer side groups, so the lower loss modulus compared to PPGS (corresponding to better viscoelasticity) showed side group had greater influence on the loss modulus than crosslinking degree. The temperature corresponding to maximum tan delta is generally regarded as Tg of a polymer. Clearly, introducing the phosphaphenanthrene structure in the SR resulted in substantial increase of Tg.
Besides, the static mechanical properties of the above SR materials were also exhibited in Table 3. PPGS had higher tensile strength, elastic modulus, elongation at break than PGS. A possible reason is too high crosslinking degree of the latter increase the brittleness, but the steric hindrance of phosphaphenanthrene structure could avoid excessive crosslinking of SR, hence kept better toughness and strength.
| Samples | Tensile strength (MPa) | Elastic modulus (MPa) | Elongation at break (%) |
|---|---|---|---|
| PGS | 4.03 ± 0.88 | 20.66 ± 4.80 | 16.96 ± 0.96 |
| PPGS | 5.27 ± 0.27 | 27.02 ± 1.02 | 29.00 ± 1.50 |
Transparence is an important advantage for SR materials. However, adding flame retardants in SR matrix generally seriously deteriorate the transparence. By contrast, intrinsic flame retardant SR could well overcome the problem. Fig. 11 showed the light transmission ratio (LTR) of PGS, PPGS and DOPO/PGS mixture (physical addition). The flame retardant mixture system was completely opaque. Compared with PGS, PPGS displayed somewhat decrease in transmission ratio, but still maintained as high as 88.2% of LTR.
4. Conclusions
PPGS with intrinsic flame retardance was successfully synthesized and confirmed. Due to the introduction of phosphaphenanthrene structure, this SR could achieve UL94-V0 rating and as high as 42.3% of LOI, as well as greatly decreased HRR and THR, showing much better flame retardancy in comparison to PGS. The composition and bond forms revealed the interaction between phosphaphenanthrene structure and the silsesquioxanes in the condensed phase, which can be described in terms of the resulting –P(![[double bond, length as m-dash]](https://www.rsc.org/images/entities/char_e001.gif) O)–O–Si– and more –Si–O–C(
O)–O–Si– and more –Si–O–C(![[double bond, length as m-dash]](https://www.rsc.org/images/entities/char_e001.gif) O)– linkages connecting the three dimensional net of Si(–O)4 and polyaromatic carbon structures like bridges, thus further increasing both the amount and the thermal stability of the char yield. On the other hand, PPGS also displayed excellent comprehensive performance including high transparency with a light transmission ratio of 88.2%, as well as better mechanical properties due to appropriate cross-linking degree. Based on the excellent performance above, it is believable that such an intrinsic flame retardant SR shows a promise in future commercialization.
O)– linkages connecting the three dimensional net of Si(–O)4 and polyaromatic carbon structures like bridges, thus further increasing both the amount and the thermal stability of the char yield. On the other hand, PPGS also displayed excellent comprehensive performance including high transparency with a light transmission ratio of 88.2%, as well as better mechanical properties due to appropriate cross-linking degree. Based on the excellent performance above, it is believable that such an intrinsic flame retardant SR shows a promise in future commercialization.
Conflicts of interest
There are no conflicts of interest to declare.Acknowledgements
Wei Chen and Yuansen Liu contributed equally to this work. The authors acknowledge financial support from the National Natural Science Foundation of China (No. 51473095), the Program of Innovative Research Team for Young Scientists of Sichuan Province (2016TD0010), Xiamen Southern Oceanographic Center (14GQT61HJ31, 15GZP023NF01), Scientific and Technological Projects of Xiamen City (3502Z20172010) and Science and Technology Planning Project of Fujian Province, China (2015Y0034).References
- S. Gunasekaran, R. K. Natarajan, A. Kala and R. Jagannathan, Indian J. Pure Appl. Phys., 2008, 46, 733–737 CAS.
- J. Wen, Y. Li, Y. Zuo, G. Zhou, J. Li, L. Jiang and W. Xu, Mater. Lett., 2008, 62, 3307–3309 CrossRef CAS.
- S. Hamdani, C. Longuet, D. Perrin, J.-M. Lopez-cuesta and F. Ganachaud, Polym. Degrad. Stab., 2009, 94, 465–495 CrossRef CAS.
- J. L. Zhuo, J. Dong, C. M. Jiao and X. L. Chen, Plast., Rubber Compos., 2013, 42, 239–243 CrossRef CAS.
- A. Genovese and R. A. Shanks, Composites, Part A, 2008, 39, 398–405 CrossRef.
- M. M. Demir, Y. Z. Menceloglu and B. Erman, Polymer, 2005, 46, 4127–4134 CrossRef CAS.
- E.-S. Park, J. Appl. Polym. Sci., 2007, 105, 460–468 CrossRef CAS.
- L. Yang, Y. Hu, H. D. Lu and L. Song, J. Appl. Polym. Sci., 2006, 99, 3275–3280 CrossRef CAS.
- X. Chen, J. Zhuo, W. Song, C. Jiao, Y. Qian and S. Li, Polym. Adv. Technol., 2014, 25, 1530–1537 CrossRef CAS.
- L. Hong and X. Hu, J. Macromol. Sci., Part B: Phys., 2016, 55, 175–187 CrossRef CAS.
- G. Camino, S. M. Lomakin and M. Lazzari, Polymer, 2001, 42, 2395–2402 CrossRef CAS.
- S. Yang, J. Wang, S. Huo, M. Wang and L. Cheng, Ind. Eng. Chem. Res., 2015, 54, 7777–7786 CrossRef CAS.
- W. Zhang, X. Li, H. Fan and R. Yang, Polym. Degrad. Stab., 2012, 97, 2241–2248 CrossRef CAS.
- W. Liu, R. Zhou, H. L. S. Goh, S. Huang and X. Lu, ACS Appl. Mater. Interfaces, 2014, 6, 5810–5817 CAS.
| This journal is © The Royal Society of Chemistry 2017 |

