 Open Access Article
The ethanol mediated-CeO2-supported low loading ruthenium catalysts for the catalytic wet air oxidation of butyric acid†
Yanmin Wang ab,
Chaoying Yua,
Xu Menga,
Peiqing Zhao*a and
Lingjun Chou
 *a
*a
aState Key Laboratory for Oxo Synthesis and Selective Oxidation, Lanzhou Institute of Chemical Physics (LICP), Chinese Academy of Sciences, Lanzhou 730000, P. R. China. E-mail: zhaopq@licp.cas.cn; ljchou@licp.cas.cn; Fax: +86 931 8277008; Tel: +86 931 4968688
bUniversity of the Chinese Academy of Sciences, Beijing 100049, P. R. China
First published on 15th August 2017
Abstract
Two kinds of nano-CeO2-supported low loading Ru catalysts were prepared by ultrasonic-assisted incipient wetness impregnation method and their applications in catalytic wet air oxidation (CWAO) of butyric acid (BA) were investigated. Both of the catalysts were characterized by XRD, XPS, TEM, N2 adsorption–desorption, Raman and H2-TPR. According to the characterization results, compared to Ru/CeO2 catalyst, the active component was well dispersed on the support and the particle sizes were smaller for the Ru/CeO2-A catalyst which was added to some absolute ethanol in the process of preparation. Meanwhile, Ru/CeO2-A catalysts possessed a high active surface area and had a higher Ce3+ and oxygen vacancy content due to the strong interaction between Ru species and CeO2. Therefore, the Ru/CeO2-A catalyst presented higher catalytic activity and the chemical oxygen demand (COD) removal can increase up to 64.05% after 2 h. It had excellent stability and can be reused many times without obvious loss of activity.
1. Introduction
Organic pollutants can endanger human health and are difficult to degrade. In recent years, much attention has been given to the catalytic wet air oxidation (CWAO) of organic compounds. CWAO is an attractive and useful technique for treating moderately concentrated, toxic organic compounds including phenols,1–5 carboxylic acids,6–10 nitrogen-containing compounds,11–13 and real wastewater.14–16Butyric acid (BA) is one of the most important intermediate products of the thermal decomposition of several types industrial sewage14 and it has been found as a common intermediate formed in the oxidation of long chain carboxylic acids.17 It is hazardous to the environment and can pollute water. Recently, more and more researchers have dedicated their attention to the degradation of BA. Gomes's group10,18,19 described CWAO of BA on carbon supported platinum (Pt/C) and iridium catalysts (Ir/C) in 1 wt% and 5 wt% metal loading at 200 °C, a conversion of 59.4% and 52.9% were obtained after the reaction of 2 h, respectively. Dükkancı et al.20 applied noble metals (platinum, palladium and ruthenium) supported on TiO2 (1 wt%) as catalysts for CWAO of BA at 333 K and atmospheric pressure, the conversion of BA was only 2.3% on Pd/TiO2 catalyst after 2 h and the intermediates were formed. Up to now, the CWAO of BA on CeO2 supported lower loading of active metal and operated under lower temperature has not been investigated and the study of the reusability of the catalysts is less.
As a part of our continuing efforts on developing efficient heterogeneous catalytic systems and their applications in organic transformations.21–23 In this work, we use traditional and ethanol mediated low loading Ru/CeO2 (0.3 wt%) as catalysts for CWAO of BA for the first time. The Ru/CeO2 mediated by ethanol exhibited excellent catalytic performance. The effects of ethanol on its structure and surface property were investigated by XRD, XPS, N2 adsorption–desorption, TEM, Raman and H2-TPR analysis measurements. At the same time, the operating parameters of CWAO of BA and the stability of the catalyst were examined in detail.
2. Experimental
2.1 Preparation of catalysts
All catalysts were prepared by ultrasonic-assisted incipient wetness impregnation using analytical grade RuCl3·xH2O as metallic precursor. In a typical experiment, nano-CeO2 was controlled impregnated with appropriate amounts of RuCl3·xH2O precursor solution in an ultrasonic bath for 3 h and then standing impregnation for 21 h. The content of Ru in all catalysts was fixed at 0.3 wt% related to the weight of CeO2. The samples were dried for 1 h at 363 K in a rotary evaporator, and then dried at 383 K for 6 h. Finally, all samples were introduced in a tubular quartz reactor and reduced by heating up in a hydrogen flow (200 mL min−1) at a rate of 6.25 K min−1 up to 673 K, and maintaining this temperature for 4 h. After cooling down to room temperature under H2 atmosphere, Ru/CeO2 catalyst was obtained. The product prepared by absolute ethanol mediated was denoted as Ru/CeO2-A. The preparation procedure is the same as Ru/CeO2, the difference is a small amount of absolute ethanol was added during the impregnation process.2.2 Characterization of samples
The catalysts were characterized by various instrumental techniques. XPS data were gained with a Thermo Scientific ESCALAB 250Xi Analysis, employing Mg Kα radiation. All the binding energies were calibrated by using C 1s (284.8 eV) as a reference. The crystal phase and composition were determined by power X-ray diffraction using a X-Pert PRO X-ray diffractometer with Cu Kα radiation in the 2θ range of 10–90° with a step size of 0.02°. Nitrogen adsorption–desorption measurements were performed at 76 K using an ASAP 2020M analyzer utilizing the Brunauer–Emmett–Teller (BET) model for the calculation of specific surface areas. The morphologies of the samples were characterized by a TF20 transmission electron microscope (TEM). H2-TPR experiments were carried out on a temperature programmed ChemiSorb PCA-1200 instrument (Builder, China) equipped with a TCD detector. About 200 mg of catalyst was placed in a U-shaped quartz reactor and pretreated in flowing Ar at 300 °C for 30 min with a heating rate of 10 °C min−1. Then the sample cooled down to room temperature under Ar. After that, the sample was heated from room temperature to a given temperature at a rate of 10 °C min−1 under flowing 5% H2/Ar with the flow rate of 30 mL min−1. Metal dispersions of the catalysts were calculated by pulse chemisorption of hydrogen–oxygen titration. First, the O2 saturate adsorption was performed under pure O2 for 30 min after samples with the treatment of H2. Then H2 pulse titration was carried out by heating the samples at a rate of 10 °C min−1 from 35 °C to 100 °C, under a pure H2 flow of 30 mL min−1. The stoichiometry factor between chemisorbed hydrogen and surface Ru was 1![[thin space (1/6-em)]](https://www.rsc.org/images/entities/char_2009.gif) :
:![[thin space (1/6-em)]](https://www.rsc.org/images/entities/char_2009.gif) 1. Raman spectra were obtained using a LabRAM HR Evolution (λ = 532 nm).
1. Raman spectra were obtained using a LabRAM HR Evolution (λ = 532 nm).
2.3 Catalytic activity measurements
CWAO studies were carried out in a 100 mL stainless steel high pressure reactor with a magnetically driven stirrer and Teflon liner to prevent severe corrosion problems, heated by an electronically controlled heating mantle. In a typical experiment, 0.5 g catalyst and 20 mL BA with its initial chemical oxygen demand (COD) concentration of 6000 mg L−1 were used. Standard operating condition was set at 180 °C under continuous stirring. As soon as the set temperature was achieved, 0.8 MPa partial pressure of O2 was admitted into the reactor. This point was taken as ‘zero time’. After reaction for 2 h, the reactor was cooled down to room temperature immediately. Then the liquid sample was withdrawn from the reactor, followed by centrifuging to remove the catalyst for COD analysis. The COD in the sample was evaluated by a 5B-3B COD analyzer. Moreover, the samples were analysed with a gas chromatography (VARIAN CP-3800).2.4 Catalyst stability measurements
After each run of reaction, the Ru/CeO2-A catalyst was isolated by centrifugation and washed by distilled water. Then the catalyst dried at 110 °C for 12 h and was reused for the CWAO of fresh butyric acid under the same conditions.3. Results and discussion
3.1 Catalysts characterization
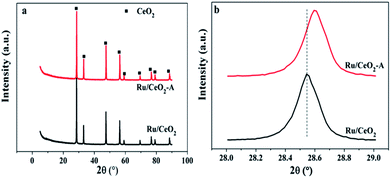
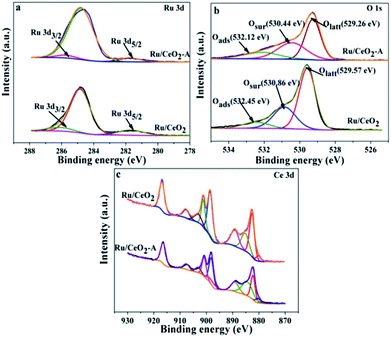
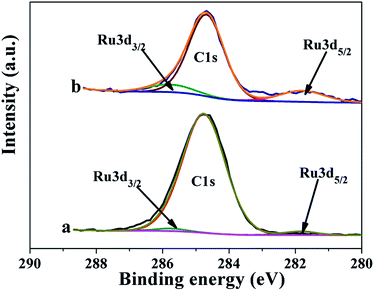
In order to explore the difference between Ru/CeO2 and Ru/CeO2-A, the two catalysts were characterized by XRD, XPS, TEM, N2 adsorption–desorption and H2-TPR. Fig. 1 shows the XRD patterns of the prepared Ru/CeO2 and Ru/CeO2-A catalysts. Only the diffraction peaks of (111), (200), (220), (331), (222), and (400) planes which indexed to the cubic fluorite-type CeO2 structure (JCPDS 34-0394) were observed for both the catalysts. No additional peaks of Ru were observed because the content of Ru was too small to be detected. Surprisingly, compared to Ru/CeO2 catalyst, the peaks were slightly shifted to higher values (Fig. 1b) over Ru/CeO2-A catalyst. The lattice parameters have been calculated according to the XRD data. It can be seen that the lattice parameter of the ethanol mediated Ru/CeO2 catalyst is 5.4038 nm and lower than that of Ru/CeO2 catalyst of 5.4094 nm, which indicated that absolute ethanol can affect the crystalline structure of support. According to the images of EDX (Fig. S1†) and the analysis of XPS spectra (Fig. 2a), the peaks of Ru were observed and it is proved that the active compound of Ru has loaded on the surface of CeO2 supports successfully.Fig. 2 displays a series of XPS spectra of Ru 3d, Ce 3d and O 1s region of the prepared Ru/CeO2 and Ru/CeO2-A catalysts. The relative percentages of Ce and O species are obtained from the area ratio of the peaks. The Ru 3d XPS spectra (Fig. 2) of the two catalysts show a doublet peaks at 281.5 eV and 285.8 eV attributed to RuIVO2.24 As seen in Fig. 2c, the XPS spectra of Ce 3d of both two catalysts are fitted into ten components. The coexistence of both Ce3+ and Ce4+ oxidation states can be clearly distinguished.25–27 The percentage of Ce3+ of Ru/CeO2-A is 31.33% and higher than Ru/CeO2 with the content of Ce3+ of 20.47%. This could be explained by the formation of oxygen vacancies.28 The O 1s XPS spectra of these two catalysts are shown in Fig. 2b, it is observed that three peaks referred to the lattice oxygen at 529.0–530.0 eV (denoted as Olatt), the surface oxygen species located at 530.0–531.8 eV assigned to defect oxides or the surface oxygen ions with low coordination situation and weakly bonded oxygen species (denoted as Osur)29,30 and adsorbed oxygen species at 531.9–532.9 eV from H2O or OH (denoted as Oads) are observed.31,32 The Osur have been reported to the most active oxygen species and play critical roles in oxidation reaction. As shown in Table 1, the Ru/CeO2-A has more oxygen vacancies than that of Ru/CeO2, which is in accordance with the results obtained from the Ce 3d spectra.
| Samples | Binding energy (eV) | Osur/OT (%) | Ce3+/CeT (%) | |||
|---|---|---|---|---|---|---|
| Olatt | Osur | Oads | ||||
| Ru/CeO2 | 529.57 | 530.86 | 532.45 | 29.30 | 20.47 | |
| Ru/CeO2-A | 529.26 | 530.44 | 532.12 | 35.51 | 31.33 | |
Raman spectroscopy was further employ to provide the structure information using 532 nm excitation laser lines. Fig. 3A presents the visible Raman spectra of CeO2, Ru/CeO2 and Ru/CeO2-A catalysts. For CeO2 support, the Raman peak at around 462.5 cm−1 is ascribed to the F2g vibration mode of the cubic CeO2 fluoride structure. And the other two peaks at 592.6 cm−1 and 1172.9 cm−1 are associated with the defect-induced (D) modes and second order longitudinal modes of the cubic CeO2 fluoride structure, respectively.33,34 The Raman spectra of Ru/CeO2 and Ru/CeO2-A are similar to that of CeO2. However, the F2g peaks shift to lower wavenumbers at around 459.4 cm−1 and 455.8 cm−1 for Ru/CeO2 and Ru/CeO2-A, respectively, which suggests that the deposited Ru lowers the symmetry of the Ce–O bond.35 The D bond was related to the presence of oxygen vacancies due to the presence of Ce3+ ion in the CeO2 lattice, and the relatively intensity ratio of ID/IF2g reflected the concentration of oxygen vacancies in CeO2.36 This ratio showed in Fig. 3B for Ru/CeO2-A is higher than that for Ru/CeO2 and CeO2, which suggests that Ru/CeO2-A has the most abundant oxygen vacancies. It is in accordance with the results of XPS.
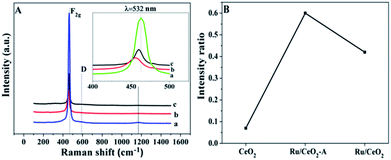 | ||
| Fig. 3 (A) Visible Raman spectra and (B) the corresponding ID/IF2g values of (a) CeO2, (b) Ru/CeO2, (c) Ru/CeO2-A samples. | ||
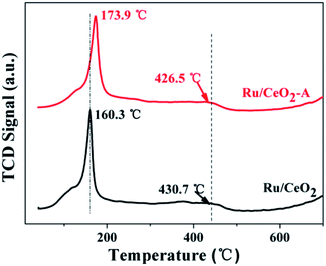
H2-TPR is conducted over these two catalysts to understand the reduction behaviors of Ru oxides and the results are shown in Fig. 4. Ru/CeO2 shows two regions of H2 consumption: the first region at about 160 °C can be attributed to the reduction of RuO2,37 another wide peak centered at 430.7 °C is assigned to the reduction of surface oxygen.38 However, for Ru/CeO2-A, the first reduction peak shifted to higher temperature at 173.9 °C is ascribed to the strong interaction of the oxidized ruthenium species and CeO2 supports and some electrons may be transferred from Ru to CeO2.39 Therefore, Ru/CeO2-A has higher content Ce3+ and it is in accordance with the XPS result.
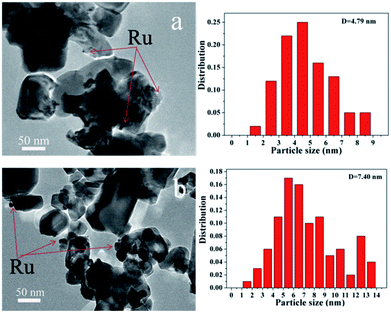
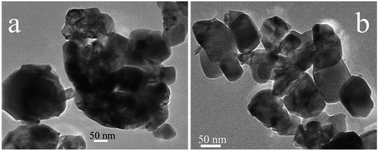
TEM images as presented in Fig. 5 were used to determine the dispersion of Ru and the average Ru particle sizes. For Ru/CeO2 catalyst, Ru was poorly dispersed and aggregated into large particles with an average particle size of 7.40 nm. However, Ru had a better dispersion over Ru/CeO2-A catalyst, with a relatively narrow size distribution and the average particle size of 4.79 nm. This indicated that the absolute ethanol affected the metal distribution over the supports and the final Ru dispersion.
Table 2 shows the BET surface area (SBET) of CeO2 processed under different conditions and the catalysts using CeO2 as supports and Ru as active ingredient. We can get the results that when metal Ru was loaded, the SBET of Ru/CeO2 decreased by 14.60%. However, the SBET of Ru/CeO2-A only decreased by 2% in the process using ethanol. It illustrates that absolute ethanol may play a role in preventing the decrease of SBET of the support when metal was loaded.
Interestingly, according to the results of hydrogen–oxygen titration, the active specific surface area of Ru/CeO2 and Ru/CeO2-A is 137.4 m2 g−1 and 339.2 m2 g−1, respectively. From the characterization results of two catalysts, Ru/CeO2-A catalyst mediated by absolute ethanol in the process of preparation shows the well dispersed active component on the support and the average particle size is small and only 4.79 nm. The decrease of the SBET of the support with loading metal is lower than that of Ru/CeO2 and only decreased by 2%. Moreover, the catalyst owns higher active special surface area and higher content of Ce3+ and oxygen vacancies due to the strong interaction of Ru and CeO2 supports.
3.2 Catalytic activity tests
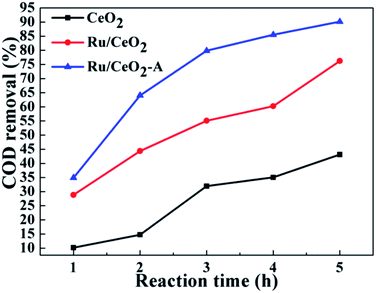
In order to prepare the highest catalytic activity Ru/CeO2 catalyst, first of all, we explored other mediated solvent effect on the catalytic activity of Ru/CeO2 for CWAO of BA. The same amount of acetone, ethyl acetate and tetrahydrofuran were used to substitute the absolute ethanol. The results are depicted in Fig. S2a.† It turned out that the acetone has little impact on the catalytic activity of Ru/CeO2. Interestingly, the COD removal was increased when the catalyst mediated by ethyl acetate or tetrahydrofuran or absolute ethanol. The catalyst mediated by absolute ethanol presented the most excellent catalytic activity, on which the COD removal reached 64.05%. Hence, the absolute ethanol was selected as the appropriate mediated solvent. Meanwhile, we studied the influence of the amount of absolute ethanol (Fig. S2b†). Ru/CeO2 mediated by absolute ethanol with the mass fraction of 0.25% has the highest catalytic activity.The prepared Ru/CeO2 and Ru/CeO2-A catalysts were tested in the CWAO of butyric acid (COD: 6000 mg L−1) at a temperature of 180 °C and an oxygen partial pressure of 0.8 MPa. Fig. 6 shows the COD removal is only about 43.13% in blank test over CeO2 supports after 5 h. Under the same conditions, when we used Ru/CeO2 catalyst, the COD removal reached to 76.24%. Delightedly, the COD removal was up to 90.13% on Ru/CeO2-A with higher content of oxygen vacancies and Ce3+. It is consistent with the characteristic results of XPS and Raman shown above. Moreover, for Ru/CeO2 catalyst, oxidation intermediates such as propionic acid and acetic acid were formed. However, the butyric acid had an excellent selectively and directly oxidized to CO2 and H2O for Ru/CeO2-A catalyst.
It should be noted that the catalyst will show the best catalytic activity under the suitable operating conditions such as temperature and the partial pressure of O2. Because proper temperature and gas pressure will produce appropriate oxygen solubility and can benefit for the CWAO of organic compounds. Therefore, a series of experiments were conducted to explore the correlations between the COD removal and the reaction conditions. Fig. 7a shows that the COD removal was very sensitive to the temperature over Ru/CeO2-A. The COD removal was only 13.58% at the beginning temperature at 150 °C (0.8 MPa partial pressure of O2, 2 h). When the temperature improved to 180 °C and 200 °C, the COD removal reached to 64.05% and 64.65% respectively. Fig. 7b shows the COD removal changing with the O2 partial pressure. A significant improvement in COD removal when the partial pressure of O2 changed from 0.6 MPa to 0.8 MPa, the COD removal increased from 38.7% to 64.05%. However, the COD removal only increased 0.16% when the partial pressure of O2 changed from 0.8 MPa to 1.0 MPa. Fig. 7c represents the variation of COD removal with the prolongation of reaction time. When the reaction time was 6 h, COD removal reached to 99%. But COD removal was only 79.1% after 8 h at 473 K and 0.69 MPa of oxygen partial pressure in the presence of the Pt/C (1 wt%) catalyst.19
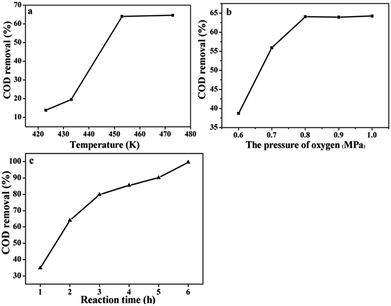 | ||
| Fig. 7 The COD removal of BA under the Ru/CeO2-A catalyst operated different reaction conditions. (a) Temperature, (b) O2 partial pressures, (c) times. | ||
Based on the above experimental results, we put forward a simple kinetic model to understand the reaction rate. The COD of butyric acid was acted as a single component and the overall reaction can be described as follows:
| Organic compounds (COD)0 + O2 + catalysts → products (COD) + H2O + CO2 | (1) |
It was assumed to be a pseudo-first-order reaction and the similar first-order reaction kinetics has been reported in previous studies.33,36 The dynamic equations could be described as:
 | (2) |
 | (3) |
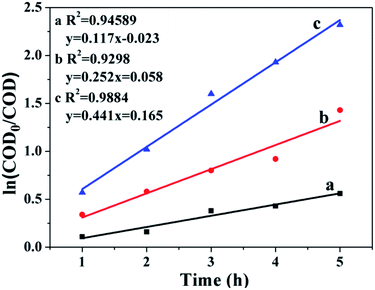
The result in Fig. 8 presents the changes in ln(COD0/COD) over the reaction time, with R2 values of 0.9884, 0.9298 and 0.9454 for CWAO of butyric acid over Ru/CeO2-A, Ru/CeO2 and CeO2, respectively. This indicates that CWAO of butyric acid followed the first-order reaction kinetic model. For CWAO of butyric acid, the k value was 0.441 h−1, 0.252 h−1 and 0.117 h−1 for Ru/CeO2-A, Ru/CeO2 and CeO2, respectively. The rate constant determines the reaction rate, the larger the rate constant, the faster the reaction.
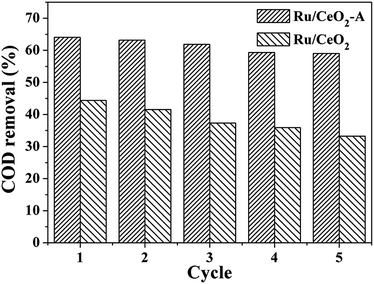
The stability is one of the important factors to determine the catalytic performance of a catalyst. The catalyst is more stable, the higher application capability it will has. Therefore, the recycled experiment was investigated using Ru/CeO2-A and Ru/CeO2 catalyst isolated by centrifugation, then washed by distilled water and finally dried at 110 °C for 12 h after each cycle of reaction. The COD removal after the fifth run was shown in Fig. 9. In the fifth cycle, for Ru/CeO2-A and Ru/CeO2 catalysts, the COD removal decreased to 59.03% and 33.23%, respectively, which implied that an extent inactivation had occurred with these catalysts and Ru/CeO2 catalyst is easier lose that inactivation than Ru/CeO2-A.
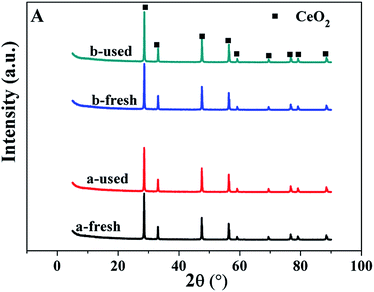
In order to learn more information about the possible reason of deactivation of the catalysts, the spent catalysts were characterized by XRD, TEM, AAS and XPS. According to the results of AAS, after one run, the content of Ru for Ru/CeO2 and Ru/CeO2-A catalysts is 0.28% and 0.29%, this indicated that the phenomenon of the loss of active component is not obviously. The XRD patterns of fresh and used catalysts shown in Fig. 10 indicated that there is no change in the diffraction peaks of CeO2 cubic fluorite structure for the used catalysts. Fig. 11 presents the TEM images of spent Ru/CeO2 and Ru/CeO2-A catalysts, it is observed that the structure of the spent Ru/CeO2-A catalyst exhibited no considerable change and the active metal was not significantly aggregated after reaction. Moreover, the size of the Ru particles after the tests did not change obviously. However, for Ru/CeO2 catalyst, the phenomenon of carbonaceous deposition was existed on the active sites. The Ru 3d XPS spectra of the two spent catalysts are shown in Fig. 12. It was demonstrated that the Ru 3d5/2 peak did not shift after the reaction, however, the intensity of Ru 3d5/2 peak decreased for Ru/CeO2 catalyst, which was due to the carbonaceous deposition on the surface of Ru40 and in accordance with the result of TEM images. Carbon deposits on the active sites hindered the formation of free radicals which was reason for the deactivation of Ru/CeO2-A. Moreover, Ru/CeO2-A mediated by absolute ethanol has an excellent stability.
4. Conclusions
Ru/CeO2-A mediated by absolute ethanol was prepared via impregnation method and employed in degradation of butyric acid by CWAO method. Compared with Ru/CeO2 with a COD removal of butyric acid of 44.37%, Ru/CeO2-A catalysts show higher catalytic activity and the COD removal of butyric acid increased up to 64.05% under 180 °C and 0.8 MPa partial pressure of O2 after 2 h. The catalysts were characterized by XRD, XPS, TEM, BET, Raman and H2-TPR. According to the characterization results, we concluded that Ru/CeO2-A catalysts mediated by absolute ethanol made the active component dispersion on the support uniform and the average particle size of Ru is smaller. Moreover, the catalyst owns high special active surface area and has higher content of oxygen vacancies and Ce3+. More importantly, Ru/CeO2-A has excellent stability. After the fifth cycle, the COD removal still kept 59.03%.Conflicts of interest
There are no conflicts to declare.Acknowledgements
We gratefully acknowledge the National Natural Science Foundation of China (No. 21403256, 21573261) and the Suzhou industrial Technology and Innovation Project (SYG201531).Notes and references
- J. Wang, W. Zhu, S. Yang, W. Wang and Y. Zhou, Appl. Catal., B, 2008, 78, 30–37 CrossRef CAS.
- N. Li, C. Descorme and M. Besson, Catal. Commun., 2007, 8, 1815–1819 CrossRef CAS.
- S. Muhammad, P. Shukla, M. Tadéa and S. Wang, J. Hazard. Mater., 2012, 215–216, 183–190 CrossRef CAS PubMed.
- M. Hernández, J. Carrera, M. Ojeda, M. Besson and C. Descorme, Appl. Catal., B, 2012, 123–124, 141–150 CrossRef.
- J. Liu, C. Yu, P. Zhao and G. Chen, Appl. Surf. Sci., 2012, 258, 9096–9102 CrossRef CAS.
- M. Triki, D. Minh, Z. Ksibi, A. Ghorbel and M. Besson, J. Sol-Gel Sci. Technol., 2008, 48, 344–349 CrossRef CAS.
- B. Renard, J. Barbier Jr, D. Duprez and S. Durécu, Appl. Catal., B, 2005, 55, 1–10 CrossRef CAS.
- N. Perkas, D. Minh, P. Gallezot, A. Gedanken and M. Besson, Appl. Catal., B, 2005, 59, 121–130 CrossRef CAS.
- L. Oliviero, J. Barbier Jr, D. Duprez, H. Wahyu, J. Ponton, I. Metcalfe and D. Mantzavinos, Appl. Catal., B, 2001, 35, 1–12 CrossRef CAS.
- H. Gomes, J. Figueiredo and J. Faria, Catal. Today, 2002, 2693, 1–4 Search PubMed.
- G. Sun, A. Xu, Y. He, M. Yang, H. Du and C. Sun, J. Hazard. Mater., 2008, 156, 335–341 CrossRef CAS PubMed.
- G. Ersöz and S. Atalay, J. Environ. Manage., 2012, 113, 244–250 CrossRef PubMed.
- J. Barbier Jr, L. Oliviero, B. Renard and D. Duprez, Catal. Today, 2002, 75, 29–34 CrossRef.
- H. Gomes, J. Figueiredo and J. Faria, Catal. Today, 2007, 124, 254–259 CrossRef CAS.
- M. Yang, Y. Sun, A. Xu, X. Lu, H. Du, C. Sun and C. Li, Bull. Environ. Contam. Toxicol., 2007, 79, 66–70 CrossRef CAS PubMed.
- G. W. Wang, D. Wang, X. Xu, L. Liu and F. Yang, J. Hazard. Mater., 2012, 217–218, 366–373 CrossRef CAS PubMed.
- J. Sanchez-Oneto, J. Portela, E. Nebot and E. Martínez-de-la-Ossa, Chem. Eng. J., 2004, 100, 43–50 CrossRef CAS.
- H. Gomes, J. Figueiredo, J. Faria, P. Serp and P. Kalck, J. Mol. Catal. A: Chem., 2002, 182–183, 47–60 CrossRef CAS.
- H. Gomes, J. Figueiredo and J. Faria, Appl. Catal., B, 2000, 27, L217–L233 CrossRef CAS.
- M. Dükkancı and G. Gündüz, Catal. Commun., 2009, 10, 913–919 CrossRef.
- X. Meng, J. Zhang, B. Chen, Z. Jing and P. Zhao, Catal. Sci. Technol., 2016, 6, 890–896 CAS.
- X. Meng, Y. Wang, C. Yu and P. Zhao, RSC Adv., 2014, 4, 27301–27307 RSC.
- C. Yu, P. Zhao, G. Chen and B. Hu, Appl. Surf. Sci., 2011, 257, 7727–7731 CrossRef CAS.
- C. Elmasides, D. Kondarides, W. Grünert and X. Verykios, J. Phys. Chem. B, 1999, 103, 5227–5239 CrossRef CAS.
- Y. Chen, H. Zheng, Z. Guo, C. Zhou, C. Wang, A. Borgna and Y. Yang, J. Catal., 2011, 283, 34–44 CrossRef CAS.
- G. Chen, F. Rosei and D. Ma, Adv. Funct. Mater., 2012, 22, 3914–3920 CrossRef CAS.
- S. Deng, H. Liu, W. Zhou, J. Huang and G. Yu, J. Hazard. Mater., 2011, 186, 1360–1366 CrossRef CAS PubMed.
- Z. Ma, X. Xiong, L. Song, B. Hu and W. Zhang, RSC Adv., 2016, 6, 51106–51110 RSC.
- J. Wang, W. Zhu, X. He and S. Yang, Catal. Commun., 2008, 9, 2163–2167 CrossRef CAS.
- X. Xiang, H. Zhao, J. Yang, J. Zhao, L. Yan, H. Song and L. Chou, Appl. Catal., A, 2016, 520, 140–150 CrossRef CAS.
- D. Yu, Y. Liu and Z. Wu, Catal. Commun., 2010, 11, 788–791 CrossRef CAS.
- Y. Liao, M. Fu, L. Chen, J. Wu, B. Huang and D. Ye, Catal. Today, 2013, 216, 220–228 CrossRef CAS.
- P. Sudarsanam, B. Mallesham, D. Durgasri and B. Reddy, RSC Adv., 2014, 4, 11322–11330 RSC.
- F. Wang, C. Li, X. Zhang, M. Wei, D. Evans and X. Duan, J. Catal., 2015, 329, 177–186 CrossRef CAS.
- Z. Ma, S. Zhao, X. Pei, X. Xiong and B. Hu, Catal. Sci. Technol., 2017, 7, 191–199 CAS.
- N. Wang, W. Qian, W. Chu and F. Wei, Catal. Sci. Technol., 2016, 6, 3594–3605 CAS.
- F. Lu, C. Yu, X. Meng, J. Zhang, G. Chen and P. Zhao, RSC Adv., 2016, 6, 73810–73816 RSC.
- C. Y. Yu, X. Meng, G. X. Chen and P. Q. Zhao, RSC Adv., 2016, 6, 22633–22638 RSC.
- H. Wei, Y. Wang, Y. Yu, B. Gu, Y. Zhao, X. Yang and C. Sun, Catal. Sci. Technol., 2015, 5, 1693–1703 CAS.
- Y. Qin, S. Xun, L. Zhan, Q. Lu, M. He, W. Jiang, H. Li, M. Zhang, W. Zhu and H. Li, New J. Chem., 2017, 41, 569–578 RSC.
Footnote |
| † Electronic supplementary information (ESI) available. See DOI: 10.1039/c7ra06028a |
| This journal is © The Royal Society of Chemistry 2017 |

