 Open Access Article
Chitosan promotes ROS-mediated apoptosis and S phase cell cycle arrest in triple-negative breast cancer cells: evidence for intercalative interaction with genomic DNA
Fahimeh Salehi a,
Hossein Behboudi
 a,
Gholamreza Kavoosib and
Sussan K. Ardestani*a
aInstitute of Biochemistry and Biophysics, Department of Biochemistry, University of Tehran, Tehran, Iran. E-mail: ardestany@ut.ac.ir
bInstitute of Biotechnology, Shiraz University, Shiraz, Iran
First published on 5th September 2017
Abstract
Chitosan (CS) is a semi-synthetic bio-based polysaccharide with promising biological and antitumor properties. However, its possible underlying anticancer mechanisms and molecular interactions have remained largely unknown. Herein, we have shown that CS exerts an inhibitory effect on the proliferation of MDA-MB-231, MCF-7 and T47D breast cancer cells in a dose and time-dependent manner while being non-toxic to fibroblast L929 normal cells. Exposure of MDA-MB-231 cells to CS led to depolarization of the mitochondrial membrane, increase in ROS, DNA oxidation, and S phase cell cycle arrest. Furthermore, EB/AO staining, Annexin–PI staining, TUNEL assay, and altered expression of caspase 3 in MDA-MB-231 cells all indicated that cancer cells progressively became apoptotic upon CS exposure. S phase arrest in MDA-MB-231 cells suggests possible CS–DNA interaction. UV-visible spectroscopy confirmed CS interaction with DNA, and competitive displacement fluorescence assay revealed a binding constant of 7.6 × 10⁵ M−1 for CS. In addition, its binding modes with DNA were established by CD analysis. These results clearly indicate that along with being a safe biopolymer to normal cells, CS can be considered as an effectual anticancer agent.
Introduction
Recent advancements in breast cancer treatment using chemotherapy, radiotherapy, and surgery have extended the life expectancy of patients considerably.1–3 However, serious side effects, low specificity and drug resistance of anticancer drugs have inspired scientists to search for more effective and harmless medication.4The tightly regulated apoptosis extrinsic pathway that is triggered via death receptors present on the surface of the cell, and the mitochondrial-dependent intrinsic pathway are the key factors in maintaining cellular homeostasis.5 Under normal circumstances, Reactive Oxygen Species (ROS) and the cellular antioxidant system exist in balance. Disturbing this balance and collective generation of ROS causes oxidative stress. Findings show that ROS not only functions as a regulator of subcellular events but also is able to induce cell death through the apoptotic pathway. High concentration of ROS causes damage to DNA, proteins and lipids, which can lead to cell death. Furthermore, increasing pieces of evidence suggest that oxidative stress induces mitochondrial dysfunction.6
Drugs with the ability of inhibiting DNA synthesis are among the best choices to treat fast proliferating cancer cells.7 DNA–small molecules interaction leads to significant modification in DNA structure and may result in hindered or suppressed function of nucleic acids in physiological processes.8–10 Therefore, studying the interaction of potential anticancer agents with DNA and understanding their modes of action may help significantly to design new drugs for clinical use.11,12 DNA–drug interactions occur via whether covalent or noncovalent (electrostatic interactions, grooves binding, intercalation) binding and small differences in molecular structure may greatly affect the binding modes and as a result the stability of DNA–molecule complexes.13 Negatively charged DNA phosphate backbone interacts with the positively charged ends of small molecules via electrostatic binding, whereas major and minor groove binding involve hydrogen bonding or van der Waals interaction with nucleic acid bases. On the other hand, intercalation occurs when small molecules intercalate within the nucleic acid base pairs.12,14 Berenil, bleomycin and distamycin A (groove binding agents), tamoxifen, doxorubicin, daunomycin, quinolones, and quinoxalines (DNA intercalative agents)12 are some of the successful therapeutic DNA-interacting agents.
Natural products have played a pivotal rule in guiding researchers to develop efficient anticancer agents.15 Many polysaccharides extracted from natural sources have been found to possess a variety of biological activities and can be classified into two groups based on their sources,16 natural and semi-synthetic polysaccharides, which are produced by chemical or enzymatic modifications of the parent macromolecules. Numerous studies have reported that natural polysaccharides can inhibit tumor cells proliferation either by directly inducing apoptosis or by triggering immunopotentiation activity in combination with chemotherapy.17 Chitosan (CS), a semi-synthetically bio-based polymer, a deacetylation derivative of chitin (a polysaccharide presents in the exoskeleton of crustaceans, fungi, and insects) under alkaline condition, is a linear copolymer comprised of randomly distributed β-(1→4)-linked 2-amino-2-deoxy-D-glucopyranose and 2-amino-2-deoxy-D-glucopyranose units.18–20 Due to favorable properties such as biocompatibility, biodegradability in presence of chitinase, chitosanase, lysozyme, and nontoxicity, this cationic polysaccharide has been widely studied and developed for a variety of biomedical and pharmaceutical applications, including fungistatic and antibacterial, antitumor, anti-inflammatory, antioxidant, immunoadjevant, wound healing, tissue engineering, and gene delivery.21–26
This study has focused on determining the in vitro cytotoxicity of CS in MDA-MB-231, T47D and MCF-7 breast cancer cell lines and its underlying mechanism of action. Furthermore, the in vitro binding characteristics of CS–DNA were explored by using various spectroscopic techniques.
Experimental
Materials and cells
CS (Sigma 448869, low molecular weight 50–190 kDa, 85% deacetylate), MTT (3-(4,5-dimethyl-2-thiazolyl)-2,5-diphenyl-tetrazolium bromide), ethidium bromide (EB), acridine orange (AO), Phosphate Buffer Saline (PBS), dimethyl sulfoxide (DMSO), RNAase A, propidium iodide (PI), agarose, DCFH, and rhodamine 123 were supplied by Sigma-Aldrich chemical Co. (St. Louis Mo, USA). MDA-MB-231, MCF-7, T47D and L929 cell lines were purchased from National Cell Bank of Iran (Pasteur Institute, Iran). RPMI-1640, fetal bovine serum (FBS), trypsin–EDTA, penicillin, and streptomycin were purchased from Gibco. The Annexin V-FITC apoptosis detection kit was supplied from BioVision, in situ cell death detection kit, fluorescein was obtained from Roche and Caspase-3 colorimetric assay kit was purchased from BIOMOL International, USA.Preparation of chitosan and DNA solutions
High molecular weight DNA was extracted from rat hepatocyte using standard procedure27 (all experiments were performed in compliance with the guidelines of Tehran University of medical sciences National Ethics Committee in Biomedical Research) and 1 mg ml−1 DNA stock solutions were prepared in phosphate buffer (0.1 M, pH = 7.4). Extracted DNA quality control was performed by running samples on 0.8% agarose gel to confirm high molecular weight and samples with 260/280 absorbance ratios ≥1.8 were accepted as pure DNA. Chitosan stock solution (1 mg ml−1) was prepared as described previously.28 Briefly, 0.4 g of CS was dissolved in 40 ml 1% (w/w) acetic acid solution. The solution was sonicated using a 30 °C ultrasonic bath (Bandlin, Germany) at 140 W for 5 min and stirred overnight at room temperature, until complete dissolution. Aliquots were stored at 4 °C until later use. Prior to experiment, CS stock solutions were filtered, and pH was adjusted to 7.4 with 0.1 N NaOH. All DNA binding experiments were performed in phosphate buffer (0.1 M, pH = 7.4).Cell lines and culture
MDA.MB.231 (claudin low), MCF-7 (luminal A), T47D (luminal A) breast cancer cell lines29 and normal fibroblast cell line (L929) were maintained in RPMI-1640 medium supplemented with 10% FBS and antibiotics (100 U ml−1 penicillin and 100 μg ml−1 streptomycin) at 37 °C under humidified air containing 5% CO2 and were passaged using trypsin/EDTA (Gibco) and phosphate buffered saline (PBS) solution.Cytotoxicity assay by MTT in MDA-MB-231, T47D, MCF-7 and L929 cells
The in vitro cytotoxicity of CS was determined in MDA-MB-231, MCF-7, T47D, and L929 cell lines using MTT colorimetric cell viability assay. All the cells were seeded in a 96-well plate at a density of 1.4 × 10⁴ cells per well and incubated in 5% CO2 at 37 °C for 24 h. Subsequently, cells were treated for another 24, 48 and 72 hours with various concentrations of CS (0–500 μg ml−1). Control groups were treated with RPMI culture medium without CS. Cells morphological changes were observed after 24 h and imaged by phase-contrast microscope. After treatment, in order to measure the effects of different concentrations of CS on cells proliferation, the medium was removed and 200 μl per well of MTT solution (0.5 mg ml−1 in PBS) was added and incubated at 37 °C for an additional 4 h. The supernatant was discarded and 100 μl per well DMSO was added to dissolve the MTT-formazan crystals produced by the viable cells. Viability was determined by measuring absorbance at 492 nm using an ELISA reader (Model wave xs2, BioTek, USA). All experiments were done in triplicate and the concentration of CS required for 50% inhibition of viability (IC50) was calculated by using logarithm-transformed linear regression method. In brief, cell proliferation inhibition was calculated as follow: % cell proliferation inhibition = (492 nm mean absorption in control wells − 492 nm mean absorption of treated wells)/492 nm mean absorption of control wells × 100. The results were then plotted against logarithmic scale CS concentrations in Excel.MDA-MB-231, T47D and MCF-7 cells AO/EB fluorescent staining
In order to evaluate apoptosis qualitatively, double staining method was employed. MDA-MB-231, T47D, and MCF-7 were seeded in 6 well plates and treated with the IC50 concentration of CS for 24 h. After treatment cells were washed with PBS and a solution containing EB/AO was added, the stained cells were immediately visualized and imaged under a fluorescence microscope (Axioskop 2 plus, Zeiss, Germany). The distinction between viable, apoptotic, and necrotic cells is based on the differences between dye permeability into intact cell membrane. Green cells represent viable cells with typically structured chromatin and stain only by AO, orange and green cells with condensed chromatin are late and early apoptotic cells and stained with both AO and EB, finally necrotic cells are orange and stained with EB.10 Ten photos were taken of randomly selected areas of the stained slides to ensure the obtained data were representative.Flow cytometric analysis of apoptosis
CS induced apoptosis was verified by flow cytometry (Partec PAS, Germany) using a commercially available Annexin V-FITC/PI apoptosis detection kit (BioVision). 2.1 × 10⁶ MDA-MB-231 cells (3.5 × 10⁵ cells per well) were seeded into 6-well plates and treated with the CS IC50 for 4 h, afterward, cells were harvested and washed with PBS. Cell pellets were labeled with PI, and FITC conjugated Annexin V according to the protocol described by the kit manufacturer. Stained cells were analyzed by flow cytometry.TUNEL assay for measurement of in situ DNA fragmentation
TUNEL (terminal deoxyribonucleotidyl transferase-mediated dUTP nick-end labeling) assay was used for detection of DNA fragmentation, a key event in apoptosis, using in situ cell death detection kit, fluorescein (Roche) according to the manufacturer's instruction. Cells were cultured and treated with CS IC50 concentration for 4 h, then were fixed in 4% paraformaldehyde and permeabilized with 1% Triton X-100 and 0.1% sodium citrate. Cells were suspended in PBS and mean cell fluorescence of 10![[thin space (1/6-em)]](https://www.rsc.org/images/entities/char_2009.gif) 000 cells and percentage of TUNEL-positive cells was analyzed using flow cytometer.
000 cells and percentage of TUNEL-positive cells was analyzed using flow cytometer.
Assessment of changes in mitochondrial transmembrane potential
Measurement of mitochondrial membrane potential changes (ΔΨm) was performed with rhodamine 123 fluorescent dye. At first, MDA-MB-231 (3.5 × 10⁵ cells per well) cells were cultured in six-well plates and treated with 70 and 145 μg ml−1 chitosan for 12 h. Subsequently, cells were trypsinized, centrifuged, washed with PBS and incubated with rhodamine 123 staining solution (400 μl 50 μM in PBS) at 37 °C for 30 min. Finally, after three washes with PBS, samples were ready for analysis. Percentage of depolarized cells was determined by FACS Analyzer with excitation/emission at 488/525–530 nm in the FL1 and FL2 channels respectively.Quantitation of intracellular ROS formation by DCFH-DA labeling
Intracellular ROS generation was measured by staining cells with fluorescent probe 2,7-dichlorofluorescein diacetate (DCFH-DA). This probe enters cells by simple diffusion and is hydrolyzed into nonfluorescent dichlorofluorescein (DCFH) by means of intracellular esterases. Subsequently, dichlorofluorescein (DCFH) is oxidized to highly fluorescent dichlorofluorescein (DCF) by ROS. Thus, the fluorescence intensity is proportional to the amount of peroxides produced by the cells. In brief, MDA-MB-231 cells (1 × 10⁵ cells per well) were treated with 70, 145 and 290 μg ml−1 CS for 12 h. Afterward, cells were harvested, washed twice, resuspended in PBS, and incubated with DCFH-DA at a final concentration of 20 μM for 30 min at 37 °C in the dark. The DCF fluorescence intensity was measured by a flow cytometer at an excitation wavelength of 485–495 nm and fluorescence emission was measured in channel FL-1 at 525–530 nm. The results were expressed as percentage of the mean fluorescence intensity of FL-1 of the control group.DNA oxidation analysis
Genomic DNA of MDA-MB-231 cells treated for 2 h with 145 and 290 μg ml−1 CS and untreated controls were extracted according to standard phenol/chloroform extraction procedure.27 8-Oxo detection Elisa kit (Cayman chemical 589320) was used to measure the concentration of the major product of DNA oxidation (8-oxo-2′-deoxyguanosine) in each sample according to manufacturer's protocol. In brief 5 μg gDNA was subjected to the Elisa kit in duplicates after digestion with nuclease P1 (sigma N8630) and treatment with alkaline phosphatase (NEB M0290S) in a total volume of 50 μl. The amounts of 8-oxo were then reported in pg ml−1.Caspase-3 activity assay
Caspase-3 activity was measured using colorimetric assay kit (BIOMOL International, USA), according to the manufacturer's instruction. Briefly, MDA-MB-231 cells (1 × 10⁶) were treated with 70, 145 and 290 μg ml−1 of CS for 4 h and then each sample was harvested and washed with PBS. The cells were incubated with lysis buffer on ice, and the protein concentration of each sample was determined using the Bradford method. Equivalent amounts of proteins for each sample were incubated with the appropriate caspase-3 substrate and after 4 h; the absorbance at 405 nm was measured using a microplate reader.Cell cycle analysis
Cell cycle distribution was examined by measuring the DNA content of nuclei labeled with propidium iodide (PI). 3.5 × 10⁵ MDA-MB-231 cells were treated with 145 and 290 μg ml−1 of CS for 24 h. After treatment, cells were harvested by centrifugation, washed with 1 ml cold PBS, centrifuged, and fixed in 70% cold ethanol at 4 °C for 24 h. Subsequently, cells were washed twice and treated with RNase A (20 μg ml−1) and PI (20 μg ml−1) for 30 min at 37 °C in the dark. At the end, cell cycle distribution analysis was performed using flow cytometry and the percentages of cells at G1, S and G2/M phases were calculated by FlowJo software (Version 7.6.1).UV-visible spectroscopy
UV absorbance measurements were recorded on Carry spectrophotometer (100 Bio-models, Australia) using quartz cuvettes. Absorption experiments were done by titrating varying concentrations of CS (9–150 μg ml−1) against a constant concentration of DNA (50 μg ml−1). The UV spectra of CS solution, DNA solution, and CS–DNA complex were recorded in the 190–400 nm range. The spectra of each sample were recorded in 30 min at 298 K. Blank used for each CS–DNA sample, contained the same amount of CS without any DNA.Fluorescence studies
Fluorescence experiments were carried out on a Carry eclipse spectrofluorometer (Australia) using 1 cm quartz cells. In competitive displacement assay with EB, a solution containing EB (2.6 μM) and DNA (50 μg ml−1) was titrated with increasing concentrations of CS. EB–DNA complex was excited at 500 nm and emission spectra were recorded from 530–700 nm, with the widths of both the excitation and the emission slits set at 10 nm.Circular dichroism (CD) studies
CD spectra of pure DNA (100 μg ml−1), CS (75 μg ml−1) and CS–DNA were recorded using Aviv circular dichroism 215 spectrophotometer (USA) at 298 K. The CD spectra were recorded at wavelengths between 200–320 nm. Background spectrum of phosphate buffer solution was subtracted from the spectra of DNA, CS, and CS–DNA complex. Then, the spectra of CS–DNA samples were subtracted from the spectra of CS in the same condition.Statistical analysis
Experimental data processing was carried out using Microsoft Excel 2013 software, and results were presented as the mean ± standard deviation of three or more independent experiments. The significant differences between means were determined by t-test when statistical significance was P value ≤0.05.Results and discussion
Growth inhibitory effect of CS on MCF-7, T47D and MDA-MB-231 breast cancer cells
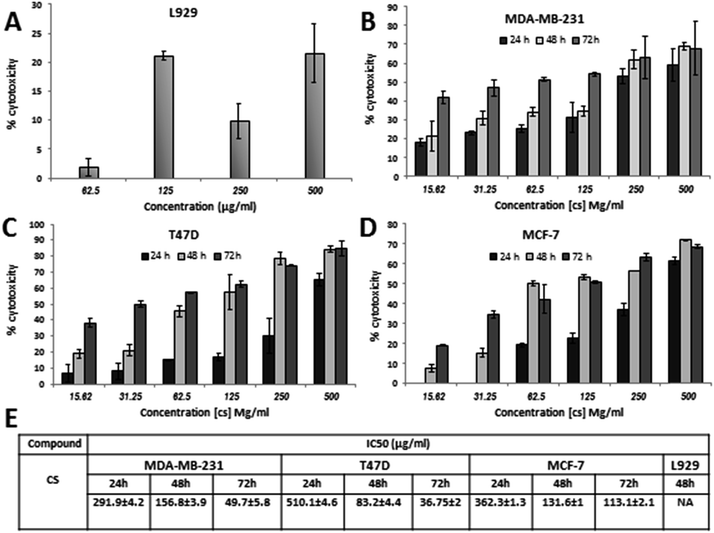
To investigate the inhibitory effect of CS, three human breast cancer cell lines (MDA-MB-231, T47D, MCF-7) and normal fibroblast L929 cells were treated with 15.62–500 μg ml−1 CS for 24, 48 and 72 hours. Initial microscopic examination of the cells after 24 h demonstrated vivid morphological alterations in cancer cells such as cell rounding, detachment, and cytoplasmic vacuolation indicating CS cytotoxicity (Fig. 1). The physical and biologic properties of chitosan are dependent on its molecular weight (MW) and degree of deacetylation (DD). In previous studies, the cytotoxicity of chitosan as a soluble molecule has been reported as a function of MW, DD, and concentration.30 In this study, growth inhibition was measured by MTT assay and IC50s was calculated. As it is shown in (Fig. 2), exposure of three breast cancer cell lines to low Mw CS with 85% DD clearly decreased cellular viability in a dose and time-dependent manner while inducing a much less toxic effect on normal L929 cells, indicating a favorable selectivity towards cancer cells. Among the breast cancer cell lines tested, MDA-MB-231 is a highly invasive, basal-like phenotype31 and often considered as an apoptosis-resistant cell line.32 Therefore, to investigate the mechanism by which CS decreases cell viability in breast cancer cells, we focused on MDA-MB-231 cells.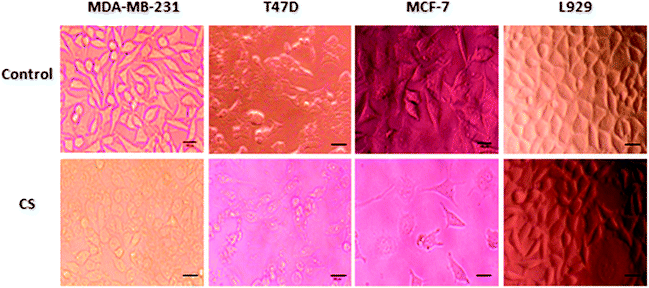 | ||
| Fig. 1 Morphological changes in breast cancer cells, and L929 normal cells treated for 24 h with IC50 and 500 μg ml−1 of CS respectively, (scale bars represent 50 μm). | ||
CS induces apoptosis in MDA-MB-231 cells
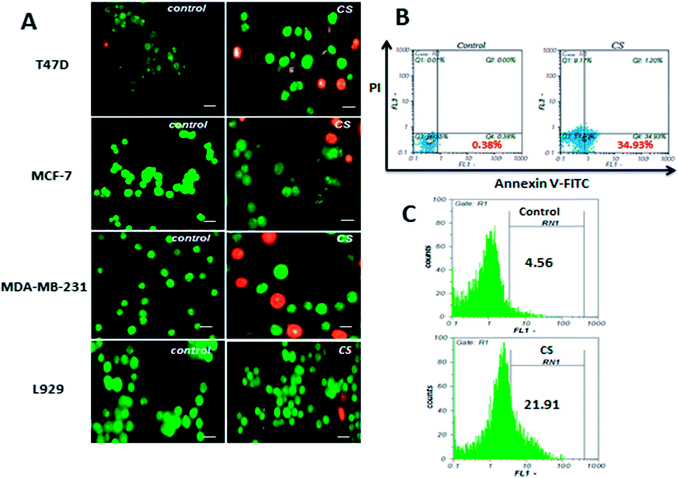
In order to verify apoptosis as the underlying mechanism of CS growth inhibitory effect, AO/EB staining, Annexin V-FITC/PI staining, and TUNEL assay were performed. In AO/EB staining of MDA-MB-231, T47D and MCF-7 cells as shown in Fig. 3A, cell nuclei and cell membrane integrity of control samples did not change significantly, while treated samples showed different extents of chromatin condensation, nuclear fragmentation, and destruction of cell membrane integrity. To further confirm apoptosis, MDA-MB-231 cells were treated with IC50 concentration (290 μg ml−1) of CS for 4 h and apoptosis induction was evaluated by Annexin V-FITC/PI double staining. Annexin V-FITC is capable of binding tightly to phosphatidylserines externalized to outer plasma membrane during early stages of apoptosis, and simultaneously, propidium iodide is included to differentiate between apoptotic and necrotic cells. This approach allows a further distinction of early apoptotic (Annexin V+/PI−) and late apoptotic/necrotic (Annexin V+/PI+) cells. The results (Fig. 3B) indicated that CS markedly induces apoptosis, and the population of early apoptotic cells was 34%, higher than the untreated samples. DNA fragmentation is a major hallmark of apoptosis which reflects the endonuclease activity and can be evaluated quantitatively by TUNEL assay. As shown in Fig. 3C, DNA fragmentation in MDA-MB-231 cells treated with IC50 concentration of CS for 4 h, quantified by flow cytometry and compared to untreated control cells 21.9% apoptosis was observed.CS induces apoptosis via ROS generation
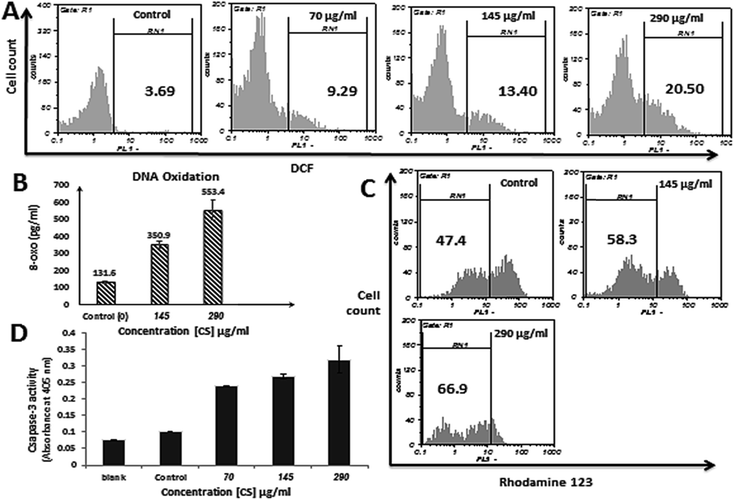
In order to examine the changes in intracellular ROS level and ROS involvement in apoptosis induced by CS, DCFH-DA assay was conducted on MDA-MB-231 cells treated with 70, 145 and 290 μg ml−1 CS for 12 h and 9.29, 13.40 and 20.50% increase in ROS generation was observed respectively, whereas, untreated cells showed only 3.69% DCF positive cells (Fig. 4A). These results indicate that CS is able to trigger ROS generation in a dose-dependent manner in treated cells.DNA oxidation
Increased level of ROS in CS treated cells may have caused DNA damage via DNA oxidation. Therefore, to investigate the effect of CS on DNA oxidation, accumulation of 8-oxoguanine (8-oxo) which is the most abundant oxidative base lesion in genomic DNA was evaluated. As shown in Fig. 4B, treatment of MDA-MB-231 cells with 145 and 290 μg ml−1 CS for 2 h has resulted in formation of 350.9 and 553.4 pg ml−1 8-oxo respectively, which is significantly higher in comparison to untreated cells (131.6 pg ml−1).CS exposure reduces mitochondrial membrane potential (ΔΨm)
ΔΨm is a key event in mitochondrial apoptotic pathway, and reduces along with the increase in mitochondrial membrane permeability. A dose-dependent increase in the mean percentage of depolarization and reduction of ΔΨm after treatment with CS was observed, which indicates the mitochondrial pathway involvement in the apoptosis induced by CS. Treatment of MDA-MB-231 cells for 12 h with 145 and 290 μg ml−1 of CS resulted in 10.9 and 19.5% decrease in functional mitochondria respectively, compared to untreated cells (Fig. 4C).CS increases caspase-3 activity in MDA-MB-231 cells
Caspase-3 is probably the best understood executioner in apoptosis and is crucial for some typical hallmarks of apoptosis such as apoptotic chromatin condensation, DNA fragmentation, and formation of apoptotic bodies. In this study, caspase-3 activation was evaluated in MDA-MB-231 cells incubated with 70, 145, and 290 μg ml−1 of CS for 4 h, and compared to the negative control, 2.3, 2.6, and 3.1 times increase in caspase-3 activity was observed respectively (Fig. 4D). This indicates that CS has induced the expression of this caspase, and the apoptosis could be triggered through a caspase-dependent process.CS treated MDA-MB-231 cells exhibit cell cycle arrest in S phase
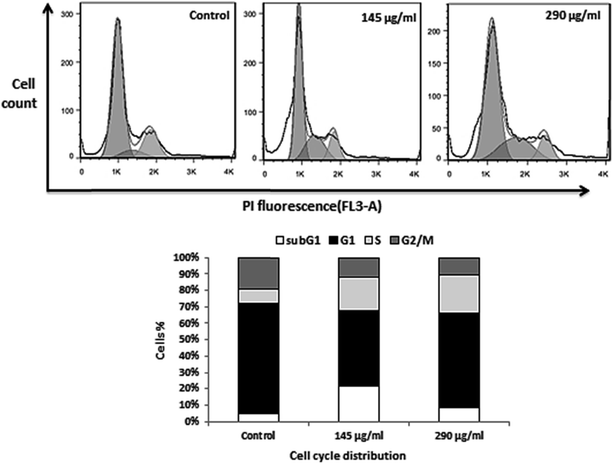
To further investigate the mechanism, underlying the CS inhibitory activity on breast cancer cells, we investigated its effect on cell cycle progression. Hence, we monitored cell cycle phase distribution of MDA-MB-231 cells after treating with 50% IC50 and IC50 concentrations of CS for 24 h, and subsequently, cell cycle profiles were analyzed by measuring the DNA content using flow cytometry. As shown in Fig. 5, treating cells with 145 and 290 μg ml−1 of CS caused substantial inhibition of cell cycle progression. The cells population in S phase increased from 8 to 21%, and an increase in subG1 population was observed. There was also a decrease in the number of cells in the G1 and G2/M-phases. These results suggest that CS disturbs cell cycle progression, leading to the accumulation of cells in S-phase.UV-visible spectra observation of CS–DNA complexes
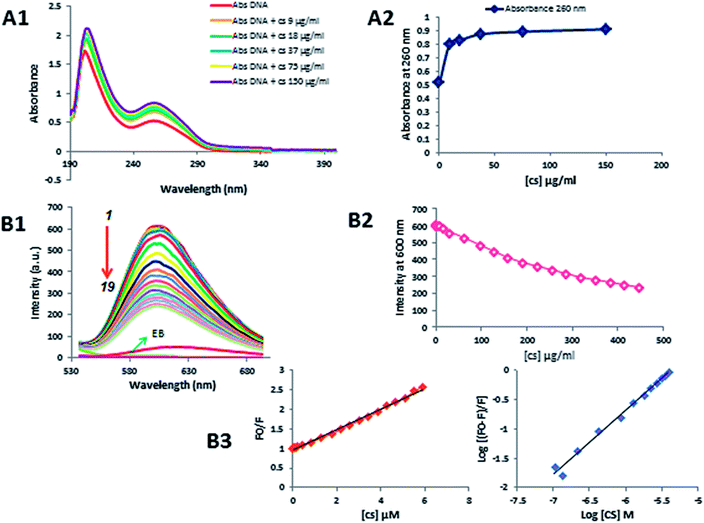
UV-visible absorption spectrum is a basic, most common and simple method, which helps in illustrating the structural changes and also sheds light on complex formation.33,34 In this study, this method was used to observe the changes of DNA absorbance spectrum in the presence of different concentrations of CS. The absorption spectra of DNA scanned in UV region in the absence and presence of different concentrations of CS (9–150 μg ml−1) at pH = 7.4 as shown in Fig. 6A1 and A2. In this region, DNA displays a peak at 260 nm (indole groups) and 210 nm (sugar-phosphate groups), while, CS has no absorption in this area. When different concentrations of CS was added to DNA, hyperchromism was observed without any noticeable shift in the position of maximum absorption peak, which clearly indicated the formation of complex between DNA and CS.35 The exact binding mode cannot be proven simply by this technique, hence, further tests were necessary to explore the mode of interaction.Competitive displacement fluorescence assay
To further explore the binding mode of CS with DNA, competitive displacement fluorescence assay was performed. As the intrinsic fluorescence of DNA is very weak, we used Ethidium Bromide (EB) as a fluorescent probe to study the interaction between DNA and CS.36 In aqueous solutions, free EB is not considerably fluorescent. However, in the presence of DNA, it is strongly emissive due to its intercalation within the DNA base pairs. Since EB intercalates DNA, competitive displacement of EB on the addition of drug will be indicative of an intercalative binding mode.37 In this study, fluorescence quenching studies were performed by keeping the fixed concentration of DNA (50 μg ml−1) and varying amounts of CS (0–448 μg ml−1). CS did not fluoresce at 600 nm when excited at 500 nm, and as the emission spectra of the DNA–EB system is shown in Fig. 6B1–B3, with increasing concentrations of CS, a remarkable reduction in fluorescence of DNA–EB system was observed, which suggests CS has substituted EB in the DNA–EB system and dissociated the EB into the solvent. This leads to a decrease in the fluorescence intensity of the DNA–EB system and has provided direct evidence in support of intercalative binding mode.Moreover, the fluorescence quenching data were analyzed to obtain the quenching constant (KSV) by using the Stern–Volmer equation:38
| (F0/F) = 1 + KSV[Q] |
log(F0 − F)/F = log![[thin space (1/6-em)]](https://www.rsc.org/images/entities/char_2009.gif) Ka + n Ka + n![[thin space (1/6-em)]](https://www.rsc.org/images/entities/char_2009.gif) log[Q] log[Q] |
The binding constant (Ka) is calculated for the quantitative measurements of binding of CS with DNA. As shown in Fig. 6B3, the plot is linear and the binding constant (Ka) for this interaction is 7.6 × 10⁵ M−1, which indicates that CS has a high affinity towards dsDNA, and number of binding sites (n) of the CS–DNA complex is 1.09. These parameters of the CS–DNA complex suggesting that CS can intercalate into DNA base pairs strongly.39
Circular dichroism study
To further confirm the interaction modes of the CS with DNA, the conformational changes of DNA in the absence and presence of small molecules was studied by CD spectroscopy. Generally, base stacking and right-handed helicity in B-form dsDNA creates a positive band at 275 nm and a negative band at 245 nm in CD spectrum respectively.40 Small molecules different binding modes of interaction with DNA may cause diverse perturbation in base stacking, which can be detected via changes in CD signals. Classical intercalation often leads to changes in the intensities of both bands due to enhancement of base stacking and stabilization of helicity, whereas simple groove binding and electrostatic interaction produce low or no perturbation on the base stacking and helicity bands.33 Fig. 7 shows that at the presence of CS, the intensity of the positive band at 275 nm and negative band at 245 nm increases remarkably, which indicates that CS mainly intercalates into DNA base pairs and enhances the base stacking.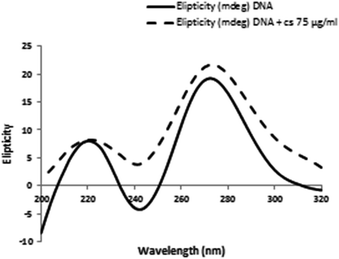 | ||
| Fig. 7 CD spectra of DNA conformational changes induced by CS were assessed by incubating DNA (100 μg ml−1) in 0.1 M phosphate buffer (pH = 7.4) in the presence of 75 μg ml−1 CS at 298 K. | ||
Conclusions
Previous studies have reported the potential of CS to induce apoptosis in leukemia, gastric, bladder and breast cancer cells. However, underlying cellular and molecular mechanism for antitumor properties of CS has not been elucidated.23,41 In the present study, we demonstrated that CS is cytotoxic towards MDA-MB-231, MCF-7, and T47D breast cancer cell lines via inducing apoptosis, while, non-toxic to non-carcinogenic L929 cells. Our results indicate that CS may selectively inhibit the viability of breast cancer cells, which is a highly desirable property of potential anticancer agents. The mitochondria-mediated cell death pathway also referred as the intrinsic apoptotic pathway is at the center of the apoptosis induced by the caspase signaling cascade activation, and plays a pivotal role in the apoptotic cell death induced by anti-cancer agents. High levels of ROS trigger mitochondrial permeability transition pore opening (ΔΨm loss), which is an important downstream signal of ROS, and the release of pro-apoptotic factors and the activation of caspase-3. Caspase-3 activation subsequently leads to DNA breakage, nuclear chromatin condensation, and apoptosis.6,42–44 As our data show, CS has induced intrinsic mitochondria-mediated apoptosis in a caspase-3-dependent manner, accompanying collapse of mitochondrial membrane potential and ROS production from mitochondria into the cytoplasm. This indicates that mitochondrial dysfunction may have occurred during CS-induced MDA-MB-231 cells death.Cancer cells proliferate relentlessly due to loss of cell cycle checkpoints that regulate the passage through the cell cycle. These check points monitor the integrity of DNA and ensure proper gene expression. Cell cycle analysis revealed an “S-phase” population increase in a concentration-dependent manner which indicates that CS can induce S phase cell cycle arrest in treated MDA-MB-231 cells. Besides, when MDA-MB-231 cells were treated for 24 h, an increase in cells in subG1 phase was observed. This suggests that CS might have induced apoptosis or DNA damage, which needs to be repaired before cell division took place. Since DNA replication is an essential phase of the cell cycle, and DNA is a bio-receptor for vast numbers of small molecules, it is considered a major biological target for anti-cancer agents. Intercalation of small molecules into DNA may be applied in therapeutic approaches to arrest cell proliferation and destroy tumor cells, or in the case of infected tissues, by preventing/inhibiting synthesis of DNA and gene transcription.45 Therefore, interaction properties of CS with DNA were investigated and the results were discussed. Previous studies have proposed that CS and its derivatives form complex with DNA by electrostatic interactions between primary amine groups of chitosan and anionic phosphate backbone of DNA. This binding protects the DNA from nuclease degradation and transfect DNA into different cell types.22,46 Here, the UV-visible, competitive fluorescence measurements and CD analysis have revealed the ability of CS to interact with DNA via intercalation with strong binding affinity. Noncovalent binders such as intercalating agents are known to induce toxicity in cancer cells by triggering apoptosis. In addition, some of these agents induce cytotoxicity via cell cycle arrest in rapidly dividing cells. To sum up, regarding specific antiproliferative activity of CS towards breast cancer cells, our results confirmed the potential of using CS as an anti-cancer agent compound.
Conflicts of interest
There are no conflicts to declare.References
- S. Hati, S. Tripathy, P. K. Dutta, R. Agarwal, R. Srinivasan, A. Singh, S. Singh and S. Sen, Sci. Rep., 2016, 6, 32213 CrossRef PubMed.
- R. E. Doherty, I. V. Sazanovich, L. K. McKenzie, A. S. Stasheuski, R. Coyle, E. Baggaley, S. Bottomley, J. A. Weinstein and H. E. Bryant, Sci. Rep., 2016, 6, 22668 CrossRef CAS PubMed.
- L. Gao, Y. Wang, Z. Xu, X. Li, J. Wu, S. Liu, P. Chu, Z. Sun, B. Sun and Y. Lin, Apoptosis, 2015, 20, 1636–1650 CrossRef CAS PubMed.
- K. Wang, C. Zhang, J. Bao, X. Jia, Y. Liang, X. Wang, M. Chen, H. Su, P. Li and J.-B. Wan, Sci. Rep., 2016, 6, 26064 CrossRef CAS PubMed.
- A. K. Mukherjee, A. J. Saviola, P. D. Burns and S. P. Mackessy, Apoptosis, 2015, 20, 1358–1372 CrossRef CAS PubMed.
- L.-H. Wu, P. Li, Q.-L. Zhao, J.-L. Piao, Y.-F. Jiao, M. Kadowaki and T. Kondo, Apoptosis, 2014, 19, 1654–1663 CrossRef CAS PubMed.
- M. R. Gill, S. N. Harun, S. Halder, R. A. Boghozian, K. Ramadan, H. Ahmad and K. A. Vallis, Sci. Rep., 2016, 6, 31973 CrossRef CAS PubMed.
- L. H. Hurley, Nat. Rev. Cancer, 2002, 2, 188–200 CrossRef CAS PubMed.
- S. Selvaraj, S. Krishnaswamy, V. Devashya, S. Sethuraman and U. M. Krishnan, RSC Adv., 2012, 2, 2797–2802 RSC.
- H. Huang, P. Zhang, Y. Chen, K. Qiu, C. Jin, L.-N. Ji and H. Chao, Dalton Trans., 2016, 13135–13145 RSC.
- M. A. Husain, S. U. Rehman, H. M. Ishqi, T. Sarwar and M. Tabish, RSC Adv., 2015, 5, 64335–64345 RSC.
- M. Sirajuddin, S. Ali and A. Badshah, J. Photochem. Photobiol., B, 2013, 124, 1–19 CrossRef CAS PubMed.
- Y. Chen, K. Ma, T. Hu, B. Jiang, B. Xu, W. Tian, J. Z. Sun and W. Zhang, Nanoscale, 2015, 7, 8939–8945 RSC.
- R. Manikandan, N. Chitrapriya, Y. J. Jang and P. Viswanathamurthi, RSC Adv., 2013, 3, 11647–11657 RSC.
- X.-F. Zhang, R.-q. Sun, Y.-f. Jia, Q. Chen, R.-F. Tu, K.-k. Li, X.-D. Zhang, R.-L. Du and R.-h. Cao, Sci. Rep., 2016, 6, 33204 CrossRef CAS PubMed.
- G. Liu, S. Kuang, S. Wu, W. Jin and C. Sun, Sci. Rep., 2016, 6, 26722 CrossRef CAS PubMed.
- A. Zong, H. Cao and F. Wang, Carbohydr. Polym., 2012, 90, 1395–1410 CrossRef CAS PubMed.
- M. N. R. Kumar, React. Funct. Polym., 2000, 46, 1–27 CrossRef CAS.
- A. Rajalakshmi, N. Krithiga and A. Jayachitra, Middle East J. Sci. Res., 2013, 16, 1446–1451 CAS.
- B. Santos-Carballal, L. Aaldering, M. Ritzefeld, S. Pereira, N. Sewald, B. Moerschbacher, M. Götte and F. Goycoolea, Sci. Rep., 2015, 5, 13567 CrossRef CAS PubMed.
- A. Anitha, S. Sowmya, P. S. Kumar, S. Deepthi, K. Chennazhi, H. Ehrlich, M. Tsurkan and R. Jayakumar, Prog. Polym. Sci., 2014, 39, 1644–1667 CrossRef CAS.
- Y. Wang, X. Zhang and G. Yang, RSC Adv., 2015, 5, 29594–29600 RSC.
- M. Dash, F. Chiellini, R. Ottenbrite and E. Chiellini, Prog. Polym. Sci., 2011, 36, 981–1014 CrossRef CAS.
- S. Hajji, I. Younes, M. Rinaudo, K. Jellouli and M. Nasri, Appl. Biochem. Biotechnol., 2015, 177, 18–35 CrossRef CAS PubMed.
- E. Szymańska and K. Winnicka, Mar. Drugs, 2015, 13, 1819–1846 CrossRef PubMed.
- S. Chandra, N. Chakraborty, A. Dasgupta, J. Sarkar, K. Panda and K. Acharya, Sci. Rep., 2015, 5, 15195 CrossRef CAS PubMed.
- J. R. Gilbert and J. M. Vance, Current Protocols in Human genetics, 2001, p. 6 Search PubMed.
- L. M. Bravo-Anaya, J. A. Soltero and M. Rinaudo, Int. J. Biol. Macromol., 2016, 88, 345–353 CrossRef CAS PubMed.
- Z. Wang, H. Zhang, M. Shi, Y. Yu, H. Wang, W.-M. Cao, Y. Zhao and H. Zhang, Sci. Rep., 2016, 6, 32737 CrossRef CAS PubMed.
- M. Huang, E. Khor and L.-Y. Lim, Pharm. Res., 2004, 21, 344–353 CrossRef CAS.
- C. A. Livasy, G. Karaca, R. Nanda, M. S. Tretiakova, O. I. Olopade, D. T. Moore and C. M. Perou, Mod. Pathol., 2006, 19, 264 CrossRef CAS PubMed.
- K. Palanivel, V. Kanimozhi, B. Kadalmani and M. A. Akbarsha, J. Cell. Biochem., 2014, 115, 2022–2032 CAS.
- N. Shahabadi and N. H. Moghadam, Spectrochim. Acta, Part A, 2012, 96, 723–728 CrossRef CAS PubMed.
- X. Zhou, G. Zhang and J. Pan, Int. J. Biol. Macromol., 2015, 74, 185–194 CrossRef CAS PubMed.
- S. Agarwal, D. K. Jangir and R. Mehrotra, J. Photochem. Photobiol., B, 2013, 120, 177–182 CrossRef CAS PubMed.
- S. Nafisi, A. A. Saboury, N. Keramat, J.-F. Neault and H.-A. Tajmir-Riahi, J. Mol. Struct., 2007, 827, 35–43 CrossRef CAS.
- R. Bera, B. K. Sahoo, K. S. Ghosh and S. Dasgupta, Int. J. Biol. Macromol., 2008, 42, 14–21 CrossRef CAS PubMed.
- S. Bhattacharya, G. Mandal and T. Ganguly, J. Photochem. Photobiol., B, 2010, 101, 89–96 CrossRef CAS PubMed.
- K. S. Ghosh, B. K. Sahoo, D. Jana and S. Dasgupta, J. Inorg. Biochem., 2008, 102, 1711–1718 CrossRef CAS PubMed.
- S. Dogra, P. Awasthi, M. Nair and R. Barthwal, J. Photochem. Photobiol., B, 2013, 123, 48–54 CrossRef CAS PubMed.
- L. Gibot, S. Chabaud, S. Bouhout, S. Bolduc, F. A. Auger and V. J. Moulin, Int. J. Biol. Macromol., 2015, 72, 370–379 CrossRef CAS PubMed.
- N. Jaiswal, C. K. Maurya, D. Arha, D. R. Avisetti, A. Prathapan, P. S. Raj, K. G. Raghu, S. V. Kalivendi and A. K. Tamrakar, Apoptosis, 2015, 20, 930–947 CrossRef CAS PubMed.
- E. J. Lim, J. Heo and Y.-H. Kim, Apoptosis, 2015, 20, 1087–1098 CrossRef CAS PubMed.
- P. Xu, X. Cai, W. Zhang, Y. Li, P. Qiu, D. Lu and X. He, Apoptosis, 2016, 21, 1125–1143 CrossRef CAS PubMed.
- K. Bishayee, S. Ghosh, A. Mukherjee, R. Sadhukhan, J. Mondal and A. Khuda-Bukhsh, Cell Proliferation, 2013, 46, 153–163 CrossRef CAS PubMed.
- D. Agudelo, L. Kreplak and H. Tajmir-Riahi, Carbohydr. Polym., 2016, 137, 207–213 CrossRef CAS PubMed.
| This journal is © The Royal Society of Chemistry 2017 |

