 Open Access Article
Creative Commons Attribution 3.0 Unported Licence
Investigation of the solid forms of deferasirox: solvate, co-crystal, and amorphous form†
Qiaohong Du,
Xinnuo Xiong,
Zili Suo,
Peixiao Tang*,
Jiawei He,
Xia Zeng,
Quan Hou and
Hui Li *
*
College of Chemical Engineering, Sichuan University, Chengdu, Sichuan, China. E-mail: tangpeixiao@126.com; lihuilab@sina.com; Fax: +86 028 85401207; Tel: +86 028 85405149
First published on 6th September 2017
Abstract
Deferasirox (DFX) is an oral iron chelator. This study prepared and characterized five solid forms of DFX including monohydrate (DFX–H2O), dimethylformamide solvate (DFX–DMF), two co-crystals of DFX and isonicotinamide (INA) (DFX–INA and DFX–2INA), and amorphous DFX. Single crystals of DFX–H2O, DFX–DMF, DFX–INA, and DFX–2INA were obtained through solvent crystallization, and their structures were determined by single-crystal X-ray diffraction analysis. DFX–H2O, DFX–DMF, DFX–INA, and DFX–2INA were all monoclinic with P21/c, P21/c, P21/c, and C2/c space groups, respectively. In the four solid forms, the DFX molecule always maintained an S(6) ring motif, and its carboxylic acid moiety easily formed hydrogen bonds with the solvent or INA molecules. Solid forms were preliminarily estimated by stability and in vitro dissolution tests. DFX–INA and amorphous DFX showed good stability under ambient conditions and better dissolution characteristic compared with commercial DFX in phosphate buffer medium (pH 6.8). Thus, DFX–INA and amorphous DFX exhibited potential as preponderant solid forms of DFX for drug development.
Introduction
Different solid forms of active pharmaceutical ingredients (APIs) exhibit different physicochemical properties, such as morphology, thermodynamic property,1 solubility,2,3 dissolution rate,4,5 and stability,6,7 which affect the bioavailability, efficacy, and side effects of drugs. Therefore, scholars have focused on exploring novel solid forms of APIs, such as polymorphs,8,9 solvates,10,11 co-crystals,12,13 salts,4 and amorphous solids,14,15 for drug development. Over the past few decades, solvates, co-crystals, and amorphous solids have been used to improve the solubility and dissolution characteristic of APIs. Examples of these solid forms include indinavir sulfate ethanolate,16 digoxin–hydroquinone co-crystal and amorphous indomethacin.15 In addition to studying the physicochemical properties of solvates and co-crystals, understanding the structural feature of them are of great importance.Deferasirox (DFX), ICL670, 4-[3,5-bis (2-hydroxyphenyl)-1,2,4-triazol-1-yl] benzoic acid, is a once-daily oral iron chelator that is approved and widely used for treatment of transfusion-dependent chronic iron overload.17–19 And DFX is the first iron chelator subjected to a randomized clinical trial and confirmed to be effective in reducing iron burden in patients with non-transfusion-dependent thalassemia.20–22 DFX is also used in salvage therapy for patients with progressive rhinocerebral mucormycosis.23 Commercial DFX exhibits poor solubility and slow dissolution rate in water,24,25 which are major limitations in achieving adequate oral bioavailability for a large percentage of drug compounds in drug development nowadays. Hence, developing various solid forms of DFX and screening them for drug formulation have great significance. Thus far, only the crystal structures of commercial DFX26 and its dimethylformamide solvate (DFX–DMF)27 have been reported.
We attempted to ameliorate the dissolution property of DFX by developing new solid forms, especially by co-crystallizing DFX with soluble molecules. Analyzing the structure of DFX (Fig. 1), a carboxylic acid moiety is found, which is known to form robust hydrogen-bonded synthon with pyridine and amide compounds. Isonicotinamide (INA, Fig. 1) is a general co-crystallizing compound used in pharmaceutical industry.28,29 In INA, the pyridine N atom readily acts as a hydrogen bond acceptor upon encounter with hydrogen bond donors, such as carboxylic acids and alcohols.30 Theoretically, DFX can aggregate with INA.
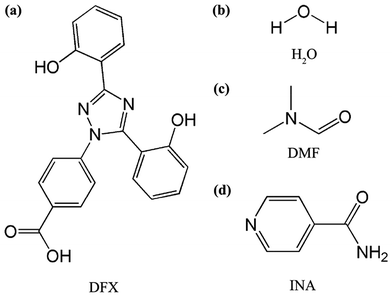 | ||
| Fig. 1 Chemical structures of (a) deferasirox (DFX), (b) H2O, (c) N,N-dimethylformamide (DMF), and (d) isonicotinamide (INA). | ||
In this study, two co-crystals of DFX and INA with different molar ratios (1![[thin space (1/6-em)]](https://www.rsc.org/images/entities/char_2009.gif) :
:![[thin space (1/6-em)]](https://www.rsc.org/images/entities/char_2009.gif) 1 and 1
1 and 1![[thin space (1/6-em)]](https://www.rsc.org/images/entities/char_2009.gif) :
:![[thin space (1/6-em)]](https://www.rsc.org/images/entities/char_2009.gif) 2) were successfully prepared and named as DFX–INA and DFX–2INA, respectively. Monohydrate (DFX–H2O), DFX–DMF, and amorphous DFX were also prepared. The crystal structures of the solvates and co-crystals were determined by single-crystal X-ray diffraction (SXRD) analysis. The thermal stability and storage stability of the five DFX solid forms were also investigated. Based on the results, the dissolution property of the relatively stable solid forms, namely, DFX–INA and amorphous DFX, was further evaluated.
2) were successfully prepared and named as DFX–INA and DFX–2INA, respectively. Monohydrate (DFX–H2O), DFX–DMF, and amorphous DFX were also prepared. The crystal structures of the solvates and co-crystals were determined by single-crystal X-ray diffraction (SXRD) analysis. The thermal stability and storage stability of the five DFX solid forms were also investigated. Based on the results, the dissolution property of the relatively stable solid forms, namely, DFX–INA and amorphous DFX, was further evaluated.
Experimental
Materials
Commercial DFX (purity ≥ 98%) was purchased from E-ternity Technology Co., Ltd. (Shanghai, China). Isonicotinamide was acquired from J&K Scientific Ltd. (Beijing, China). Chromatographic-grade methanol was obtained from Kelong Co., Ltd. (Chengdu, China) and used for high-performance liquid chromatography (HPLC) test. The other reagents and chemicals used were of analytical grade.Preparation of DFX solvates, co-crystals, and amorphous form
![[thin space (1/6-em)]](https://www.rsc.org/images/entities/char_2009.gif) :
:![[thin space (1/6-em)]](https://www.rsc.org/images/entities/char_2009.gif) 1 v/v) solvent through slow evaporation at 25 °C.
1 v/v) solvent through slow evaporation at 25 °C.![[thin space (1/6-em)]](https://www.rsc.org/images/entities/char_2009.gif) :
:![[thin space (1/6-em)]](https://www.rsc.org/images/entities/char_2009.gif) 1 v/v) or ethanol/tetrahydrofuran (THF) (1
1 v/v) or ethanol/tetrahydrofuran (THF) (1![[thin space (1/6-em)]](https://www.rsc.org/images/entities/char_2009.gif) :
:![[thin space (1/6-em)]](https://www.rsc.org/images/entities/char_2009.gif) 1 v/v). The solution was slowly evaporated at 25 °C to obtain single crystals of DFX–INA. The same co-crystal was also obtained quickly by melt crystallization. A physical mixture of DFX and INA (slightly excessive) was heated to the melting point of INA for 20 min and cooled to room temperature to obtain DFX–INA co-crystal powder.
1 v/v). The solution was slowly evaporated at 25 °C to obtain single crystals of DFX–INA. The same co-crystal was also obtained quickly by melt crystallization. A physical mixture of DFX and INA (slightly excessive) was heated to the melting point of INA for 20 min and cooled to room temperature to obtain DFX–INA co-crystal powder.![[thin space (1/6-em)]](https://www.rsc.org/images/entities/char_2009.gif) :
:![[thin space (1/6-em)]](https://www.rsc.org/images/entities/char_2009.gif) 2 molar ratio were dissolved in acetone/THF (1
2 molar ratio were dissolved in acetone/THF (1![[thin space (1/6-em)]](https://www.rsc.org/images/entities/char_2009.gif) :
:![[thin space (1/6-em)]](https://www.rsc.org/images/entities/char_2009.gif) 1 v/v). The solution was slowly evaporated at 25 °C to obtain small flake-shaped single crystals of DFX–2INA after 2 weeks. Shaking the solution with ultrasonication at 80 kHz for 1 h, single crystals of DFX–2INA could be obtained after 1 day.
1 v/v). The solution was slowly evaporated at 25 °C to obtain small flake-shaped single crystals of DFX–2INA after 2 weeks. Shaking the solution with ultrasonication at 80 kHz for 1 h, single crystals of DFX–2INA could be obtained after 1 day.Analytical methods
Stability study
The samples were sealed and kept at 40 °C, 4 °C, and −20 °C to investigate the effect of temperature on the stability of the solid forms. The samples were also kept in desiccators at 25 °C under relative humidity (RH) levels of 32%, 57%, and 75% by using saturated salt solutions of MgCl2, NaBr, and NaCl, respectively,33 to determine the effect of humidity on the stability of the solid forms. The stability of the relatively stable solid forms was also measured under the accelerated International Conference on Harmonization (ICH)34 conditions of 40 °C and 75% RH. All of the samples were monitored by PXRD analysis at regular time intervals.Dissolution test
In vitro dissolution studies were conducted using a ZRC-8D dissolution tester (Chuangxing, Tianjin, China) at 37 ± 0.5 °C with a paddle speed of 100 rpm. Samples equivalent to 50 mg of DFX were added to 900 mL of dissolution medium (tri-distilled water and phosphate buffer solution (PBS), pH 6.8). Aliquots (4 mL) of the sample solutions were withdrawn at specific time points (2, 5, 10, 20, 30, 40, 60, 120, 180 and 240 min), and filtered through a 0.45 μm hydrophilic membrane. An equivalent amount of fresh medium was added to maintain a constant volume. Each sample was performed in triplicate.DFX concentration in the filtered sample solution was measured at λ = 247 nm (λmax of DFX) on an Agilent 1200 Series HPLC system (Agilent, California, USA) equipped with a quaternary pump and a DAD detector. Chromatographic separation was performed on a Kromasil C18 column (5 μm particle size and 120 Å pore size, 250 mm × 4.6 mm i.d.) by using a gradient elution program with methanol–water (0.2% (v/v) formic acid) as mobile phase. The linear gradient elution program was set as follows: Ttime/methanol![[thin space (1/6-em)]](https://www.rsc.org/images/entities/char_2009.gif) :
:![[thin space (1/6-em)]](https://www.rsc.org/images/entities/char_2009.gif) water (%): T0/30
water (%): T0/30![[thin space (1/6-em)]](https://www.rsc.org/images/entities/char_2009.gif) :
:![[thin space (1/6-em)]](https://www.rsc.org/images/entities/char_2009.gif) 70, T3/30
70, T3/30![[thin space (1/6-em)]](https://www.rsc.org/images/entities/char_2009.gif) :
:![[thin space (1/6-em)]](https://www.rsc.org/images/entities/char_2009.gif) 70, T5/95
70, T5/95![[thin space (1/6-em)]](https://www.rsc.org/images/entities/char_2009.gif) :
:![[thin space (1/6-em)]](https://www.rsc.org/images/entities/char_2009.gif) 5, and T20/95
5, and T20/95![[thin space (1/6-em)]](https://www.rsc.org/images/entities/char_2009.gif) :
:![[thin space (1/6-em)]](https://www.rsc.org/images/entities/char_2009.gif) 5. The retention times of DFX and INA solutions were 9.4 and 2.8 min, respectively, and the same values were observed for co-crystal solutions. The cumulative drug release percentage at each time point was calculated using following equation:
5. The retention times of DFX and INA solutions were 9.4 and 2.8 min, respectively, and the same values were observed for co-crystal solutions. The cumulative drug release percentage at each time point was calculated using following equation:
 | (1) |
Results and discussion
Identification of different DFX solid forms
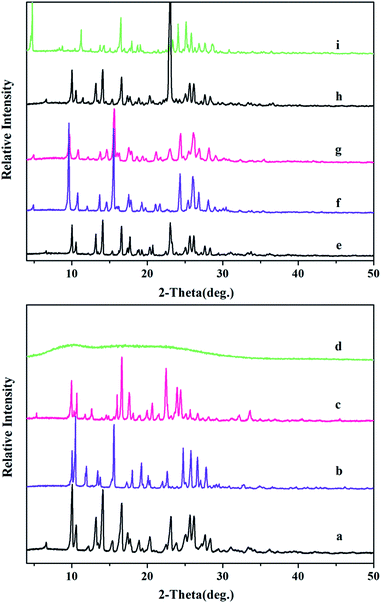
The different solid forms can be easily distinguished by their unique PXRD patterns. The PXRD patterns of DFX–H2O, DFX–DMF, and amorphous DFX differ from that of commercial DFX, PXRD patterns of DFX–INA and DFX–2INA co-crystals are distinct from the corresponding physical mixture of DFX and INA (Fig. 2). Table S1 (ESI†) displays the major peaks at 2θ values of the solvates and co-crystals. The pattern of the amorphous DFX exhibits a characteristic “amorphous halo” without any sharp diffraction peaks. Although the amorphous DFX was obtained by melt quenching, the 1H-NMR result (Fig. S1(a), ESI†) and UV-vis absorption spectra (Fig. S1(b), ESI†) revealed that the DFX molecule did not degrade during the melting process.The purity of the product can be judged sketchily by comparing the experimental PXRD pattern and the simulated pattern from the corresponding single-crystal data. The PXRD patterns of DFX–H2O, DFX–DMF, and DFX–2INA match well with the simulated patterns (Fig. S2, ESI†). DFX–INA obtained by solvent evaporation exhibits higher purity than that obtained by melt crystallization (Fig. S2(c), ESI†). This result could be due to the fact that excessive INA was used in melt crystallization and acted as impurity in the product.
Crystal structure analyses of DFX solvates and co-crystals
SXRD analysis was performed to absolutely identify the new solid forms and elucidate their structures. Table 1 lists the crystallographic data of DFX–H2O, DFX–DMF, DFX–INA, and DFX–2INA, and Table 2 depicts the details of hydrogen bonds. All the hydrogens in these crystals were located and refined. DFX molecules in the different solid forms exhibit the same intramolecular hydrogen bond (O2–H2⋯N3), which generates an S(6) ring motif;35,36 the bond causes the phenol ring constituted by O2 to be roughly coplanar with the central triazole ring (the torsional angle is less than 2.5°) and the other phenol ring to be almost perpendicular to the triazole moiety (the torsional angle is more than 70°).| Parameter | DFX–H2O | DFX–DMF | DFX–INA | DFX–2INA |
| Formula | C21H17N3O5 | C24H22N4O5 | C27H21N5O5 | C33H27N7O6 |
| M/g mol−1 | 391.38 | 446.45 | 495.49 | 617.61 |
| Crystal system | Monoclinic | Monoclinic | Monoclinic | Monoclinic |
| Space group | P21/c | P21/c | P21/c | C2/c |
| a/Å | 8.9201(2) | 8.9013(4) | 9.3205(3) | 21.5782(6) |
| b/Å | 29.7303(8) | 33.2054(14) | 36.1503(10) | 8.4837(2) |
| c/Å | 7.2074(2) | 7.7293(3) | 7.1171(3) | 37.8874(12) |
| α/° | 90.00 | 90.00 | 90.00 | 90.00 |
| β/° | 97.790(3) | 94.210(4) | 100.206(3) | 101.377(3) |
| γ/° | 90.00 | 90.00 | 90.00 | 90.00 |
| V/Å3 | 1893.75(8) | 2278.41(15) | 2360.06(13) | 6799.5(3) |
| Z | 4 | 4 | 4 | 8 |
| Dcal/g cm−3 | 1.373 | 1.302 | 1.395 | 1.207 |
| T/K | 293 | 293 | 293 | 293 |
| μ/mm−1 | 0.100 | 0.093 | 0.099 | 0.086 |
| F000 | 816 | 936 | 1032 | 2576 |
| Independent reflections | 3848 | 4661 | 4815 | 6852 |
| R1/wR2 [I > 2σ(I)] | 0.0432/0.0991 | 0.0532/0.1280 | 0.0558/0.1213 | 0.0483/0.1212 |
| R1/wR2 [all data] | 0.0546/0.1076 | 0.0737/0.1456 | 0.0720/0.1295 | 0.0586/0.1281 |
| GOF on F2 | 1.038 | 1.046 | 1.085 | 1.030 |
| CCDC number | 1532021 | 1555279 | 1527596 | 1527600 |
| D–H⋯A | d (D–H)/Å | d (H⋯A)/Å | d (D⋯A)/Å | ∠(D–H⋯A)/deg | Symmetry code | |
|---|---|---|---|---|---|---|
| a Intramolecular hydrogen bond. | ||||||
| DFX–H2O | O1–H1⋯N1 | 0.820 | 1.98 | 2.787(2) | 165 | x, −y + 3/2, z − 1/2 |
| O2–H2⋯N3 | 0.820 | 1.89 | 2.622(2) | 148 | —a | |
| O4–H4⋯O5 | 0.820 | 1.78 | 2.583(2) | 167 | −x + 1, −y + 1, −z | |
| O5–H5A⋯O2 | 0.850 | 2.02 | 2.871(2) | 175 | ||
| O5–H5B⋯O3 | 0.850 | 1.96 | 2.763(2) | 158 | X − 1, y, z + 1 | |
| DFX–DMF | O1–H1⋯N1 | 0.820 | 1.99 | 2.783(2) | 164 | x, −y + 1/2, z + 1/2 |
| O2–H2⋯N3 | 0.820 | 1.92 | 2.638(2) | 146 | —a | |
| O4–H4⋯O5 | 0.820 | 1.78 | 2.595(3) | 176 | x, y, z + 1 | |
| C22–H22⋯O3 | 0.930 | 2.46 | 3.117(4) | 128 | x, y, z − 1 | |
| DFX–INA | O1–H1⋯N1 | 0.820 | 1.99 | 2.790(2) | 164 | x, −y + 1/2, z − 1/2 |
| O2–H2⋯N3 | 0.820 | 1.89 | 2.619(3) | 148 | —a | |
| O4–H4⋯N4 | 0.820 | 1.78 | 2.580(3) | 165 | −x + 1, −y + 1, −z | |
| N5–H5A⋯O5 | 0.860 | 2.00 | 2.854(3) | 172 | −x, −y + 1, −z + 2 | |
| N5–H5B⋯O3 | 0.860 | 2.17 | 2.960(3) | 152 | x, y, z + 1 | |
| C22–H22⋯O2 | 0.930 | 2.44 | 3.194(3) | 138 | −x, −y + 1, −z + 1 | |
| DFX–2INA | O1–H1⋯N6 | 0.820 | 1.92 | 2.712(2) | 163 | −x + 1, −y, −z + 1 |
| O2–H2⋯N3 | 0.820 | 1.92 | 2.647(2) | 148 | —a | |
| O4–H4⋯N4 | 0.820 | 1.89 | 2.681(2) | 163 | ||
| N5–H5B⋯O6 | 0.902 | 1.99 | 2.890(3) | 173 | x + 1/2, −y + 3/2, z + 1/2 | |
| C20–H20⋯O1 | 0.930 | 2.51 | 3.195(2) | 130 | −x + 1, −y, −z + 1 | |
| C25–H25⋯O5 | 0.930 | 2.57 | 3.412(3) | 151 | −x + 1, y, −z + 3/2 | |
| N7–H7B⋯N1 | 0.911 | 2.16 | 3.028(2) | 175 | x − 1/2, y + 1/2, z | |
| N7–H7A⋯O5 | 0.867 | 2.02 | 2.930(2) | 173 | x − 1/2, −y + 3/2, z − 1/2 | |
![[thin space (1/6-em)]](https://www.rsc.org/images/entities/char_2009.gif) :
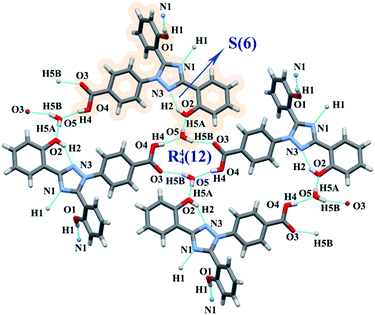
:![[thin space (1/6-em)]](https://www.rsc.org/images/entities/char_2009.gif) 1 solvate. Water in DFX–H2O acted as a bridge between neighboring DFX molecules. Two water molecules were connected with the carboxylic acid moiety of two DFX molecules through O–H⋯O hydrogen bonds (O5–H5B⋯O3, O4–H4⋯O5), generating an R44(12) ring motif.35,36 Each water molecule was connected to another DFX molecule through O5–H5A⋯O2 hydrogen bond (Fig. 3). O1–H1⋯N1 became the only directly connected hydrogen bond between DFX molecules. The R44(12) ring motif and O5–H5A⋯O2 hydrogen bond induced the layered arrangement of the DFX molecules, and the layered structure stretched in a waved shape along the b-axis (Fig. S3, ESI†).
1 solvate. Water in DFX–H2O acted as a bridge between neighboring DFX molecules. Two water molecules were connected with the carboxylic acid moiety of two DFX molecules through O–H⋯O hydrogen bonds (O5–H5B⋯O3, O4–H4⋯O5), generating an R44(12) ring motif.35,36 Each water molecule was connected to another DFX molecule through O5–H5A⋯O2 hydrogen bond (Fig. 3). O1–H1⋯N1 became the only directly connected hydrogen bond between DFX molecules. The R44(12) ring motif and O5–H5A⋯O2 hydrogen bond induced the layered arrangement of the DFX molecules, and the layered structure stretched in a waved shape along the b-axis (Fig. S3, ESI†).
![[thin space (1/6-em)]](https://www.rsc.org/images/entities/char_2009.gif) :
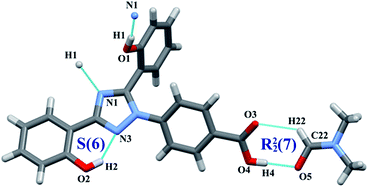
:![[thin space (1/6-em)]](https://www.rsc.org/images/entities/char_2009.gif) 1 solvate. The SXRD results are similar to the reported data.27 DMF molecules were connected with DFX molecules through R22(7) dimer motifs (O4–H4⋯O5 and C22–H22⋯O3).35,36 The DFX molecules were linked with each other through O1–H1⋯N1 hydrogen bonds (Fig. 4). The packing diagram of DFX–DMF was showed in Fig. S4 (ESI†).
1 solvate. The SXRD results are similar to the reported data.27 DMF molecules were connected with DFX molecules through R22(7) dimer motifs (O4–H4⋯O5 and C22–H22⋯O3).35,36 The DFX molecules were linked with each other through O1–H1⋯N1 hydrogen bonds (Fig. 4). The packing diagram of DFX–DMF was showed in Fig. S4 (ESI†).
![[thin space (1/6-em)]](https://www.rsc.org/images/entities/char_2009.gif) :
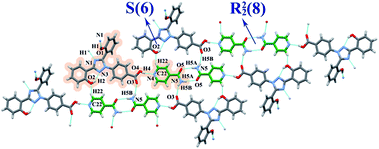
:![[thin space (1/6-em)]](https://www.rsc.org/images/entities/char_2009.gif) 1 co-crystal. The amide moieties of two INA molecules were connected through N5–H5A⋯O5 hydrogen bonds, generating an R22(8) ring motif.35,36 One INA molecule was connected with three neighboring DFX molecules through O4–H4⋯N4, N5–H5B⋯O3, and C22–H22⋯O2 hydrogen bonds. Similar to that in DFX–DMF, the DFX molecules in DFX–INA were connected with each other through O1–H1⋯N1 hydrogen bonds (Fig. 5). In packing diagram, alternate arrangements of DFX and INA molecules were formed a corrugated layer structure along the b-axis (Fig. S5, ESI†).
1 co-crystal. The amide moieties of two INA molecules were connected through N5–H5A⋯O5 hydrogen bonds, generating an R22(8) ring motif.35,36 One INA molecule was connected with three neighboring DFX molecules through O4–H4⋯N4, N5–H5B⋯O3, and C22–H22⋯O2 hydrogen bonds. Similar to that in DFX–DMF, the DFX molecules in DFX–INA were connected with each other through O1–H1⋯N1 hydrogen bonds (Fig. 5). In packing diagram, alternate arrangements of DFX and INA molecules were formed a corrugated layer structure along the b-axis (Fig. S5, ESI†).
![[thin space (1/6-em)]](https://www.rsc.org/images/entities/char_2009.gif) :
:![[thin space (1/6-em)]](https://www.rsc.org/images/entities/char_2009.gif) 2 co-crystal, which also contains crystal solvent (THF) molecules in the lattice (DFX
2 co-crystal, which also contains crystal solvent (THF) molecules in the lattice (DFX![[thin space (1/6-em)]](https://www.rsc.org/images/entities/char_2009.gif) :
:![[thin space (1/6-em)]](https://www.rsc.org/images/entities/char_2009.gif) INA
INA![[thin space (1/6-em)]](https://www.rsc.org/images/entities/char_2009.gif) :
:![[thin space (1/6-em)]](https://www.rsc.org/images/entities/char_2009.gif) THF = 1
THF = 1![[thin space (1/6-em)]](https://www.rsc.org/images/entities/char_2009.gif) :
:![[thin space (1/6-em)]](https://www.rsc.org/images/entities/char_2009.gif) 2
2![[thin space (1/6-em)]](https://www.rsc.org/images/entities/char_2009.gif) :
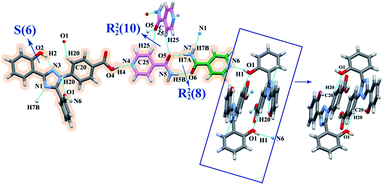
:![[thin space (1/6-em)]](https://www.rsc.org/images/entities/char_2009.gif) 1, molar ratio). The THF molecules were in a disordered state, which resulted in the inability to hydrogenate the THF carbon skeleton in the process of structure refinement. Considering the intermolecular force between the THF and co-crystal was relatively weak, the THF molecules were removed in the process of structure analysis, and this operation will not affect the arrangement of DFX and INA molecules in the lattice. Two types of INA molecules with different hydrogen bonds connection in DFX–2INA were named as I-INA (green) and II-INA (pink). The I-INA and II-INA molecules were connected through N5–H5B⋯O6 and N7–H7A⋯O5 hydrogen bonds, forming a R22(8) ring motif between the amide moiety.35,36 The II-INA molecules were connected to one another through two C25–H25⋯O5 hydrogen bonds, which formed a R22(10) ring motif (Fig. 6).35,36 The I-INA molecules were connected with two neighboring DFX molecules through O1–H1⋯N6 and N7–H7B⋯N1 hydrogen bonds. By contrast, the II-INA molecules were only linked with one DFX molecule through O4–H4⋯N4 hydrogen bonds. Two neighboring DFX molecules were connected through C20–H20⋯O1 hydrogen bonds, and their central triazole rings were stacked in parallel (Fig. 6). The packing diagram of DFX–2INA was showed in Fig. S6 (ESI†). The single crystal structure of DFX–2INA without eliminating the THF carbon skeleton is shown in the Fig. S7 (ESI†).
1, molar ratio). The THF molecules were in a disordered state, which resulted in the inability to hydrogenate the THF carbon skeleton in the process of structure refinement. Considering the intermolecular force between the THF and co-crystal was relatively weak, the THF molecules were removed in the process of structure analysis, and this operation will not affect the arrangement of DFX and INA molecules in the lattice. Two types of INA molecules with different hydrogen bonds connection in DFX–2INA were named as I-INA (green) and II-INA (pink). The I-INA and II-INA molecules were connected through N5–H5B⋯O6 and N7–H7A⋯O5 hydrogen bonds, forming a R22(8) ring motif between the amide moiety.35,36 The II-INA molecules were connected to one another through two C25–H25⋯O5 hydrogen bonds, which formed a R22(10) ring motif (Fig. 6).35,36 The I-INA molecules were connected with two neighboring DFX molecules through O1–H1⋯N6 and N7–H7B⋯N1 hydrogen bonds. By contrast, the II-INA molecules were only linked with one DFX molecule through O4–H4⋯N4 hydrogen bonds. Two neighboring DFX molecules were connected through C20–H20⋯O1 hydrogen bonds, and their central triazole rings were stacked in parallel (Fig. 6). The packing diagram of DFX–2INA was showed in Fig. S6 (ESI†). The single crystal structure of DFX–2INA without eliminating the THF carbon skeleton is shown in the Fig. S7 (ESI†).
Shape and morphology
Fig. S8 (ESI†) shows the photomicrographs or photos of six DFX solid forms. Commercial DFX crystallized from methanol through slow solvent evaporation shows a spindle-like or thin rod-like structure. DFX–H2O possesses a tabular crystal structure with a cusp. DFX–DMF exhibits a large prismatic structure. DFX–INA shows a hemispherical agglomeration of small flaky crystals. DFX–2INA also displays a flaky crystal structure but is larger than DFX–INA. Amorphous DFX obtained by melt quenching manifests as a dark yellow block.Thermal analysis
DSC and TGA data provide information on solid behavior during heating. Fig. 7 shows the DSC curves of different DFX solid forms and INA. Commercial DFX was confirmed as the most stable solid form according to the DSC result, and only a single sharp melting endothermic peak appeared at 262.9 °C (onset) without any thermal moment prior to the melting point. The DSC curve of DFX–H2O showed a broad desolvation peak over the range of 75–127 °C, followed by a melting peak of DFX at 262.5 °C. Similarly, DFX–DMF displayed a desolvation peak over the range of 103–121 °C and a melting peak of DFX at 262.2 °C. Amorphous DFX showed an obvious glass transition at 94.4 °C (Tg) followed by an exothermic recrystallization peak at 150.5 °C, which are specific thermodynamic phenomena to amorphous solid forms. Furthermore, the melting endothermic peak at 260 °C in DSC curve and the PXRD pattern of amorphous DFX detected at 150 °C (Fig. 12(b)) indicated that amorphous DFX recrystallized as commercial DFX upon heating.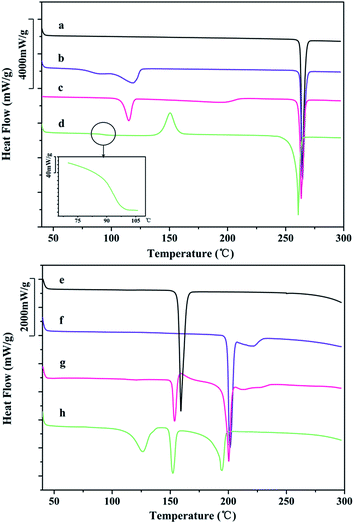 | ||
Fig. 7 DSC curves of (a) DFX, (b) DFX–H2O, (c) DFX–DMF, (d) amorphous DFX, (e) INA, (f) DFX–INA, (g) DI-mix 1![[thin space (1/6-em)]](https://www.rsc.org/images/entities/char_2009.gif) : :![[thin space (1/6-em)]](https://www.rsc.org/images/entities/char_2009.gif) 1, and (h) DFX–2INA. 1, and (h) DFX–2INA. | ||
As for the co-crystals, the DSC curve of INA showed one endothermic peak over the range of 150–169 °C, this peak corresponds to the melting and decomposition process of INA. DFX–INA revealed a eutectic melting peak at about 199.2 °C, followed by an additional small broad peak due to the degradation of INA. The eutectic melting point of DFX–INA is higher than the melting point of single INA 40 °C, preliminarily illustrate that DFX–INA co-crystal improves the thermal stability of INA. The DSC curve of the physical mixture (DFX and INA in a 1![[thin space (1/6-em)]](https://www.rsc.org/images/entities/char_2009.gif) :
:![[thin space (1/6-em)]](https://www.rsc.org/images/entities/char_2009.gif) 1 molar ratio, DI-mix 1
1 molar ratio, DI-mix 1![[thin space (1/6-em)]](https://www.rsc.org/images/entities/char_2009.gif) :
:![[thin space (1/6-em)]](https://www.rsc.org/images/entities/char_2009.gif) 1) displayed an endothermic peak at 151.6 °C (melting of INA), followed by an exothermic crystallization peak at 156–181 °C (forming DFX–INA co-crystal), and further displayed melting and broad decomposition peaks at the same temperature as those of the DFX–INA co-crystal. Consistent with the PXRD result (Fig. 2(g)), these findings indicate that the DFX–INA co-crystal was crystallized when INA melted in the physical mixture of DFX and INA. The DSC curve of DFX–2INA displayed a desolvation peak over the range of 95–142 °C corresponding to the lost of THF molecule, followed by an endothermic peaks at 149.5 °C belonged to the eutectic melting point of DFX–2INA co-crystal. Subsequently, the INA molecules were decomposed as reflected by the broad peak over the range of 160–200 °C. The TGA results of INA, DFX–INA, DI-mix 1
1) displayed an endothermic peak at 151.6 °C (melting of INA), followed by an exothermic crystallization peak at 156–181 °C (forming DFX–INA co-crystal), and further displayed melting and broad decomposition peaks at the same temperature as those of the DFX–INA co-crystal. Consistent with the PXRD result (Fig. 2(g)), these findings indicate that the DFX–INA co-crystal was crystallized when INA melted in the physical mixture of DFX and INA. The DSC curve of DFX–2INA displayed a desolvation peak over the range of 95–142 °C corresponding to the lost of THF molecule, followed by an endothermic peaks at 149.5 °C belonged to the eutectic melting point of DFX–2INA co-crystal. Subsequently, the INA molecules were decomposed as reflected by the broad peak over the range of 160–200 °C. The TGA results of INA, DFX–INA, DI-mix 1![[thin space (1/6-em)]](https://www.rsc.org/images/entities/char_2009.gif) :
:![[thin space (1/6-em)]](https://www.rsc.org/images/entities/char_2009.gif) 1, and DFX–2INA confirm the above decomposition processes (Fig. S9, ESI†).
1, and DFX–2INA confirm the above decomposition processes (Fig. S9, ESI†).
DFX–H2O, DFX–DMF and DFX–2INA all exhibited desolvation process at about 100 °C, while DFX–INA displayed thermal change until 199 °C. These DSC results illustrated that DFX–INA was more stable than DFX–H2O, DFX–DMF and DFX–2INA during heating.
Stability study of DFX solid forms
The powders of different DFX solid forms were kept at different temperatures and humidity levels to investigate their storage stability. Temperature- and humidity-induced solid-state transition phenomena were observed among the six solid forms of DFX.DFX–H2O was unstable under the six monitored conditions and converted into commercial DFX (Fig. 8). When stored at −20 °C, DFX–H2O showed relatively good stability, only minimal changes at 14.11° and 23.15° (2θ) were observed in PXRD patterns, indicating a trend of transformation into commercial DFX. When the temperature was increased to 4 °C and 40 °C, the characteristic sharp diffraction peaks of DFX–H2O gradually turned into that of DFX with prolonged storage time. This phenomenon illustrated that DFX–H2O was completely transformed into commercial DFX, and the transformation rate increased with increasing temperature. The stability of DFX–H2O was also investigated under three RH levels (32%, 57%, and 75%) at 25 °C. DFX–H2O was transformed into commercial DFX more quickly when stored under a drier environment (Fig. 8(d)–(f)).
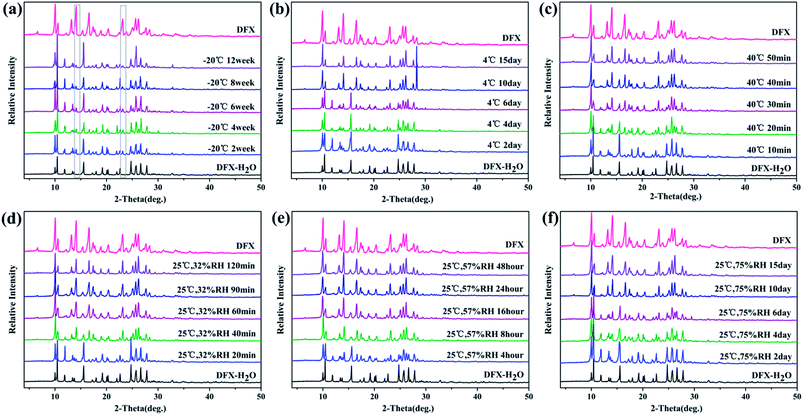 | ||
| Fig. 8 Stability of DFX–H2O monitored with PXRD at (a) −20 °C seal, (b) 4 °C seal, (c) 40 °C seal, (d) 25 °C 32% RH, (e) 25 °C 57% RH, and (f) 25 °C 75% RH. | ||
Fig. 9 shows the stability of DFX–DMF under different temperatures and RH levels. DFX–DMF is relatively stable when stored at −20 °C during 12 weeks, as no change of peaks was observed in DFX–DMF powder patterns (Fig. 9(a)). Nevertheless, when stored at 4 °C, minimal changes gradually appeared in the DFX–DMF powder patterns after 4 weeks. That is, the DFX–DMF was transformed to DFX with a slow conversion rate, and this transformation was not completed until 12 weeks. When the temperature was increased to 40 °C, the DFX–DMF powder patterns showed obvious and rapid changes, the DFX–DMF was completely converted into commercial DFX within 8 h. When stored at 25 °C and 75% RH, DFX–DMF was transformed into DFX–H2O in 3 weeks and yielded commercial DFX after 6 weeks. This conclusion was observed in Fig. 9(f) distinctly. The powder patterns of DFX–DMF placed for 3 weeks and 6 weeks were consistent with the characteristic PXRD pattern of DFX–H2O (pink) and DFX (orange), respectively. When the RH was decreased to 57% or 32% RH, DFX–DMF was directly converted into commercial DFX without DFX–H2O as transition state. Overall, DFX–DMF was rapidly transformed into commercial DFX at high temperatures, and the same conversion process occurred in a drier environment. In high humidity environment, water molecules enter the vacancy in the crystal lattice after the DMF molecules lost to form the metastable DFX–H2O, which was further converted to commercial DFX crystalline state finally.
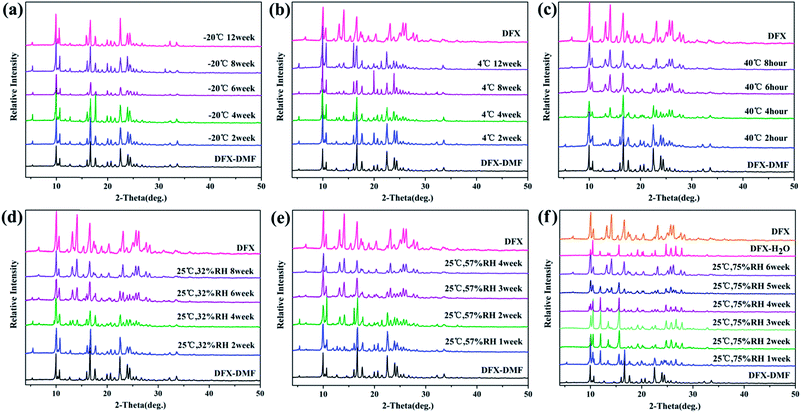 | ||
| Fig. 9 Stability of DFX–DMF monitored with PXRD at (a) −20 °C seal, (b) 4 °C seal, (c) 40 °C seal, (d) 25 °C 32% RH, (e) 25 °C 57% RH, and (f) 25 °C 75% RH. | ||
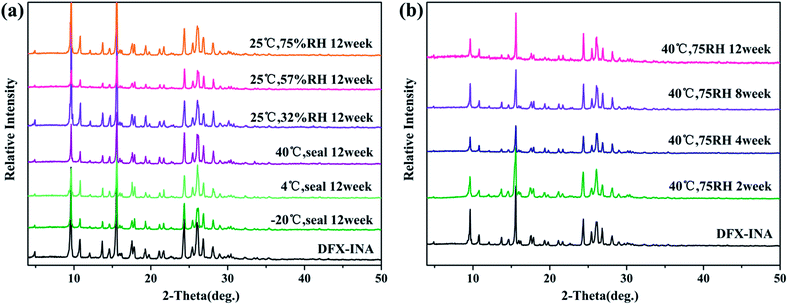
DFX–INA remained stable for 12 weeks not only under the six monitored environment conditions (−20 °C seal, 4 °C seal, 40 °C seal, 25 °C 32% RH, 25 °C 57% RH, and 25 °C 75% RH) but also under the accelerated stability ICH34 conditions of 40 °C and 75% RH. Because no change of sharp diffraction peaks was observed in Fig. 10.
Fig. 11 shows that DFX–2INA was relatively stable when stored in a low-temperature environment (−20 °C) during the entire 12 weeks, as evidenced by the lack of visible changes in PXRD patterns of this solid form. When the temperature was increased to 4 °C and 40 °C, DFX–2INA lost a molecule of INA, generating DFX–INA, and the transformation rate increased with increasing temperature. In comparison with the PXRD pattern of DFX–INA, the product obtained by transformation of DFX–2INA showed cluttered peaks near 23.3° (2θ) because of the lost INA molecule. The stability of DFX–2INA was also investigated under different RH levels (32%, 57%, and 75%) at 25 °C. The result (Fig. 11(d)–(f)) illustrates that DFX–2INA was more quickly converted into DFX–INA when stored in a more humid environment.
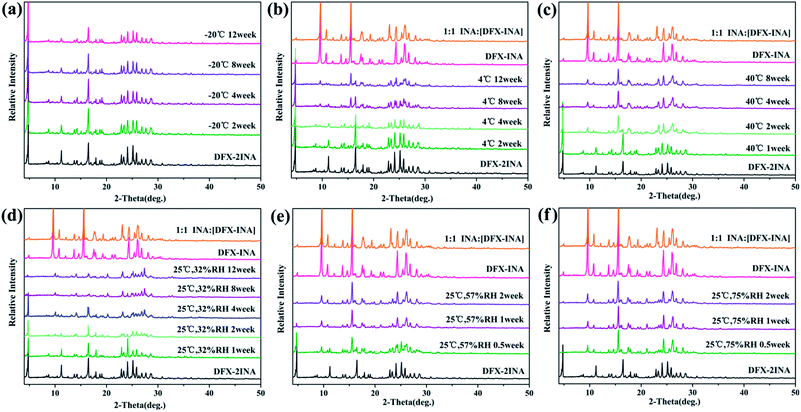 | ||
| Fig. 11 Stability of DFX–2INA monitored with PXRD at (a) −20 °C seal, (b) 4 °C seal, (c) 40 °C seal, (d) 25 °C 32% RH, (e) 25 °C 57% RH, and (f) 25 °C 75% RH. | ||
According to Tg −50 °C rule,37 amorphous DFX can remain stable when stored below 44.4 °C (Tg = 94.4 °C). The experimental result (Fig. 12(a)) show no sharp diffraction peaks appeared with prolonged storage time, indicated that amorphous DFX could remain stable for 6 months even longer at 40 °C and 75% RH, which was consistent with the theoretical analysis. According to the DSC result (Fig. 7(d)), temperature-induced solid-state transitions between amorphous DFX and commercial DFX was further investigated at 150 °C. Fig. 12(b) shows that the solid-state transformation of DFX from amorphous to crystal form was completed within 30 min at 150 °C.
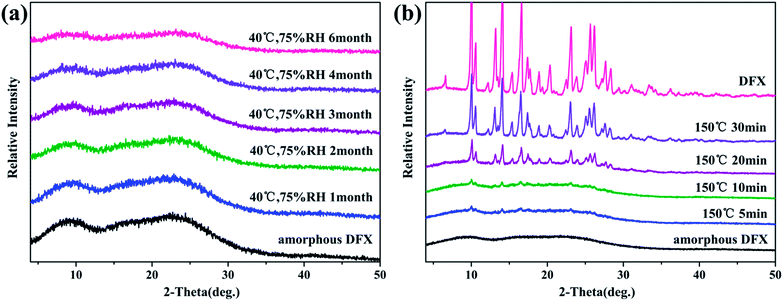 | ||
| Fig. 12 (a) Stability of amorphous DFX monitored with PXRD at 40 °C and 75% RH. (b) Solid-state transitions between the amorphous DFX and commercial DFX at 150 °C. | ||
Consistent with the thermal analyses result, DFX–INA and amorphous DFX were relatively stable under ambient conditions among the above five solid forms.
In vitro dissolution tests
Considering stability, the dissolution characteristics of DFX–INA co-crystal and amorphous DFX were investigated and compared with those of commercial DFX. The dissolution rates and cumulative drug release percentages of the three DFX solid forms were lower in water than those in pH 6.8 PBS (Fig. 13, the detailed data were showed in Table S2 (ESI†)).In PBS (pH 6.8), DFX–INA and amorphous DFX showed a faster dissolution rate than commercial DFX. The cumulative drug release percentages of DFX–INA and amorphous DFX reached 70% within 40 min, whereas that of commercial DFX reached 70% until 240 min. When dissolved in water, amorphous DFX showed a slight advantage in cumulative release percentage. The results of in vitro dissolution tests indicated that DFX–INA and amorphous DFX can be dissolved faster than commercial DFX in PBS medium (pH 6.8) and may be rapidly absorbed by the intestine.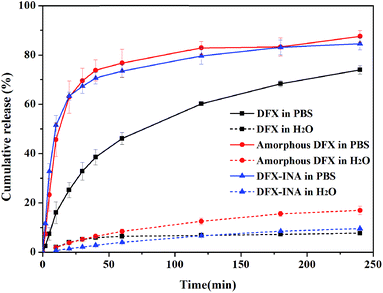 | ||
| Fig. 13 In vitro dissolution profiles of commercial DFX, amorphous DFX and DFX–INA in PBS (pH 6.8) and water (mean ± standard deviation, n = 3). | ||
Commercial DFX is the most stable and consequently have the lowest free energy and a lower solubility. Amorphous drug is a high entropy phase, lacking the long-range order and periodicity characteristic of the crystalline state.15 The high free energy and low density of the amorphous phase mean that amorphous DFX dissolve faster than its crystalline forms (commercial DFX). For DFX–INA, the improvement of dissolution rate may be based on the molecular arrangement of the co-crystal. As shown in Fig. 5 and S5 (ESI†), a layered structure was formed by alternate arrangements of DFX and INA molecules, wherein a column of DFX molecules was sandwiched between two columns of INA molecules. Since INA is more soluble in water, this configuration could improve drug dissolution rate by facilitating contact with the solvent.
Conclusions
Two solvates, two co-crystals, and an amorphous form of DFX were prepared through different methods. The crystal structures of the solvates and co-crystals were determined by SXRD analysis. DFX–H2O, DFX–DMF, DFX–INA, and DFX–2INA were all monoclinic crystal system with space groups of P21/c, P21/c, P21/c, and C2/c, respectively. In different solid forms, the DFX molecule always maintained an S(6) ring motif, and its carboxylic acid moiety easily formed hydrogen bonds with other molecules. Under ambient conditions, DFX–H2O and DFX–DMF easily converted into commercial DFX, and DFX–2INA co-crystal transformed into DFX–INA, DFX–INA and amorphous DFX is relatively stable. Furthermore, DFX–INA and amorphous DFX showed better dissolution characteristic than commercial DFX in PBS medium (pH 6.8). From the viewpoint of drug development, DFX–INA and amorphous DFX exhibit potential as preponderant solid forms of DFX.Conflicts of interest
There are no conflicts to declare.Acknowledgements
This work was supported by the Large-scale Science Instrument Shareable Platform Construction of Sichuan Province (Grant No. 2015JCPT0005-15010102) and the Large-scientific Instruments Sharing Platform Ability Construction of Sichuan Province (Grant No. 2016KJTS0037).References
- C. B. Aakeröy, S. Forbes and J. Desper, CrystEngComm, 2014, 16, 5870–5877 RSC.
- O. D. Putra, D. Umeda, Y. P. Nugraha, T. Furuishi, H. Nagase, K. Fukuzawa, H. Uekusa and E. Yonemochi, CrystEngComm, 2017, 19, 2614–2622 RSC.
- S. Aitipamula, A. B. H. Wong, P. S. Chow and R. B. H. Tan, RSC Adv., 2016, 6, 34110–34119 RSC.
- O. D. Putra, E. Yonemochi and H. Uekusa, Cryst. Growth Des., 2016, 16, 6568–6573 Search PubMed.
- N. R. Goud, R. A. Khan and A. Nangia, CrystEngComm, 2014, 16, 5859–5869 RSC.
- N. R. Goud, K. Suresh and A. Nangia, Cryst. Growth Des., 2013, 13, 1590–1601 CAS.
- T. Rekis, A. Bērziņš, D. Džabijeva, I. Nakurte, L. Orola and A. Actiņš, Cryst. Growth Des., 2017, 17, 1814–1823 CAS.
- T. Stolar, S. Lukin, J. Požar, M. Rubčić, G. M. Day, I. Biljan, D. Š. Jung, G. Horvat, K. Užarević, E. Meštrović and I. Halasz, Cryst. Growth Des., 2016, 16, 3262–3270 CAS.
- V. Jayant and D. Das, Cryst. Growth Des., 2016, 16, 4183–4189 CAS.
- E. Tieger, V. Kiss, G. Pokol, Z. Finta, J. Rohlíček, E. Skořepová and M. Dušek, CrystEngComm, 2016, 18, 9260–9274 RSC.
- A. O. Surov, K. A. Solanko, A. D. Bond, A. Bauer-Brandl and G. L. Perlovich, CrystEngComm, 2015, 17, 4089–4097 RSC.
- M. Oruganti, P. Khade, U. K. Das and D. R. Trivedi, RSC Adv., 2016, 6, 15868–15876 RSC.
- D. Luedeker, R. Gossmann, K. Langer and G. Brunklaus, Cryst. Growth Des., 2016, 16, 3087–3100 CAS.
- K. L. Xu, S. Zheng, L. Guo, S. Li, L. Wang, P. Tang, J. Yan, D. Wu and H. Li, RSC Adv., 2015, 5, 96392–96403 RSC.
- N. J. Babu and A. Nangia, Cryst. Growth Des., 2011, 11, 2662–2679 CAS.
- H. Furuta, S. Mori, Y. Yoshihashi, E. Yonemochi, H. Uekusa, K. Sugano and K. Terada, J. Pharm. Biomed. Anal., 2015, 111, 44–50 CrossRef CAS PubMed.
- R. Galanello, A. Piga, G. L. Forni, Y. Bertrand, M. L. Foschini, E. Bordone, G. Leoni, A. Lavagetto, A. Zappu, F. Longo, H. Maseruka, N. Hewson, R. Sechaud, R. Belleli and D. Alberti, Haematologica, 2006, 91, 1343–1351 CAS.
- M. D. Cappellini, A. Cohen, A. Piga, M. Bejaoui, S. Perrotta, L. Agaoglu, Y. Aydinok, A. Kattamis, Y. Kilinc, J. Porter, M. Capra, R. Galanello, S. Fattoum, G. Drelichman, C. Magnano, M. Verissimo, M. Athanassiou-Metaxa, P. Giardina, A. Kourakli-Symeonidis, G. Janka-Schaub, T. Coates, C. Vermylen, N. Olivieri, I. Thuret, H. Opitz, C. Ressayre-Djaffer, P. Marks and D. Alberti, Blood, 2006, 107, 3455–3462 CrossRef CAS PubMed.
- L. P. H. Yang, S. J. Keam and G. M. Keating, Drugs, 2007, 67, 2211–2230 CrossRef CAS PubMed.
- A. T. Taher, J. Porter, V. Viprakasit, A. Kattamis, S. Chuncharunee, P. Sutcharitchan, N. Siritanaratkul, R. Galanello, Z. Karakas, T. Lawniczek, J. Ros, Y. Zhang, D. Habr and M. D. Cappellini, Blood, 2012, 120, 970–977 CrossRef CAS PubMed.
- A. T. Taher, J. B. Porter, V. Viprakasit, A. Kattamis, S. Chuncharunee, P. Sutcharitchan, N. Siritanaratkul, R. Galanello, Z. Karakas, T. Lawniczek, D. Habr, J. Ros, Z. Zhu and M. D. Cappellini, Ann. Hematol., 2013, 92, 1485–1493 CrossRef PubMed.
- M. Shirley and G. L. Plosker, Drugs, 2014, 74, 1017–1027 CrossRef CAS PubMed.
- C. Reed, A. Ibrahim, J. E. Edwards, I. Walot and B. Spellberg, Antimicrob. Agents Chemother., 2006, 50, 3968–3969 CrossRef PubMed.
- H. C. Boroujeni and F. Gharib, J. Mol. Liq., 2016, 219, 350–353 CrossRef CAS.
- A. Al Durdunji, H. S. AlKhatib and M. Al-Ghazawi, Eur. J. Pharm. Biopharm., 2016, 102, 9–18 CrossRef CAS PubMed.
- S. Steinhauser, U. Heinz, M. Bartholomä, T. Weyhermüller, H. Nick and K. Hegetschweiler, Eur. J. Inorg. Chem., 2004, 2004, 4177–4192 CrossRef.
- H. Fun, S. Chantrapromma, A. S. Dayananda, H. S. Yathirajan and S. Thomas, Acta Crystallogr., Sect. E: Struct. Rep. Online, 2012, 68, 792–793 Search PubMed.
- S. Basavoju, D. Bostrom and S. P. Velaga, Cryst. Growth Des., 2006, 6, 2699–2708 CAS.
- L. Wang, B. Tan, H. Zhang and Z. Deng, Org. Process Res. Dev., 2013, 17, 1413–1418 CrossRef CAS.
- N. B. Báthori, A. Lemmerer, G. A. Venter, S. A. Bourne and M. R. Caira, Cryst. Growth Des., 2011, 11, 75–87 Search PubMed.
- O. V. Dolomanov, L. J. Bourhis, R. J. Gildea, J. A. K. Howard and H. Puschmann, J. Appl. Crystallogr., 2009, 42, 339–341 CrossRef CAS.
- G. M. Sheldrick, Acta Crystallogr., Sect. C: Struct. Chem., 2015, 71, 3–8 CrossRef PubMed.
- T. Lu and C. Chen, Measurement, 2007, 40, 591–599 CrossRef.
- W. H. Organization, in World Health Organization Technical Report Series: Annex 2: Stability testing of active pharmaceutical ingredients and finished pharmaceutical products, 2009, pp. 87–130 Search PubMed.
- M. C. Etter, J. C. MacDonald and J. Bernstein, Acta Crystallogr., Sect. B: Struct. Sci., Cryst. Eng. Mater., 1990, 46, 256–262 CrossRef.
- J. Bernstein, R. E. Davis, L. Shimoni and N. L. Chang, Angew. Chem., Int. Ed. Engl., 1995, 34, 1555–1573 CrossRef CAS.
- L. Yu, Adv. Drug Delivery Rev., 2001, 48, 27–42 CrossRef CAS PubMed.
Footnote |
| † Electronic supplementary information (ESI) available. CCDC 1532021, 1555279, 1527596 and 1527600. For ESI and crystallographic data in CIF or other electronic format see DOI: 10.1039/c7ra08077h |
| This journal is © The Royal Society of Chemistry 2017 |

