
 Open Access Article
 This Open Access Article is licensed under a
 Creative Commons Attribution 3.0 Unported Licence
A new 3D crosslinked polymer strategy for highly efficient oxygen reduction Fe–Nx/C catalysts†
Zonggui Shaoab,
Lei Tongab,
Yasheng Qianab,
Rongmin Dunab and
Wenmu Li *a
*a
aKey Laboratory of Optoelectronic Materials Chemistry and Physics, Fujian Institute of Research on the Structure of Matter, Chinese Academy of Sciences, Fuzhou 350002, P. R. China. E-mail: liwm@fjirsm.ac.cn
bUniversity of Chinese Academy of Sciences, Beijing 100049, China
First published on 10th August 2017
Abstract
The development of non-precious metal (NPM) catalysts with superior performance to replace Pt/C is critical for the wide application of proton-exchange membrane fuel cells. In this work, a three-dimensional crosslinked polymer with highly dispersed iron–nitrogen (Fe–N) coordination units and a mechanically robust framework is designed, synthesized and used as the sole precursor to obtain Fe-coordinated nitrogen-doped carbon (Fe–Nx/C) oxygen reduction reaction (ORR) catalysts. After optimization of the pyrolysis conditions and the use of SiO2 templates to modify the catalyst nanostructure, a highly active catalyst of T-FeNC-800R is obtained, which exhibits a high half-wave potential of 751 mV in 0.1 M HClO4. Besides, the T-FeNC-800R catalyst has an excellent ORR activity with onset and half-wave potentials of 1030 and 873 mV in 0.1 M KOH, respectively, which are higher than those of Pt/C (onset and half-wave potentials are 1009 and 855 mV vs. RHE, respectively). Moreover, this catalyst exhibits an almost four electron transfer process, high long-term stability, and better methanol tolerance than Pt/C catalyst in acidic media. The excellent oxygen reduction reaction performance of T-FeNC-800R can be attributed to the mesoporous structure, high specific surface area and a large number of exposed active sites. Moreover, the effects of the SiO2 template, secondary pyrolysis and iron element on the catalytic performance are systematically discussed.
Introduction
Polymer electrolyte membrane fuel cells (PEMFCs) are considered as one of the most promising new energy systems for future stationary and mobile power generation due to their high energy density, high efficiency and zero emissions.1–4 However, the cathode suffers from relatively sluggish ORR kinetics and therefore high overpotential, which limits the performance of PEMFCs.5 To date, platinum (Pt) or Pt-based catalysts are widely used for cathodic materials owing to having the best catalytic activity for ORR.6 Unfortunately, the prohibitively high cost, poor stability and serious intermediate intolerance, such as CO poisoning and methanol crossover, severely hinders the practical use of PEMFCs.7,8 Therefore, great efforts have been directly devoted to searching for alternative non-precious metals or even metal-free species catalysts to substitute the Pt-based catalysts over the past decades.9–12 Among them, the iron-based (Fe-based) catalysts were regarded as a promising alternative to Pt-based catalysts for the ORR.13–16Although the significant progresses have been persistently achieved in Fe-based electrocatalysts, the inefficiently traditional trial and error experiment approach was still the main ways for the R&D of Fe-based catalysts.8,17 This is because most of high performance Fe-based catalysts obtained were subjected to high temperature pyrolysis, making them extremely difficult to tailor the structure and surface properties, letting alone the identification of the nature of Fe-based catalysts active sites.18 Quite recently, a number of studies have been focused on the identification of the active sites structure of Fe-based catalysts. Although further confirmation is needed, it is reported that the highly plausible active site structures of Fe-based catalysts was the iron ions attaching to the carbon through coordinating with nitrogen moieties.19–22 One possible method to resolve these challenges is to synthesize a novel precursor with a high content of thermally stable nitrogen, and with a structure that can readily coordinate with iron, generating well-distributed Fe-coordinated nitrogen (Fe–Nx) sites prior to pyrolysis. Besides purposely selecting and designing precursors containing large numbers of potential active sites, the optimization of catalyst nanostructure is also critical to obtain highly ORR active Fe–Nx/C catalysts. Efficient ORR can be only achieved by continuously transferring protons, oxygen molecules and electrons to active sites through the favorable percolation networks.23 Herein, the suitable mesoporous structure and high conductivity properties are of significance for their high performance Fe-based catalysts.24 Besides, the mesoporous structure is also helpful to increase the specific surface area of the catalyst and make the active sites accessible to reactants.25,26
In this work, a three-dimensional crosslinked polymer was designed, synthesized and used as the solely precursor. This polymer consists of alternating rigid aromatic imide segments and triphenanthroline-coordinated ferrous ions. The high carbon residue aromatic polyimides are deliberately utilized to keeping all ferrous ions well separated initially, which could effectively prevent ferrous ions form sintering during pyrolysis even under high initial iron content and thus create high active sites density Fe-based catalysts.27–30 In order to further enhance the ORR performance of Fe-based catalysts, SiO2 nanoparticles was introduced as a template to create more favorable mesoporous structure and percolation properties. Highly active mesoporous ORR catalysts were successfully prepared and the influencing factors of catalyst performance were systematically discussed.
Experimental
Synthesis of catalysts
The FeBr2 (98%), 2,2′-bis-(3,4-dicarboxyphenyl) hexafluoropropane dianhydride (6FDA) (98%) and 20 wt% Pt/C were purchased from Alfa Aesar (China) Chemical Co., Ltd. (Shanghai, China); the 1,10-phenanthroline monohydrate (99%) was purchased from Sinopharm Chemical Reagent Co., Ltd. (Shanghai, China) and used without further purification. The 5-nitro-1,10-phenanthroline and 5-amino-1,10-phenanthroline were prepared according to the reported literature.31,32 The bisPhen/6FDA was obtained from the 5-amino-1,10-phenanthroline and 6FDA and the structure of bisPhen/6FDA was verified by H1 NMR (Fig. S1 and S2†).33 The mixture of 15 and 50 nm silicon spheres at the rate of 1![[thin space (1/6-em)]](https://www.rsc.org/images/entities/char_2009.gif) :1 in mass were used for hard template (SiO2). The catalysts were prepared by homogeneously dispersing iron and bisPhen/6FDA precursors onto the surface of SiO2. In a typical synthesis process as shown in Scheme 1, 240 mg (0.3 mmol) bisPhen/6FDA was dissolved in 5 mL DMF and 720 mg of SiO2 was added under magnetic stirring. Then 1 mL DMF solution containing 43 mg (0.2 mmol) FeBr2 was added under stirring conditions, the reaction mixture was heated to 80 °C and was stirred for 1 h. A gel was obtained after cooling and this gel was scraped into water then was crushed, the precipitate was filtered off and washed with water and methanol, then drying under a vacuum at 85 °C for 6 hours. The resulting solid was heat treated under nitrogen at 800 °C for 2 h with temperature ramp rates of 10 °C min−1. Finally, the SiO2 was leached out using excess amounts of 40 wt% hydrofluoric acid (HF) to obtain the T-FeNC-800 catalyst. The T-FeNC-800 catalyst was re-pyrolyzed at 900 °C for 3 hours under a nitrogen atmosphere to form the T-FeNC-800R catalyst (Fig. S4†). The detailed synthesis parameters for each sample prepared in this work was listed in Table S1.†
:1 in mass were used for hard template (SiO2). The catalysts were prepared by homogeneously dispersing iron and bisPhen/6FDA precursors onto the surface of SiO2. In a typical synthesis process as shown in Scheme 1, 240 mg (0.3 mmol) bisPhen/6FDA was dissolved in 5 mL DMF and 720 mg of SiO2 was added under magnetic stirring. Then 1 mL DMF solution containing 43 mg (0.2 mmol) FeBr2 was added under stirring conditions, the reaction mixture was heated to 80 °C and was stirred for 1 h. A gel was obtained after cooling and this gel was scraped into water then was crushed, the precipitate was filtered off and washed with water and methanol, then drying under a vacuum at 85 °C for 6 hours. The resulting solid was heat treated under nitrogen at 800 °C for 2 h with temperature ramp rates of 10 °C min−1. Finally, the SiO2 was leached out using excess amounts of 40 wt% hydrofluoric acid (HF) to obtain the T-FeNC-800 catalyst. The T-FeNC-800 catalyst was re-pyrolyzed at 900 °C for 3 hours under a nitrogen atmosphere to form the T-FeNC-800R catalyst (Fig. S4†). The detailed synthesis parameters for each sample prepared in this work was listed in Table S1.†
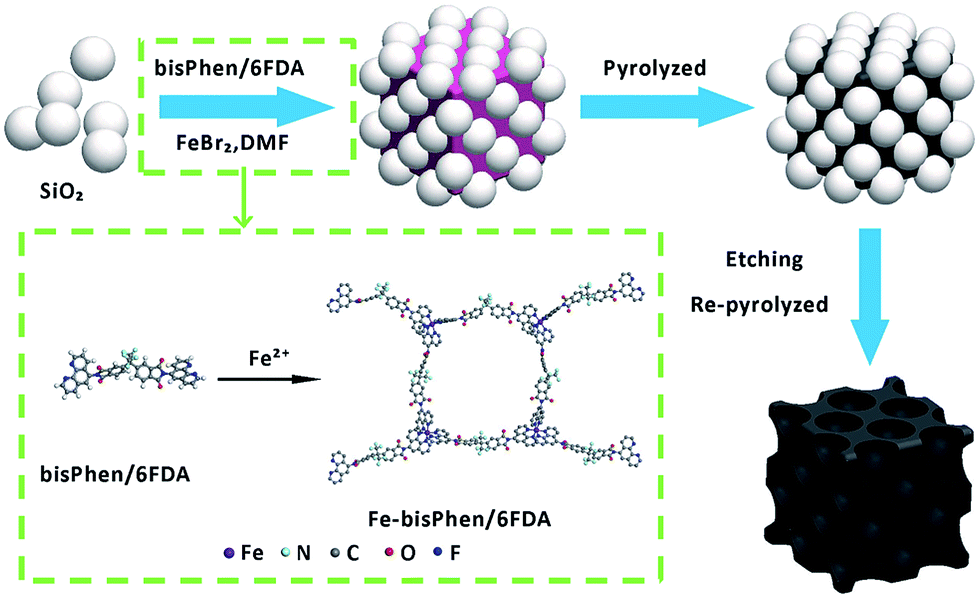 | ||
| Scheme 1 The schematic illustration of the synthesis of mesoporous FeNC catalyst. | ||
Sample characterization
The proton nuclear magnetic resonance (1H NMR) spectra was recorded on a 400 MHz spectrometer. The thermogravimetric (TG) analysis of Fe-bisPhen/6FDA and Fe-phenanthroline was carried out in a range from 30–1000 °C under nitrogen atmosphere with a heating rate of 10 °C min−1. Transmission election microscopy (TEM) was performed using a JEM-2010 (JEOL Ltd, Japan) operating at 200 kV. The Brunauer–Emmett–Teller (BET) method was used to determine the specific surface area by measuring the adsorption of N2 using an ASAP2020 volumetric adsorption analyzer (Micromeritics, U.S.A.). The specific surface area was determined by the standard BET method in a relative pressure range of 0.05–0.2, the pore size distribution curves of micropores and mesopores was calculated by the Horvath–Kawazoe (HK) method and by the Barrett–Joyner–Halenda (BJH) method, respectively. Before measurements, all samples were degassed at 120 °C for at least 10 h. Raman spectra was collected on a LabRAM HR (Horiba Jobin Yvon, Ltd., France) with a 532 nm laser excitation. Surface analysis of the catalyst particles was carried out using an XPS on a VG Scientific ESCALAB MK II using Al Kα radiation (1486.71 eV) and the C 1s peak at 284.8 eV as the internal standard. Powder X-ray diffraction (XRD) patterns were performed with a MiniFlex-II diffractometer (Rigaku, Japan) using a Cu Kα radiation source.Electrochemical measurements
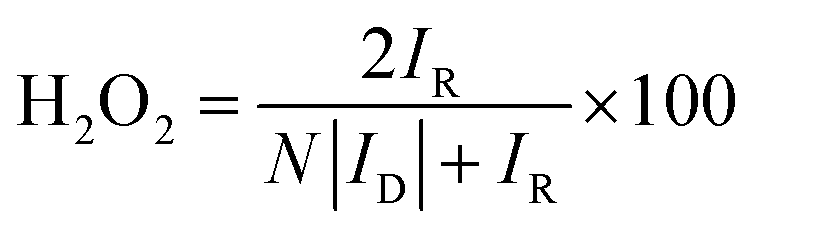
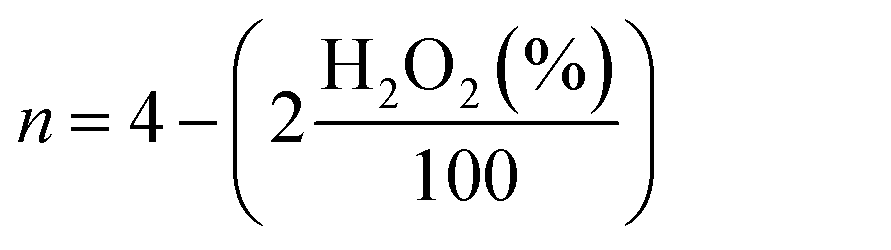
For rotating disk electrode (RDE) and rotating ring disk electrode (RRDE) measurements, catalyst ink was prepared by sonicating 4 mg of catalyst in 985 μL of ethanol and 38 μL of 5 wt% Nafion solution for 60 min. Then, 20 μL of ink was deposited on the rotating disk electrode (RDE, 5 mm diameter, 0.196 cm2 geometric surface areas) and 25 μL of ink was deposited on the rotating ring-disk electrode (RRDE, E7R9, disk area: 0.2475 cm2, Pt ring area: 0.1866 cm2), respectively. The catalyst loading on RDE or RRDE was 0.4 mg cm−2. Commercially available Pt/C catalyst (Alfa Aesar, 20 wt% Pt) was measured for comparison. 4 mg Pt/C was dispersed in 2 mL ethanol and 38 μL of 5 wt% Nafion solution and then sonicated for 60 min, and the ink was drop coated onto the glassy carbon disk of RDE (10 μL) and RRDE (12.5 μL). The Pt/C catalyst loading on RDE or RRDE was 20 μg Pt cm−2. A conventional three-electrode cell was employed incorporating an Ag/AgCl as the reference electrode, a Pt wire as the counter electrode and the RDE or RRDE as the working electrode, the electrolyte was 0.1 M HClO4 solution. In all test results, the potentials were converted to values versus the reversible hydrogen electrode (RHE). The conversion from Ag/AgCl to RHE is done by measuring the voltage ΔE between the Ag/AgCl and a Pt-black coated Pt wire immersed in 0.1 M HClO4 or 0.1 M KOH saturated with H2, the measured ΔE was 0.267 V in 0.1 M HClO4 and 0.94 V in 0.1 M KOH, respectively (Fig. S5 and S6†). LSV measurements were carried out in N2- or O2-saturated 0.1 HClO4 or 0.1 M KOH solution, at a scan rate of 10 mV s−1. LSV measurements in the RRDE were carried out in N2- or O2-saturated 0.1 HClO4 solution at a scan rate of 10 mV s−1 also, a potential of the Pt ring disk was set to 1.2 V vs. RHE. Before each measurement, the solution was bubbled with N2 or O2 gas for 30 min, and the working electrode was activated by sweeping between 0.2 and 1.4 V at a scan rate of 50 mV s−1 for 10 min. Corrected oxygen reduction currents were obtained by subtracting the background current obtained for the N2-saturated solution from the measured current obtained for the O2-saturated solution. For the methanol crossover study, the current was recorded at 0.667 V vs. RHE with an RDE rotation rate of 900 rpm, with 1 M methanol being added into the O2-saturated electrolyte around 300 s. The lifetime stability test was carried out with 10000 cycles in the potential window of 0.6 to 1.0 V vs. RHE in O2-saturated electrolyte with the scan rate of 50 mV s−1 on stationary electrode. After performing 10000 stability test cycles, corresponding LSV was recorded to compare the final activity with initial activity of the samples. For this purpose, the E1/2 before and after the stability test were compared. The hydrogen peroxide yield (H2O2 (%)) and the electron transfer number (n) calculated from the RRDE measurement was based on the disk current (ID) and ring current (IR) via the following equation:
 | (1) |
 | (2) |
Results and discussion
The T-FeNC-800R catalyst was synthesized by mixing the Fe-bisPhen/6FDA and spherical silica template in solution, followed by heat treating at 800 °C, hydrofluoric acid (HF) etching, and a second heat treating at 900 °C (Scheme 1). The microscopic structure of T-FeNC-800R was evaluated by transmission election microscopy (TEM) as shown in Fig. 1. Some disordered spherical mesopores were clearly observed in the T-FeNC-800R (Fig. 1b). This is a result of the vacation of silica during HF etching. As shown in Fig. 1c, most graphite nanosheets were crimped and arranged irregularly, suggesting the poor crystallization of the carbon frameworks in the resulting products. Furthermore, the selected-area electron diffraction (SAED) pattern in the Fig. 1d also confirmed the poor graphite crystallinity of T-FeNC-800R.34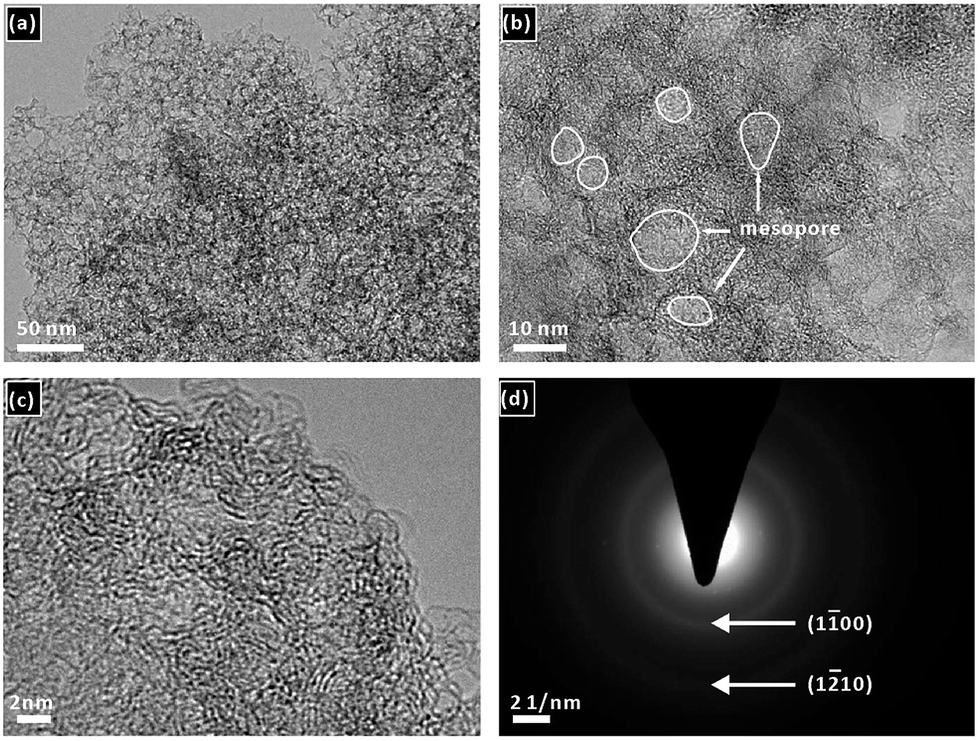 | ||
| Fig. 1 (a) and (b) TEM and (c) HRTEM images of T-FeNC-800R; (d) the electron diffraction pattern of T-FeNC-800R. | ||
In order to reveal the effect of secondary pyrolysis and silicon template on the activity of the catalyst, we also prepared FeNC-800R (without template) and T-FeNC-800 (use template but undergoes only one pyrolysis at 800 °C). The X-ray diffraction (XRD) patterns and Raman spectroscopy were performed to determine the crystal structure of our catalysts (Fig. S7 and S8†). The peaks around 2θ = 26° assigning to (002) diffraction peaks of graphitic carbons and the peak at 44° corresponding to (100) plane of graphitic carbon.35 As shown in Fig. S7,† both catalysts (T-FeNC-800 and T-FeNC-800R) prepared with silicon template exhibited much lower intensity of (002) and (100) peaks than those of FeNC-800R prepared without template, which indicated that the introduction of silicon template can hinder the graphitization in the whole structure of the catalyst. Moreover, this conclusion can also be verified by the analysis of Raman spectroscopy. The ratio of the D and G band intensities (ID/IG) in Raman spectroscopy was often used to evaluating the degree of graphitization of carbon frameworks, the higher the ratio of ID/IG, the smaller the degree of graphitization.36 As Fig. S8† showed, two prominent peaks corresponding to the D band (about 1360.0 cm−1) and G band (about 1584.9 cm−1) were observed in these samples. FeNC-800R (1.41) exhibited a much smaller ID/IG value than T-FeNC-800R (3.00) and T-FeNC-800 (3.13), which can jump to the same conclusion as that of XRD.
The nitrogen sorption measurements were performed to investigate the specific surface area and pore size of the catalysts. The N2 adsorption/desorption isotherm and pore size distribution from the Barrett–Joyner–Halenda (BJH) model were shown in Fig. 2a and b, respectively. It's worth noting that FeNC-800R without any template display a near 390 m2 g−1 high specific surface area. Meanwhile, the typical mesoporous property was also observed in FeNC-800R according to its feature of type IV isotherm (Fig. 2a).37 In fact, this decent nanostructure of FeNC-800R can be solely attributed to the special structure of our designed precursor. On the one hand, the three-dimensional crosslinked polymer itself has the porous property. On the other hand, the trifluoromethyl groups in the structure of our precursor may decomposed at high temperature to form gas fluoride molecules thus to create more specific surface area. However, both the drying procedure of precursor from a gel state to a powder state (Fig. S4†) and the subsequent pyrolysis treatment of the powder were suspected to break the pore structure of the precursor. This resulted in limiting the mesoporous volume (0.357 cm3 g−1) and distribution (average pore size of 3.82 nm) of FeNC-800R. Both T-FeNC-800 and T-FeNC-800R showed much more favorable nanostructure than that of FeNC-800R, which clearly demonstrated the positive effects of nano silica template. Although the mesoporous volume and pore size of T-FeNC-800R are slight lower relative to T-FeNC-800 (Table S2†), the microporous specific surface area and content of T-FeNC-800R increases after second pyrolysis. This is due to the partial collapsing of mesopores and the volatilization of some small molecules (such as CxNy, NOx, CO2, CHx, etc.) during the second pyrolysis process.38
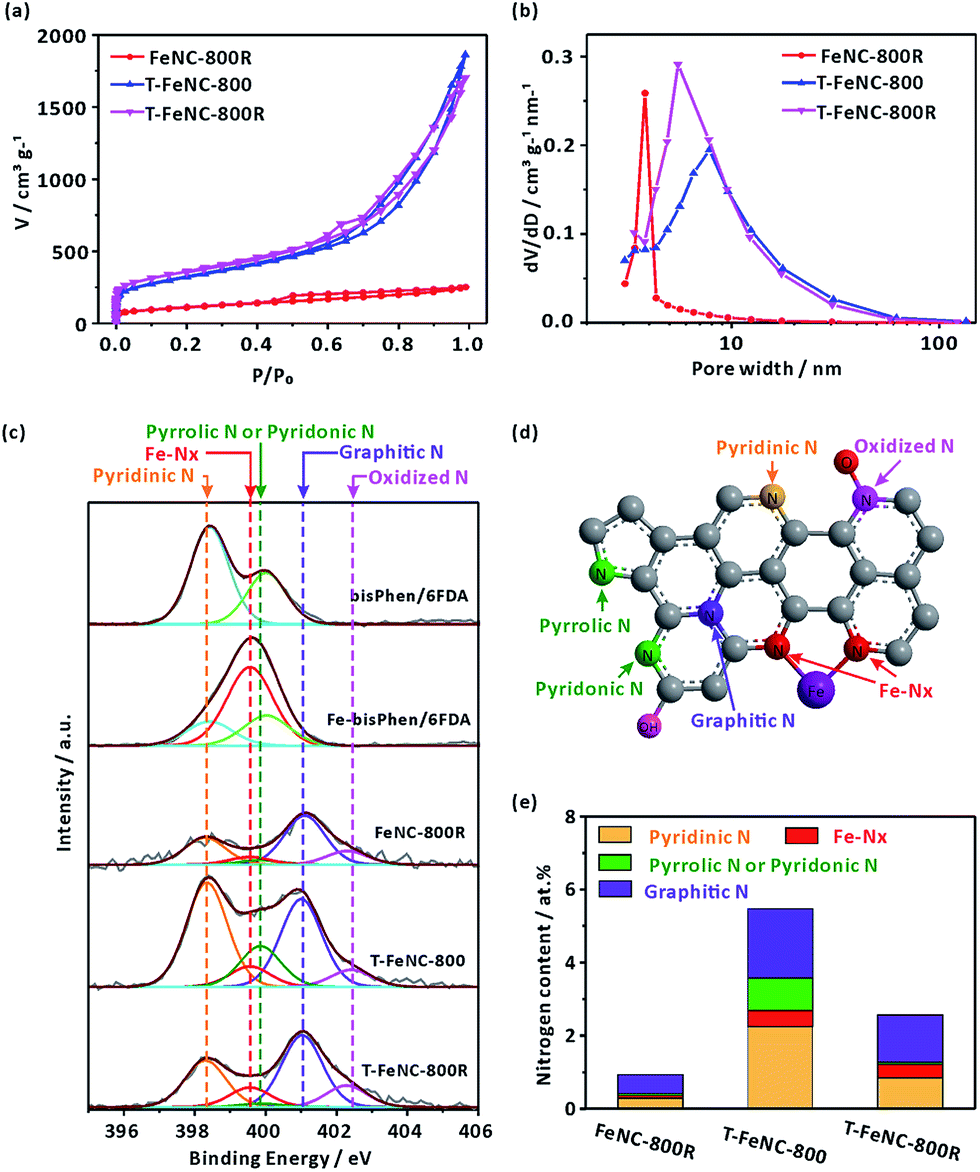 | ||
| Fig. 2 (a) N2 adsorption–desorption isotherms and (b) the pore size distribution of catalysts. (c) N 1s XPS spectra of different sample. (d) Schematic illustration of different nitrogen species. (e) Content of different N species in FeNC-800R, T-FeNC-800 and T-FeNC-800R. | ||
X-ray photoelectron spectroscopy (XPS) measurement was performed to analyze the elemental compositions of the catalysts (Table S3†). It's interesting that the nitrogen content of the FeNC-800R is as low as 1.09%, which is much lower than that of T-FeNC-800 (5.52%) and T-FeNC-800R (2.97%). There are a number of factors that should be responsible for this result, and the low porosity of FeNC-800R is the most important one, which can't expose enough specific surface area and nitrogen for the XPS detection. To further explore how the Fe-based preparing procedures affect the evolution of nitrogen, the high-resolution N 1s spectra of catalysts was performed. The bisPhen/6FDA and Fe-bisPhen/6FDA monomers were utilized as model compounds to verify the binding energy of iron-nitrogen coordination (Fe–Nx). The N 1s curve of bisPhen/6FDA patently showed two peaks at 398.42 and 400.02 eV (Fig. 2c), which was ascribed to two distinct nitrogen bonding environments (Fig. S11a†). Accordingly, the N 1s curve of Fe-bisPhen/6FDA could be divided into three peaks at 398.42, 399.56 and 400.02 eV, which are assignable to three distinct nitrogen bonding environments (Fig. S11b†). By comparing the N 1s curve of bisPhen/6FDA and Fe-bisPhen/6FDA, the peak at 399.56 eV of Fe-bisPhen/6FDA could be safely assigned to the pyridinic nitrogens directly attaching to ferrous ions (Fe–Nx) (Fig. S11b†).20 The high-resolution N 1s spectra of catalysts could be deconvoluted into five peaks, which corresponded to pyridinic N (398.30 eV), Fe–Nx (399.56 eV), pyrrolic N or pyridonic N (399.85 eV), graphitic N (401.03 eV) and oxidized N (402–403 eV), respectively (Fig. 2d).12,28,39 All types nitrogen in T-FeNC-800R decreased comparing to those of T-FeNC-800 after the second pyrolysis (Fig. 2e). Especially, the signal assignable to pyrrolic N or pyridonic N of catalyst T-FeNC-800R was hardly observed. Two peaks 710.9 and 713.2 eV assignable to the N-coordinated Fe2+ and Fe3+ species were also observed in the corresponding Fe 2p XPS spectra (Fig. S12†), which clearly showed the presence of Fe in the catalysts.40
The ORR activity of prepared catalysts was assessed using rotating disk electrode (RDE) in 0.1 M HClO4 solution. The optimum pyrolysis condition for ORR activity was studied by only changing pyrolysis temperatures, SiO2 template, and second pyrolysis at 900 °C. The best ORR Fe-based catalysts were realized at the first pyrolysis temperature of 800 °C and the second pyrolysis temperature of 900 °C (Fig. S13†). The structure feature of the precursor made FeNC-800R exhibit the characteristic of mesoporous materials, but the limited percolation channels which is not favor in increasing its ORR activity (E1/2 = 624 mV vs. RHE) (Fig. 3a). As Fig. 3a showed, the ORR activity only enhance 4 mV from catalyst FeNC-800R to T-FeNC-800 after the introduction of silica template, though their BET surface area increase from FeNC-800R (390 m2 g−1) to T-FeNC-800 (1135 m2 g−1). This strongly indicated that the ORR activity of Fe-based catalysts could not be enhanced simply by increasing their surface area and the nitrogen content. To further improving the ORR activity of our Fe-based catalysts, the second pyrolysis procedure was introduced. The T-FeNC-800R exhibited a 123 mV half-wave potential increase to 751 mV vs. RHE comparing to T-FeNC-800, and only 31 mV negative than that of Pt/C (E1/2 = 782 mV vs. RHE). Moreover, when switching to the alkaline media, the E1/2 and Eonset of T-FeNC-800R were 873 mV and 1030 mV, respectively, both of which higher than those of Pt/C (E1/2 = 855 mV and Eonset = 1009 mV vs. RHE) (Fig. 3a). This excellent result was also comparable to other non-precious catalysts (Table S4†). The significant improvement of the T-FeNC-800R's ORR activity may be attributed to the increasing of the density of highly active Fe–Nx sites and the purity of Fe-based catalyst. Although the exact chemical structure of Fe-based catalysts' active sites is still an unsolved puzzle, it's well document that highly active sites of Fe-based catalysts derived mainly from the micropores.25,41,42 Indeed, the specific surface area of T-FeNC-800R's micropores are almost double after second pyrolysis comparing to T-FeNC-800 (Table S2†), though the content of nitrogen assignable to the Fe–Nx decreased from 0.45% to 0.36% (Table S3†). The purity of Fe-based catalysts is also a key factor to affect their ORR activity. Our catalysts system should be very complicated since all of them resorted to high temperature pyrolysis. However, they should contain the highly active Fe–Nx/C species and the active N species at least (Fig. 3c). Some nitrogen active species may attach to a very small fragment of graphene sheet, which may be dissolvable in acid solution. These dissolvable nitrogen containing small fragments NxCy may further react with highly active Fe–Nx/C species and disable them to ORR under the acid leaching condition. To prove our assumption, 1,10-phenanthroline (Phen) was used as a model compound to test how the soluble nitrogen containing fragment affects the ORR activity of Fe-based catalysts. The Phen test was performed by the method of the LSV without and with adding 1 mM Phen to 0.1 M HClO4. The E1/2 of T-FeNC-800R catalyst negatively shifted by 43 mV after the adding of 1 mM Phen. However, the ORR activity of T-FeNC-800R didn't recovered even after the catalyst was multiply washed with de-ions water to remove Phen (Fig. 3b). This clearly demonstrated the destructive effect of nitrogen containing impurity for the ORR. The second pyrolysis which can remove ORR inactive impurities (CxNy, C–F, Fe–F, N–O, etc.), recover the possible Fe–Nx/C active sites, and clean the electrochemical interface leading to more ORR active sites, may contribute the increase of the ORR activity.38,43 In fact, the almost disappearance of deconvolution signal assignable to the low or inactive pyrrolic and pyridonic N of T-FeNC-800R after the second pyrolysis (Fig. 2e),12 clearly demonstrated the importance and necessity of second pyrolysis.
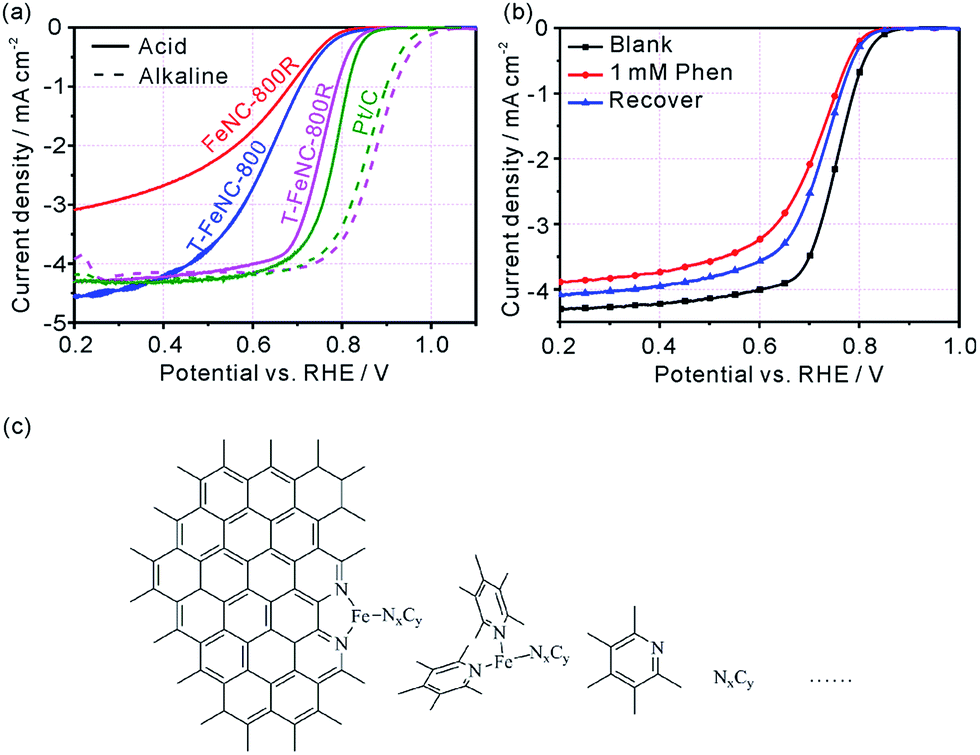 | ||
| Fig. 3 (a) RDE results of FeNC-800R, T-FeNC-800, T-FeNC-800R and Pt/C in O2-saturated 0.1 M HClO4 (full line) and 0.1 M KOH (imaginary line) at 900 rpm with a scan rate of 10 mV s−1. (b) RDE results (in O2-saturated 0.1 M HClO4 at 900 rpm, with a scan rate of 10 mV s−1) of T-FeNC-800R (without and with 1,10-phenanthroline). (c) Schematic illustration of the highly active Fe–Nx/C species and possible nitrogen containing small fragments. | ||
In order to further identify the true active species of our catalysts, the T-NC-800R catalyst without any iron ions was prepared according to the same synthetic procedure of T-FeNC-800R. The ORR activity of T-NC-800R is much worse than that of T-FeNC-800R (Fig. 4a), though it possessed comparable high microporous specific surface areas and N content to the T-FeNC-800R (Tables S2 and S3†). The only different between the T-NC-800R and T-FeNC-800R is the possible highly active Fe–Nx species (Fig. 4b).
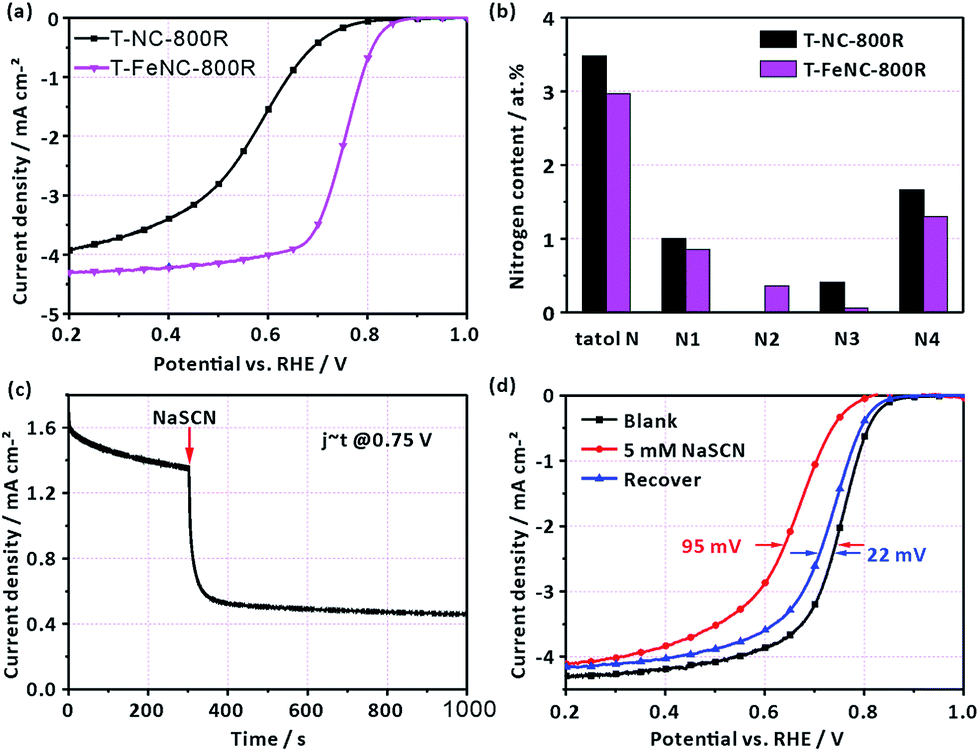 | ||
| Fig. 4 (a) RDE results (in O2-saturated 0.1 M HClO4 at 900 rpm, with a scan rate of 10 mV s−1) of T-NC-800R and T-FeNC-800R. (b) Content of total N, pyridinic N (N1), Fe–Nx (N2), pyrrolic N or pyridonic N (N3), graphitic N (N4) in T-NC-800R and T-FeNC-800R. (c) Current–time (I–t) curves of T-FeNC-800R on a rotating disk electrode (900 rpm) in O2-saturated 0.1 M HClO4 solution (without and with SCN−). (d) RDE results (in O2-saturated 0.1 M HClO4 at 900 rpm, with a scan rate of 10 mV s−1) of T-FeNC-800R (without and with SCN−). | ||
To confirm the importance of Fe–Nx species for the ORR, an electrochemical poisoning test by NaSCN was also conducted.42–47 A sharp current density decrease was observed at 0.75 V after the adding 5 mM SCN− into the electrolyte (Fig. 4c). The corresponding LSV of T-FeNC-800R also exhibited a 95 mV E1/2 negatively shift. Besides, almost complete ORR activity recovery was observed after the complete removing of SCN− ions (Fig. 4d). These results combined with XPS analysis strongly suggested that Fe–Nx species are the highly active sites in the Fe-based catalysts.
To better understand the electrochemical catalytic behavior of T-FeNC-800R, its Tafel slope was calculated (Fig. 5a). It's obvious that a similar Tafel slope was observed for T-FeNC-800R (54 mV per decade) and Pt/C (52 mV per decade). This means that the transfer of the first electron was probably the rate-determining step in ORR catalyzed by T-FeNC-800R, which is similar to platinum-based materials.9 Furthermore, the H2O2 yield and electron transfer number (n) have also been calculated by results of RRDE test (the potential of the Pt ring electrode was set to 1.2 V vs. RHE). It could be seen from Fig. 5b that the peroxide species yield of T-FeNC-800R was less than 7.58% and the electron-transfer number (n) was higher than 3.85 in the measured potential range from 0.2 to 0.8 V, which is close to the value of Pt (2.35% and 3.96, respectively), suggesting the four electron pathway of the ORR process for the T-FeNC-800R catalyst. The tolerance to methanol crossover and the stability of the catalyst material are also important parameters to be evaluated. The methanol-tolerance test was performed by the method of current–time (I–t) plots with adding 1 M methanol to 0.1 M HClO4 after about 300 s (at a potential of 0.667 V vs. RHE). Like most of NPCs, the T-FeNC-800R clearly exhibits much better methanol-tolerance ability than that of Pt/C. The ORR stability of T-FeNC-800R was tested with 10000 cycles in the potential window of 0.6 to 1.0 V vs. RHE at the scan rate of 50 mV s−1 on stationary electrode. After performing 10000 stability test cycles, the E1/2 of T-FeNC-800R exhibited a 61 mV negative potential shift, similar to the Pt/C (62 mV) (Fig. 5d), which suggested that the stability of the T-FeNC-800R was comparable to the Pt/C.
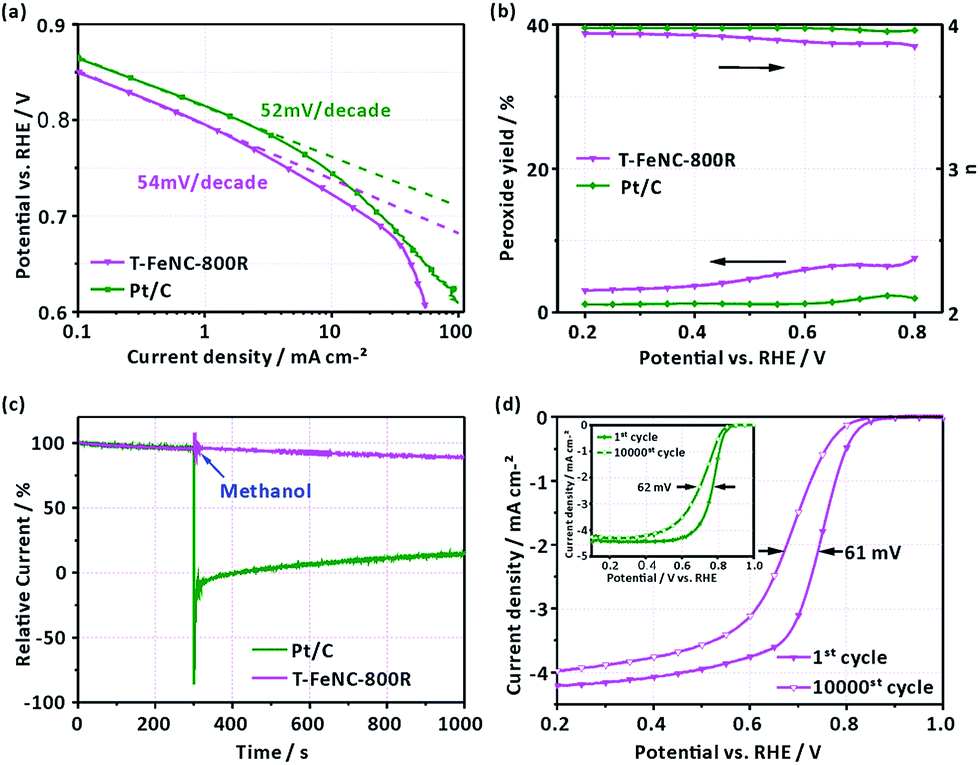 | ||
| Fig. 5 (a) Tafel plots of T-FeNC-800R and Pt/C obtained from the RDE measurements. (b) H2O2 yield and electron-transfer number (n) of T-FeNC-800R and Pt/C. (c) Current–time (I–t) curves of T-FeNC-800R and Pt/C in O2-saturated 0.1 M HClO4 solution (without and with 1 M methanol). (d) LSV of T-FeNC-800R and Pt/C (inset) before and after 10000 cycles in O2-saturated 0.1 M HClO4 solution. All tests on a rotating disk electrode (900 rpm) with a scan rate of 10 mV s−1. | ||
Conclusion
In this work, we have developed a high ORR active catalyst by pyrolysis the complex of Fe and bisPhen/6FDA using the SiO2 nanoparticles as template. The pyrolysis temperature largely affected the ORR activity, and the optimal catalyst T-FeNC-800R pyrolyzed at 800 °C exhibited an excellent ORR activity under both alkaline and acidic conditions. The SiO2 template played an important role on improving ORR activity via increasing the exposure of active sites of Fe-based catalysts and decreasing the diffusion resistance of ORR-relevant species (such as O2 and H2O). The second pyrolysis after HF leaching was also an important step to achieve high ORR performance. Moreover, compare with the commercial Pt/C, the T-FeNC-800R exhibited similar stability and much better methanol tolerance in acidic media. As a result, our as-prepared T-FeNC-800R catalyst is a potentially viable alternative to precious Pt/C catalyst in PEMFCs with high ORR performance and superior stability.Acknowledgements
The authors gratefully acknowledge the financial support of the 100-Talent Program of Chinese Academy of Sciences, the NSFC (Project No. 21303206).References
- S. Guo, S. Zhang and S. Sun, Angew. Chem., Int. Ed., 2013, 52, 8526–8544 CrossRef CAS PubMed.
- R. Borup, J. Meyers, B. Pivovar, Y. S. Kim, R. Mukundan, N. Garland, D. Myers, M. Wilson, F. Garzon, D. Wood, P. Zelenay, K. More, K. Stroh, T. Zawodzinski, J. Boncella, J. E. McGrath, M. Inaba, K. Miyatake, M. Hori, K. Ota, Z. Ogumi, S. Miyata, A. Nishikata, Z. Siroma, Y. Uchimoto, K. Yasuda, K.-i. Kimijima and N. Iwashita, Chem. Rev., 2007, 107, 3904–3951 CrossRef CAS PubMed.
- F. Jaouen, E. Proietti, M. Lefevre, R. Chenitz, J.-P. Dodelet, G. Wu, H. T. Chung, C. M. Johnston and P. Zelenay, Energy Environ. Sci., 2011, 4, 114–130 CAS.
- A. Morozan, B. Jousselme and S. Palacin, Energy Environ. Sci., 2011, 4, 1238 CAS.
- W. Xia, A. Mahmood, Z. Liang, R. Zou and S. Guo, Angew. Chem., Int. Ed., 2016, 55, 2650–2676 CrossRef CAS PubMed.
- B. C. H. Steele and A. Heinzel, Nature, 2001, 414, 345–352 CrossRef CAS PubMed.
- M. Shao, Q. Chang, J.-P. Dodelet and R. Chenitz, Chem. Rev., 2016, 116, 3594–3657 CrossRef CAS PubMed.
- G. Wu, K. L. More, C. M. Johnston and P. Zelenay, Science, 2011, 332, 443–447 CrossRef CAS PubMed.
- Y. Hu, J. O. Jensen, W. Zhang, L. N. Cleemann, W. Xing, N. J. Bjerrum and Q. Li, Angew. Chem., Int. Ed., 2014, 53, 3675–3679 CrossRef CAS PubMed.
- S. Guo and S. Sun, J. Am. Chem. Soc., 2012, 134, 2492–2495 CrossRef CAS PubMed.
- W. Wang, J. Luo, W. Chen, J. Li, W. Xing and S. Chen, J. Mater. Chem. A, 2016, 4, 12768–12773 CAS.
- D. Guo, R. Shibuya, C. Akiba, S. Saji, T. Kondo and J. Nakamura, Science, 2016, 351, 361–365 CrossRef CAS PubMed.
- Z. Chen, D. Higgins, A. Yu, L. Zhang and J. Zhang, Energy Environ. Sci., 2011, 4, 3167–3192 CAS.
- A. Serov, K. Artyushkova and P. Atanassov, Adv. Energy Mater., 2014, 4, 1301735 CrossRef.
- M. Zhou, C. Yang and K.-Y. Chan, Adv. Energy Mater., 2014, 4, 1400840 CrossRef.
- Z. K. Yang, Z.-W. Zhao, K. Liang, X. Zhou, C.-C. Shen, Y.-N. Liu, X. Wang and A.-W. Xu, J. Mater. Chem. A, 2016, 4, 19037–19044 CAS.
- A. Zitolo, V. Goellner, V. Armel, M.-T. Sougrati, T. Mineva, L. Stievano, E. Fonda and F. Jaouen, Nat. Mater., 2015, 14, 937–942 CrossRef CAS PubMed.
- F. Jaouen, S. Marcotte, J. P. Dodelet and G. Lindbergh, J. Mater. Chem. B, 2003, 107, 1376–1386 CAS.
- N. Ramaswamy, U. Tylus, Q. Jia and S. Mukerjee, J. Am. Chem. Soc., 2013, 135, 15443–15449 CrossRef CAS PubMed.
- M. Lefevre, E. Proietti, F. Jaouen and J. P. Dodelet, Science, 2009, 324, 71–74 CrossRef CAS PubMed.
- W.-J. Jiang, L. Gu, L. Li, Y. Zhang, X. Zhang, L.-J. Zhang, J.-Q. Wang, J.-S. Hu, Z. Wei and L.-J. Wan, J. Am. Chem. Soc., 2016, 138, 3570–3578 CrossRef CAS PubMed.
- J. Masa, W. Xia, M. Muhler and W. Schuhmann, Angew. Chem., Int. Ed., 2015, 54, 10102–10120 CrossRef CAS PubMed.
- M. Eikerling, A. A. Kornyshev and A. R. Kucernak, Phys. Today, 2006, 59, 38–44 CrossRef CAS.
- Z. Xia, L. An, P. Chen and D. Xia, Adv. Energy Mater., 2016, 6, 1600458 CrossRef.
- H.-W. Liang, X. Zhuang, S. Bruller, X. Feng and K. Mullen, Nat. Commun., 2014, 5, 4973 CrossRef CAS PubMed.
- H.-W. Liang, W. Wei, Z.-S. Wu, X. Feng and K. Muellen, J. Am. Chem. Soc., 2013, 135, 16002–16005 CrossRef CAS PubMed.
- Y. Wang, A. Kong, X. Chen, Q. Lin and P. Feng, ACS Catal., 2015, 5, 3887–3893 CrossRef CAS.
- L. Lin, Q. Zhu and A.-W. Xu, J. Am. Chem. Soc., 2014, 136, 11027–11033 CrossRef CAS PubMed.
- L. Lin, Z. K. Yang, Y.-F. Jiang and A.-W. Xu, ACS Catal., 2016, 6, 4449–4454 CrossRef CAS.
- Z. K. Yang, L. Lin and A.-W. Xu, Small, 2016, 12, 5710–5719 CrossRef CAS PubMed.
- S. Ji, H. Guo, X. Yuan, X. Li, H. Ding, P. Gao, C. Zhao, W. Wu, W. Wu and J. Zhao, Org. Lett., 2010, 12, 2876–2879 CrossRef CAS PubMed.
- S. J. Lee, S. S. Lee, M. S. Lah, J.-M. Hong and J. H. Jung, Chem. Commun., 2006, 4539–4541 RSC.
- W. Li, G. Chen, S. Zhang, H. Wang and D. Yan, J. Polym. Sci., Part A: Polym. Chem., 2007, 45, 3550–3561 CrossRef CAS.
- J. Jin, F. Pan, L. Jiang, X. Fu, A. Liang, Z. Wei, J. Zhang and G. Sun, ACS Nano, 2014, 8, 3313–3321 CrossRef CAS PubMed.
- L. Zhao, Y. Wang and W. Li, RSC Adv., 2016, 6, 90076–90081 RSC.
- J. Xue, L. Zhao, Z. Dou, Y. Yang, Y. Guan, Z. Zhu and L. Cui, RSC Adv., 2016, 6, 110820–110830 RSC.
- A. Kong, X. Zhu, Z. Han, Y. Yu, Y. Zhang, B. Dong and Y. Shan, ACS Catal., 2014, 4, 1793–1800 CrossRef CAS.
- J. Shi, X. Zhou, P. Xu, J. Qiao, Z. Chen and Y. Liu, Electrochim. Acta, 2014, 145, 259–269 CrossRef CAS.
- D. Shin, B. Jeong, B. S. Mun, H. Jeon, H.-J. Shin, J. Baik and J. Lee, J. Phys. Chem. C, 2013, 117, 11619–11624 CAS.
- Q. Z. Ren, J. W. Huang, Z. A. Zhu, L. N. Ji and Y. T. Chen, J. Porphyrins Phthalocyanines, 2001, 5, 449–455 CrossRef CAS.
- F. Jaouen, M. Lefevre, J. P. Dodelet and M. Cai, J. Mater. Chem. B, 2006, 110, 5553–5558 CAS.
- F. Jaouen, J. Herranz, M. Lefevre, J.-P. Dodelet, U. I. Kramm, I. Herrmann, P. Bogdanoff, J. Maruyama, T. Nagaoka, A. Garsuch, J. R. Dahn, T. Olson, S. Pylypenko, P. Atanassov and E. A. Ustinov, ACS Appl. Mater. Interfaces, 2009, 1, 1623–1639 CAS.
- G. Wu, C. M. Johnston, N. H. Mack, K. Artyushkova, M. Ferrandon, M. Nelson, J. S. Lezama-Pacheco, S. D. Conradson, K. L. More, D. J. Myers and P. Zelenay, J. Mater. Chem., 2011, 21, 11392–11405 RSC.
- Q. Wang, Z.-Y. Zhou, Y.-J. Lai, Y. You, J.-G. Liu, X.-L. Wu, E. Terefe, C. Chen, L. Song, M. Rauf, N. Tian and S.-G. Sun, J. Am. Chem. Soc., 2014, 136, 10882–10885 CrossRef CAS PubMed.
- L.-B. Lv, T.-N. Ye, L.-H. Gong, K.-X. Wang, J. Su, X.-H. Li and J.-S. Chen, Chem. Mater., 2015, 27, 544–549 CrossRef CAS.
- L.-T. Song, Z.-Y. Wu, F. Zhou, H.-W. Liang, Z.-Y. Yu and S.-H. Yu, Small, 2016, 12, 6398–6406 CrossRef CAS PubMed.
- X. Zhou, Z. Bai, M. Wu, J. Qiao and Z. Chen, J. Mater. Chem. A, 2015, 3, 3343–3350 CAS.
Footnote |
| † Electronic supplementary information (ESI) available. See DOI: 10.1039/c7ra06352k |
| This journal is © The Royal Society of Chemistry 2017 |