 Open Access Article
Preparation, characterization and the adsorption characteristics of lignin/silica nanocomposites from cellulosic ethanol residue
Weizhen Tian,
Haiming Li *,
Jinghui Zhou* and
Yanzhu Guo
Liaoning Key Laboratory of Pulp and Papermaking Engineering, Dalian Polytechnic University, Dalian, Liaoning 116034, China. E-mail: 286911185@qq.com; zhoujh@dlpu.edu.cn; Tel: +86-15998597611
First published on 22nd August 2017
Abstract
The preparation, characterization, and adsorption characteristics of lignin/silica nanocomposites are described. The nanocomposites were obtained from cellulosic ethanol residue (CER) by an in situ method. The lignin was used as a structure directing reagent, and sulfuric acid as precipitating reagent during the synthesis of lignin/silica nanocomposites. The effects of pH on the properties of the nanocomposites have been investigated in detail. The prepared nanocomposites were characterized by the FT-IR, SEM, TG-TGA, XPS and low-temperature nitrogen sorption methods. Adsorption capacities and adsorption behaviors of selected lignin/silica nanocomposite, lignin, and silica for Methylene Blue (MB) were also studied, respectively. The results indicated that the lignin/silica nanocomposite is a good candidate for a biosorbent, providing a potential route for the high value-added utilization of CER.
1 Introduction
Nowadays, with the shortage of petrochemical resources and the development of biomass refining technology, cellulosic ethanol has received increasing attention because of its characteristics of cleanness, environmental friendliness and renewability. Corn stalk, an agricultural residue, can be biochemically converted to cellulosic ethanol through thermochemical pre-treatment of the biomass followed by microbial fermentation of sugars.1 Cellulosic ethanol residue (CER) is generated during the conversion, which mainly consists of lignin and silicon dioxide. With increasing usage of cellulosic ethanol, more and more CER will be available. However, it is usually combusted for energy generation, while its efficiency is lower than existing coal-fired burners.1,2 Its utilization needs to be further developed. Thus researchers' interest has been aroused in the high value-added utilization of CER.Lignin, the second most abundant bio-renewable non-food polymer next to cellulose, is a three-dimensional and renewable natural polymer consisting of methoxylated phenyl-propane structural units through carbon–carbon and ether bound linkages.3 It has a large amounts of active groups, such as phenolic hydroxyl and alcoholic hydroxyl,4–7 which imparts it chemically reactive activity.8 It can be used as a potential component for hydrogels,3 antioxidants,9 antibacterial agents,10 sunscreens,11 solubilizer, stabilizing agents, lubricants, coatings, plasticizers, surfactants, thermosetting polymer composites, thermoplastic polymer composites, lignin-reinforced biodegradable polymer matrix-based composites, rubber composites, foam-based composites and so on.12
Silica is a common inorganic oxide and possesses excellent physical and chemical properties, such as high chemical resistance, strong adhesion, and large specific surface area. The massive hydroxyl groups on the surface of silica render the intrinsically hydrophilic,13,14 which is favorable for colloidal stability. Silica has been applied in many fields,15 especially in nanocomposites as inorganic fillers.16 Modification of silica further widens its application in cartridges, composites preparation and so on.14,17–19
So far, some researchers have studied the synthesis of new silica/lignin hybrid materials, in which lignin acts as an important basic material. Cui et al.20 prepared siliceous lignin microparticles through reaction of certain amount of wheat husk and sodium hydroxide solution, followed by filtration of the mixture and titration of the collected filtrate to required pH with HCl, and then reaction for a period of time at the pH. Xiong et al.21 adopted co-precipitation process to prepare hydrophobic lignin-based silica composite submicronparticles via the hydrogen bonding interaction between the hydroxyl groups in lignin and silica. Zhang et al.22 used rice straw black liquor as raw material and CO2 as acid precipitator to prepare lignin-modified silica nanoparticles by in situ composite method; Thulluri et al.23 summarized the synthesis and development prospect of lignin-based nanocomposites. Saad et al.24 prepared lignin/silica nanocomposites with lignin silylated by triethoxychlorosilane and nanosized silica. 31P-NMR analysis showed that the hydroxyl groups on the lignin were replaced by the Si–O–LIG ether bond in the composites, and TEM showed that the lignin in the composites were grafted onto the nanosized silica surface, and the composites had a large surface area (560 m2 g−1). Klapiszewski et al.25 reported the synthesis, characterization and potential applications of silica/lignosulfonate hybrid materials. Three types of silica were used to optimize silica species. Its experimental results showed that the composite material had high stability and porous structure, which made it a potential biosorbent to dispose hazardous metal ions and harmful organic compounds.26,27 In addition, it can be utilized in other respect as a polymer filler or antioxidant.
Our previous research showed that CER contains a small amount of un-enzymolyzed cellulose, a large amount of lignin, ash, etc.,1 in which the main component of ash was silica. Most of silica and lignin could be dissolved out from CER in NaOH solution. The main aim of this work was to prepare lignin/silica nanocomposites from corn stalks CER by in situ co-precipitation method, and to study the influences of pH value on their morphology, composition, and adsorption behavior for methylene blue, thus to provide a new way for the high value-added utilization of CER.
2 Materials and methods
2.1. Materials
The CER of corn stalks was supplied by China National Cereals, Oils and Foodstuffs Corporation, Beijing, China. The chemical composition (%, w/w) of the CER was determined according to National Renewable Energy Laboratory standard analytical method,28 which was ash 19.2%, acid-soluble lignin 3.51%, holocellulose 8.62% and Klason lignin 65.39%. The CER was pre-treated with sulfuric acid (1%) for 1 h at 120 °C to remove holocellulose,29 then the precipitate was filtered, washed with deionized water to neutral, dried at 65 °C overnight, and porphyrized to pass 100 meshes before employment. Then it was used to prepare lignin/silica nanocomposites.All chemical reagents, such as sulfuric acid (98%), NaOH (99%), methylene blue (>80%), hydrochloric acid, dioxane (99.5%) were obtained from Sinopharm Chemical Reagent Co., Ltd. Deionized water was applied for all treatment and synthesis processes, and all chemicals were AR grade.
2.2. Preparation of lignin
5.0 g of pre-treated CER was mixed with NaOH solution (125 mL, 7.0 wt%) at 95 °C for 1 h in three-neck round-bottom flask quipped with a water bath. The solid phase was collected by centrifugal separation, and washed twice with 10% NaOH solution afterwards. The liquid phase obtained by centrifugal separation and the washing filtrate were combined and poured into three volumes of acid water with pH of 2.0. The pH value of the solution was re-adjusted back to about 2.0 with hydrochloric acid. The crude lignin was obtained after further process of the precipitate by centrifugation followed by washing with acidic water (pH 2.0) for several times, and then freeze-drying for 48 h.The crude lignin was purified by liquid–liquid extraction to remove impurities.30,31 A 1.0 g sample of crude lignin was dissolved in 28 mL of pyridine/acetic acid/water (9![[thin space (1/6-em)]](https://www.rsc.org/images/entities/char_2009.gif) :
:![[thin space (1/6-em)]](https://www.rsc.org/images/entities/char_2009.gif) 1
1![[thin space (1/6-em)]](https://www.rsc.org/images/entities/char_2009.gif) :
:![[thin space (1/6-em)]](https://www.rsc.org/images/entities/char_2009.gif) 4, v/v/v). The solution was mixed with 36 mL chloroform then centrifuged to separate the nonaqueous and aqueous layers. The nonaqueous layer was isolated and evaporated to remove solvent. The lignin was re-dissolved in 10–20 mL of 1,2-dichloroethane/ethanol (2
4, v/v/v). The solution was mixed with 36 mL chloroform then centrifuged to separate the nonaqueous and aqueous layers. The nonaqueous layer was isolated and evaporated to remove solvent. The lignin was re-dissolved in 10–20 mL of 1,2-dichloroethane/ethanol (2![[thin space (1/6-em)]](https://www.rsc.org/images/entities/char_2009.gif) :
:![[thin space (1/6-em)]](https://www.rsc.org/images/entities/char_2009.gif) 1, v/v) and precipitated by dropwise addition into 250 mL diethyl ether. The precipitated lignin was washed twice with ether, air-dried, then dried further over P2O5 under vacuum.
1, v/v) and precipitated by dropwise addition into 250 mL diethyl ether. The precipitated lignin was washed twice with ether, air-dried, then dried further over P2O5 under vacuum.
2.3. Preparation of lignin/silica nanocomposite
The lignin/silica nanocomposite were prepared by two methods: the pre-treated CER (5.0 g) was dissolved in NaOH (125 mL, 7.0 wt%) in a three-neck round-bottom flask placed in a water bath equipped with a motor stirrer and thermometer and heated to 75 °C. The initial pH of the solution was in the range of 11 to 12 and the final pH values of the solution were adjust to pH 2.0, 3.5, 5.0 and 6.5, respectively, by adding sulfuric acid (2 mol L−1) at flow rate of 18 mL h−1 under stirring (1000 rpm). Sulfuric acid was used as a precipitating reagent to form silica colloidal in the solution.21,22 After stirring for 2 h, the flask was taken out from the water bath. Then aging was started. After aging for 12 h, the precipitate was collected by centrifugation. The final product, which was the lignin/silica sample, were filtrated, washed several times with dioxane/water solution (9![[thin space (1/6-em)]](https://www.rsc.org/images/entities/char_2009.gif) :
:![[thin space (1/6-em)]](https://www.rsc.org/images/entities/char_2009.gif) 1, v/v) to dissolve unreacted lignin, and then washed with deionized water and freeze-dried for 48 h to obtain the nanocomposite.32,33 The prepared lignin/silica nanocomposite samples at pH 2.0, 3.5, 5.0, 6.5 were named as LS1, LS2, LS3 and LS4, respectively.
1, v/v) to dissolve unreacted lignin, and then washed with deionized water and freeze-dried for 48 h to obtain the nanocomposite.32,33 The prepared lignin/silica nanocomposite samples at pH 2.0, 3.5, 5.0, 6.5 were named as LS1, LS2, LS3 and LS4, respectively.
2.4. Characterization
Fourier transform infrared spectra (FT-IR) were recorded using KBr pellet samples with an instrument (FT-IR, Spectrum-B, PE, UK); the morphology of nanocomposites were analyzed by a scanning electron microscope (SEM, JSM-7800F, Japan); the thermal behavior of the nanocomposites were studied through a Thermogravimetric Analyser (TGA, Q50, TA Company, USA); the surface elements of the sample were analyzed with X-ray photoelectron spectroscopy (XPS, K-Alpha, Thermo Scientific, USA); the particle size distributions were characterized by a particle-size analyzer (Nano-ZS90, Malvern, UK); the specific surface area and pore size of the lignin, silica and lignin/silica nanocomposites were measured by using the Brunauer–Emmett–Teller (BET) method with an automated chemisorption/physisorption surface area and pore size analyzer (ASAP 2010, Micrometrics Instruments Co., USA).2.5. Application in dye wastewater treatment
The nanocomposites were used as absorbent to treat methylene blue solution, a representative of dye wastewater. As comparison, silica and lignin treatment efficiencies were also investigated. Absorbent of certain dosage (75 mg g−1 or 100 mg g−1) was added into 100 mL pH-pre-adjusted (pH 7.0) methylene blue solution. Then the solution was stirred for different times between 0 min to 120 min at 35 °C in dark. The concentration of methylene blue solution was determined according to its absorbance at 664 cm−1.34 The removal rate of methylene blue was calculated according to eqn (1):| η = (C0 − Ct)/C0 × 100% | (1) |
3 Results and discussion
3.1. The composition of nanocomposite
The silica and lignin contents in the nanocomposites prepared at different pH were shown in Table 1. As shown, silica content increased with increasing of pH value. This indicated lignin/silica nanocomposites were synthesized.| Material | Composition | |
|---|---|---|
| SiO2 (%) | Lignin (%) | |
| LS1 | 6.18 | 93.92 |
| LS2 | 8.70 | 91.30 |
| LS3 | 14.02 | 85.98 |
| LS4 | 21.46 | 78.54 |
3.2. XPS analysis
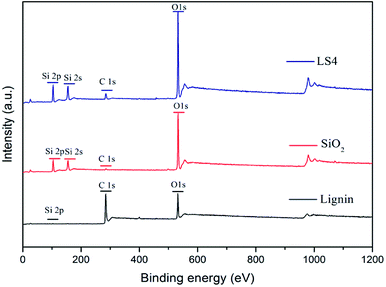
The content of surface elements of LS4, lignin and silica was listed in Table 2. It showed that element content of C increased and elements contents of Si and O decreased in LS4 compared to silica. Fig. 1 presented the XPS results of LS4, lignin, and silica samples. Analysis of the XPS spectrum of lignin revealed a peak C 1s at binding energy close to 285 eV and peak O 1s at binding energy close to 531 eV. Meanwhile, silica consisted mostly of silicon as evidenced by the peak Si 2p at binding energy of 103 eV and peak Si 2s at binding energy of 150 eV, with a large amount of oxygen (the O 1s peak at binding energy of 531 eV).21 The trace carbon content in silica was mainly due to the inevitable carbon pollution during XPS measurement. The XPS spectrum of LS4 confirmed the formation of composites, which was evidenced by the existence of the peak of C 1s at binding energy close to 285 eV and the peaks of Si 2p and Si 2s. The result indicated that there was a lot of silicon in the LS4, which was consistent with the results of the composition analysis.| Samples | C (%) | O (%) | Si (%) |
|---|---|---|---|
| LS4 | 3.94 | 62.81 | 34.12 |
| SiO2 | 75.00 | 23.86 | 1.14 |
| Lignin | 11.88 | 59.34 | 28.41 |
3.3. FT-IR analysis
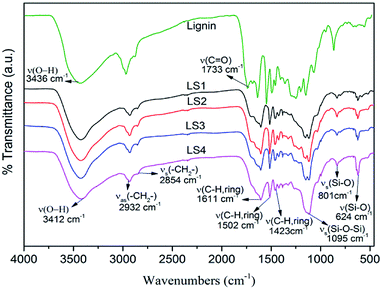
The FT-IR spectra were taken and analyzed to identify the functional groups in the structure of lignin and lignin/silica nanocomposites (Fig. 2). Based on the previous literatures,3,16,35 the main peaks of lignin in FT-IR spectra were assigned. The broad peak at 3436 cm−1 assigned to the stretching vibrations O–H groups. The peaks at 2932 cm−1 and 2854 cm−1 assigned to anti-symmetric stretching and stretching in methylene groups, respectively. The peaks at 1733 cm−1 attributed to C![[double bond, length as m-dash]](https://www.rsc.org/images/entities/char_e001.gif) O stretching vibration of carbonyl groups, and the peak at 1611 cm−1, 1502 cm−1, and 1423 cm−1 to characteristic vibrations from aromatic rings.
O stretching vibration of carbonyl groups, and the peak at 1611 cm−1, 1502 cm−1, and 1423 cm−1 to characteristic vibrations from aromatic rings.
The characteristic peaks of silica according to the literature16,17,36 were observed at 3412 cm−1 attributed to stretching vibrations of O–H groups, and at 1095 cm−1, 801 cm−1 and 624 cm−1, attributed to the stretching vibrations of Si–O–Si, and stretching vibrations and bending vibrations of Si–O bands, respectively.
Compared with the characteristic structure of lignin and silica, the LS4 had the characteristic peaks of lignin as well as silica characteristic peaks, for example, the characteristic vibrations from aromatic rings of lignin at 1611 cm−1, 1502 cm−1, and 1423 cm−1, and the characteristic peaks reflecting the stretching vibrations of Si–O–Si (1095 cm−1), and stretching vibration and bending vibrations of Si–O (801 cm−1 and 624 cm−1). Since unreacted lignin had been removed by dioxane/water solution from the nanocomposite, the existence of peaks of lignin and disappearance of the peak for the O–H group from SiO2 all indicated that the O–H group of SiO2 might have reacted with lignin.16
3.4. Thermal analysis
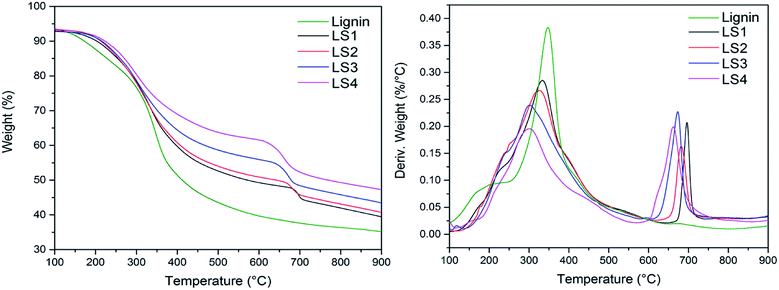
Thermal analysis is the main method for characterization of thermal properties of chemical substances.1,37 Fig. 3 presented TGA and DTA curves of lignin and lignin/silica nanocomposites (LS1, LS2, LS3 and LS4). It was found that the thermal degradation related to lignin structure38 occurred at the temperature range of 200–600 °C. Generally, the weight loss in the range of 200–400 °C was attributed to the decomposition of methyl-aryl ether bonds of lignin. The weight losses from 200 °C to 400 °C for lignin, LS1, LS2, LS3 and LS4 samples were 36.0%, 32.0%, 31.5%, 28.5%, and 24.0%, respectively. Another transformation in the temperature of 400 °C to 600 °C was due to the decomposition of aromatic rings and side chains in lignin. In the temperature range of 400 °C to 600 °C, the weight losses of lignin, LS1, LS2, LS3 and LS4 were 13.0%, 11.5%, 11.0%, 9.0%, and 7.5%, respectively. The third stage of the composites mass loss of about 3–10% observed in the range 600–800 °C was interpreted as a consequence of the lignin molecules bonded with silica.25 The similar phenomenon was also found by Klapiszewski et al.39 The mass loss of the third stage increased with the increasing of pH value, which was resulted from improvement of silica content in the nanocomposite. Meanwhile, it was found that the weight values of residues at 900 °C were 47% in LS4 and 35% in lignin, indicating that more silica existed in composite, which was consistent with XPS analysis.3.5. Dispersive-morphological properties
The morphology and surface structure of nanocomposites (LS1, LS2, LS3 and LS4) were characterized by SEM (Fig. 4). Lignin was easier to adsorb and deposit on the surface of silica to form lignin/silica nanocomposites than form nano-sized aggregates by itself in the co-precipitation process.22 The morphology of the composites was a typical spherical and porous structure. The SEM results showed the presence of small particle of diameters below 100 nm and greater agglomerate structure, which were consistent with the literature reported.21 Especially the sample obtained at pH 6.5 (LS4) had the smallest particle size and the most porous structure than the rest of nanocomposites (LS1, LS2, and LS3), which imparted it potential use in the field of adsorption. LS4 was chosen for further study.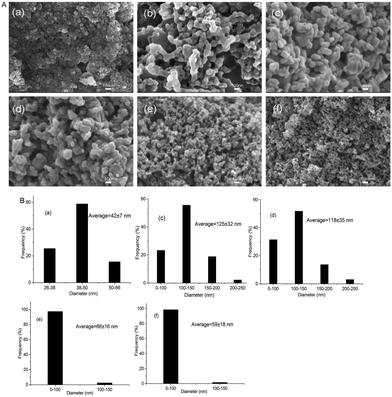 | ||
| Fig. 4 SEM micrographs (A) and size (B) of nanocomposites prepared at 75 °C under different pH: (a) SiO2, (b) lignin, (c) LS1, (d) LS2, (e) LS3 and (f) LS4. | ||
3.6. Parameters of porous structure
The surface of the silica, lignin and LS4 samples were determined by measuring nitrogen adsorption–desorption isotherms and BET modeling and their pore volume distributions were analyzed by Barrett–Joyner–Halenda (BJH) method25 using desorption isotherm data. Table 3 presented the data characterizing adsorption properties of silica, lignin, and LS4 samples. The results showed that SiO2 had the largest pore diameter, while LS4 had the smallest. Lignin had the smallest surface area and total pore volume, while SiO2 had the medium level of surface area and the highest total pore volume. The insertion of lignin into SiO2 decreased the total pore volume of LS4 and increased its surface area. The nanocomposite prepared simply by in situ method had the specific surface area of 384 m2 g−1, which was 81% higher than that of silica/magnesium lignosulfonate hybrid materials prepared with sol–gel method by Ł. Klapiszewski et al.25| Samples | Surface area SBET (m2 g−1) | Total pore volume (cm3 g−1) | Average pore diameter (nm) |
|---|---|---|---|
| LS4 | 384.69 | 0.43 | 4.21 |
| SiO2 | 228.41 | 0.86 | 14.79 |
| Lignin | 7.13 | 0.03 | 13.46 |
Fig. 5 shown the nitrogen adsorption–desorption isotherms and pore volume curves (inset) on silica, lignin and LS4. The lower portion of the loop was traced out on adsorption, and the upper portion on desorption. A hysteresis loop was found in the adsorption–desorption isotherm of three samples, which resembled type IV of Brunauer's classification.40 At the lower relative pressure, the increasing speed of quantity adsorbed was slower, indicating monolayer adsorption. However, with the higher relative pressure, the increasing speed became faster, owing to the capillary condensation. Both BET and SEM analyses confirmed that the lignin/silica composites had excellent adsorption property.41
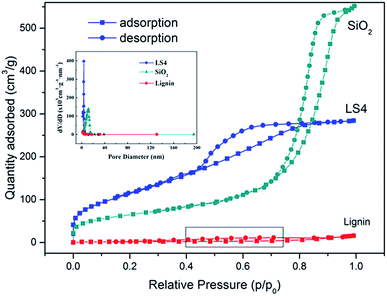 | ||
| Fig. 5 Nitrogen adsorption–desorption isotherms and pore volume curves (inset) of LS4, silica, and lignin. | ||
3.7. Treatment of dye wastewater containing methylene blue
Methylene blue (MB) is one of widely used synthetic dyes in textile, leather tanning, food processing, paper, plastics, rubber, cosmetics, printing and dye manufacturing industries, and its use generates colored effluents which is harmful to environment. Considering adsorption is one of the most effective way to treat dye effluent,42 the adsorption abilities of silica, lignin and LS4 towards MB solution were studied, respectively. The effects of adsorption time on the removal rate of MB were shown in Fig. 6. The removal rate of MB decreased from 83.8% to 63.0% when the initial mass concentration of MB solution increased from 75 mg g−1 to 100 mg g−1 and the LS4 was used to treat MB solution for 120 min. The adsorption capacity of the LS4 to MB was constant. Therefore, when the initial mass concentration of MB solution increased, and the removal rate decreased. Analysis of the results indicated that a state of adsorption equilibrium was being reached at about 20 minutes for MB, and the adsorption efficiency of LS4 on MB was much more than that of lignin. This was because the LS4 with higher specific surface area had more functional groups on its surface and thus its sorption ability towards MB was stronger.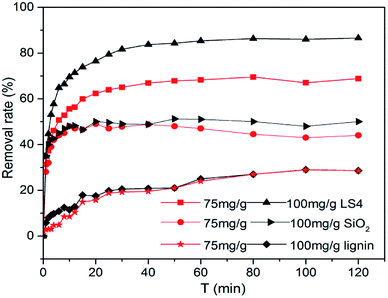 | ||
| Fig. 6 Removal rate of methylene blue at different concentrations (75 and 100 mg g−1) of LS4, silica and lignin. | ||
4 Conclusions
With lignin as a structure directing reagent and sulfuric acid as a precipitating reagent, the proposed method of lignin/silica nanocomposites preparation permits obtaining products with well-defined dispersive, morphological and adsorption properties. FT-IR result showed that under these conditions lignin can form chemical bonds with SiO2-probably silanol groups in the silica structure. The thermal and composition analysis conformed successful synthesis of the nanocomposites from CER, as proved by TG and XPS analysis. SEM and BET result showed that the composite had porous structure with great surface area, which imparted the nanocomposites a good adsorption ability. The nanocomposites may serve as adsorbent material in the field of adsorption industry.Acknowledgements
This work was financially supported by the National Natural Science Foundation of China (31470604, 31170554), and Fundamental Research Fund of Dalian Polytechnic University (2016J001).Notes and references
- C. Buratti, M. Barbanera, P. Bartocci and F. Fantozzi, Bioresour. Technol., 2015, 186, 154–162 CrossRef CAS PubMed.
- T. Leskinen, S. S. Kelley and D. S. Argyropoulos, ACS Sustainable Chem. Eng., 2015, 3, 1632–1641 CrossRef CAS.
- V. K. Thakur and M. K. Thakur, Int. J. Biol. Macromol., 2015, 72, 834–847 CrossRef CAS PubMed.
- F. S. Chakar and A. J. Ragauskas, Ind. Crops Prod., 2004, 20, 131–141 CrossRef CAS.
- S. Baumberger, P. Dole and C. Lapierre, J. Agric. Food Chem., 2002, 50, 2450–2453 CrossRef CAS PubMed.
- S. Park, S. H. Kim, J. H. Kim, H. Yu, H. J. Kim, Y.-H. Yang, H. Kim, Y. H. Kim, S. H. Ha and S. H. Lee, J. Mol. Catal. B: Enzym., 2015, 119, 33–39 CrossRef CAS.
- L. B. Brenelli, F. Mandelli, A. Z. Mercadante, G. J. D. M. Rocha, S. A. Rocco, A. F. Craievich, A. R. Gonçalves, D. D. C. Centeno, M. de Oliveira Neto and F. M. Squina, Ind. Crops Prod., 2016, 83, 94–103 CrossRef CAS.
- A. Arshanitsa, J. Ponomarenko, T. Dizhbite, A. Andersone, R. J. A. Gosselink, J. van der Putten, M. Lauberts and G. Telysheva, J. Anal. Appl. Pyrolysis, 2013, 103, 78–85 CrossRef CAS.
- H. Y. Yu, Z. Y. Chen, B. Sun, J. Liu, F. Y. Meng, Y. Liu, T. Tian, A. Jin and H. L. Ruan, J. Nat. Prod., 2014, 77, 1311–1320 CrossRef CAS PubMed.
- W. Yang, J. S. Owczarek, E. Fortunati, M. Kozanecki, A. Mazzaglia, G. M. Balestra, J. M. Kenny, L. Torre and D. Puglia, Ind. Crops Prod., 2016, 94, 800–811 CrossRef CAS.
- Y. Qian, X. Qiu and S. Zhu, Green Chem., 2015, 17, 320–324 RSC.
- V. K. Thakur, M. K. Thakur, P. Raghavan and M. R. Kessler, ACS Sustainable Chem. Eng., 2014, 2, 1072–1092 CrossRef CAS.
- L. Lin, S. R. Zhai, Z. Y. Xiao, N. Liu, Y. Song, B. Zhai and Q. D. An, Bioresour. Technol., 2012, 125, 172–174 CrossRef CAS PubMed.
- T. Jesionowski and A. Krysztafkiewicz, Colloids Surf., A, 2002, 207, 49–58 CrossRef CAS.
- P. K. Jal, M. Sudarshan, A. Saha, S. Patel and B. K. Mishra, Colloids Surf., A, 2004, 240, 173–178 CrossRef CAS.
- B. Strzemiecka, Ł. Klapiszewski, A. Jamrozik, T. Szalaty, D. Matykiewicz, T. Sterzyński, A. Voelkel and T. Jesionowski, Materials, 2016, 9, 517 CrossRef PubMed.
- M. Dziadas, M. Nowacka, T. Jesionowski and H. H. Jelen, Anal. Chim. Acta, 2011, 699, 66–72 CrossRef CAS PubMed.
- T. Jesionowski, K. Bula, J. Janiszewski and J. Jurga, Compos. Interfaces, 2003, 10, 225–242 CrossRef CAS.
- K. Bula, T. Jesionowski, A. Krysztafkiewicz and J. Janik, Colloid Polym. Sci., 2007, 285, 1267–1273 CAS.
- J. Cui, H. Sun, X. Wang, J. Sun, M. Niu and Z. Wen, Ind. Crops Prod., 2015, 74, 689–696 CrossRef CAS.
- W. Xiong, D. Yang, R. Zhong, Y. Li, H. Zhou and X. Qiu, Ind. Crops Prod., 2015, 74, 285–292 CrossRef CAS.
- X. Zhang, Z. Zhao, G. Ran, Y. Liu, S. Liu, B. Zhou and Z. Wang, Powder Technol., 2013, 246, 664–668 CrossRef CAS.
- C. Thulluri, S. R. Pinnamaneni, P. R. Shetty and U. Addepally, Ind. Biotechnol., 2016, 12, 153–160 CrossRef CAS.
- R. Saad and J. Hawari, J. Porous Mater., 2012, 20, 227–233 CrossRef.
- Ł. Klapiszewski, J. Zdarta, T. Szatkowski, M. Wysokowski, M. Nowacka, K. Szwarc-Rzepka, P. Bartczak, K. Siwińska-Stefańska, H. Ehrlich and T. Jesionowski, Cent. Eur. J. Chem., 2014, 12, 719–735 CrossRef.
- M. T. Matter, F. Starsich, M. Galli, M. Hilber, A. Schlegel, S. Bertazzo, S. Pratsinis and I. K. Herrmann, Nanoscale, 2017, 9, 8418–8426 RSC.
- A. Xie, J. Dai, J. He, J. Sun, Z. Chang, C. Li and Y. Yan, RSC Adv., 2016, 6, 13312–13322 RSC.
- B. H. A. Sluiter, R. Ruiz, C. Scarlata, J. Sluiter, D. Templeton and D. Crocker, Laboratory Analytical Procedures, 2008, p. 1617 Search PubMed.
- K. Minu, K. K. Jiby and V. V. N. Kishore, Biomass Bioenergy, 2012, 39, 210–217 CrossRef CAS.
- X. Pan, C. Arato, N. Gilkes, D. Gregg, W. Mabee, K. Pye, Z. Xiao, X. Zhang and J. Saddler, Biotechnol. Bioeng., 2005, 90, 473–481 CrossRef CAS PubMed.
- J. Lu, X. Li, R. Yang, J. Zhao, Y. Liu and Y. Qu, Chem. Eng. J., 2014, 247, 142–151 CrossRef CAS.
- L. Klapiszewski, M. Mądrawska and T. Jesionowski, Physicochem. Probl. Miner. Process., 2012, 48, 463–473 CAS.
- T. Jesionowski, Ł. Klapiszewski and G. Milczarek, Mater. Chem. Phys., 2014, 147, 1049–1057 CrossRef CAS.
- J. Chen, J. Feng and W. Yan, J. Colloid Interface Sci., 2016, 475, 26–35 CrossRef CAS PubMed.
- B. Strzemiecka, Ł. Klapiszewski, D. Matykiewicz, A. Voelkel and T. Jesionowski, J. Adhes. Sci. Technol., 2015, 30, 1031–1048 CrossRef.
- M. Nowacka, Ł. Klapiszewski, M. Norman and T. Jesionowski, Open Chem., 2013, 11, 1860–1873 CAS.
- T. Damartzis, D. Vamvuka, S. Sfakiotakis and A. Zabaniotou, Bioresour. Technol., 2011, 102, 6230–6238 CrossRef CAS PubMed.
- X. Wang, Y. Guo, J. Zhou and G. Sun, RSC Adv., 2017, 7, 8314–8322 RSC.
- Ł. Klapiszewski, M. Królak and T. Jesionowski, Cent. Eur. J. Chem., 2013, 12, 173–184 CrossRef.
- S. Brunauer, P. H. Emmett and E. Teller, J. Am. Chem. Soc., 1938, 60, 309–319 CrossRef CAS.
- F. Ciesielczyk, Ł. Klapiszewski, K. Szwarc-Rzepka and T. Jesionowski, Adv. Powder Technol., 2014, 25, 695–703 CrossRef CAS.
- G. L. Dotto, J. M. Santos, I. L. Rodrigues, R. Rosa, F. A. Pavan and E. C. Lima, J. Colloid Interface Sci., 2015, 446, 133–140 CrossRef CAS PubMed.
| This journal is © The Royal Society of Chemistry 2017 |

