
 Open Access Article
 This Open Access Article is licensed under a Creative Commons Attribution-Non Commercial 3.0 Unported Licence
Intramolecular charge transfer induced emission from triphenylamine-o-carborane dyads†
Yi Wan‡
a,
Junfeng Li‡*a,
Xuelei Penga,
Chao Huanga,
Qi Qi*b,
Wen-Yong Lai *ac and
Wei Huangac
*ac and
Wei Huangac
aKey Laboratory for Organic Electronics and Information Displays (KLOEID), Institute of Advanced Materials (IAM), Jiangsu National Synergetic Innovation Center for Advanced Materials (SICAM), Nanjing University of Posts & Telecommunications, 9 Wenyuan Road, Nanjing 210023, China. E-mail: iamjfli@njupt.edu.cn; iamwylai@njupt.edu.cn
bSchool of Chemistry and Chemical Engineering, Southeast University, Nanjing 211189, China. E-mail: qiqi027@163.com
cKey Laboratory of Flexible Electronics (KLOFE), Institute of Advanced Materials (IAM), Jiangsu National Synergetic Innovation Center for Advanced Materials (SICAM), Nanjing Tech University (NanjingTech), 30 South Puzhu Road, Nanjing 211816, China
First published on 17th July 2017
Abstract
Two novel triphenylamine-o-carborane dyads with donor–acceptor architectures were designed and synthesized. The photophysical properties were thoroughly investigated. The results demonstrated that triphenylamine-o-carborane dyads presented locally excited (LE) emission and twisted intramolecular charge transfer (TICT) induced emission in various polar solvents, in which LE emission was not dependent on the solvent polarities and TICT emission was consistent with the solvent polarities. The solvent-dependent TICT emission with a large bathochromic shift exhibited a dramatic decrease in emissive efficiency with increasing the solvent polarity. More importantly, the triphenylamine-o-carborane dyads in solid states exhibited highly efficient ICT emissions, in which the ICT characteristics were confirmed by the experimental data and the density function theory (DFT) calculation results.
Introduction
o-Carborane (1,2-closo-dicarbadodecaborane, C2B10H12) is an electron-deficient icosahedral carborane cluster with three-center two-electron bonds, and possesses highly polarizable σ-aromatic characteristics. In the past decades, carborane-based materials have attracted particular interest in boron neutron capture therapy,1–3 heat-resistant agents,4,5 and coordination/organo-metallic chemistry as ligands.6–11 Although carborane-organic materials have been developed as novel aggregation-induced-emission (AIE)-active luminogens, their emissive mechanisms still remain unclear to date. The reasons are mainly because the electron-deficient parent carborane clusters show little or no absorption at >250 nm, nor any emission, and their emissions were seriously influenced by the external stimuli.12–17 Taking these into account, to elucidate the emissive mechanisms of AIE-active carborane based luminogens is desirable for shedding light on the rational design and development of efficient luminogens. Chujo and co-workers have reported that o-carborane-conjugated systems substituted with various electron-donating and electron-withdrawing aromatic groups were color-tunable AIE-active, which were the result of intramolecular charge transfer (ICT) from the π-conjugated groups to the C1–C2 bond of o-carborane (o-Cab), and emission originated from the restricted molecular motion of the o-Cab cage in the aggregated state.18–26 We have recently explored a series of ICT-emissive organic materials and carborane-based phosphorescent iridium(III) complexes that have been successfully applied in optoelectronic devices and cellular bioimaging.27–30 Since 2001, various working mechanisms based on AIE-active materials have been proposed, including conformational planarization,31 J-aggregate formation,32 E/Z isomerization,33 and excited state intramolecular proton transfer (ESIPT),34–37 restriction of intramolecular rotations (RIR),31 restriction of intramolecular vibrations (RIV)32 and restriction of intramolecular motions (RIM).34 For o-Cab-based materials, when the aromatic plane is perpendicular to the C1–C2 bond in o-Cab, the donor–acceptor interactions can be significantly enhanced. Thus, the ICT emission has a close relationship with the structure conformation between the connected aromatic unit and the o-Cab moiety.38 Fine modulating the molecular architectures to regulate the intra- or intermolecular charge transfer properties and aggregation of aryl-o-carborane dyads would shed light on unravelling the emissive mechanisms of o-Cab based materials and can afford novel emissive materials. However, little is known and no work based on triphenylamine-o-Cab dyads has hitherto been investigated.Herein, we have designed and synthesized two novel o-Cab-based molecules (o-1 and o-2), in which triphenylamine-o-Cab cages are introduced at 1 and 3 or 4 positions of the phenyl ring. The resulting triphenylamine-o-Cab dyads presented multicolor emissions, which were assigned to the radiative decays from the locally excited (LE) states and the twisted intramolecular charge transfer (TICT) states in solutions, in which LE emission was not dependent on the solvent polarities and TICT emissions were consistent with the solvent polarities. Moreover, both triphenylamine-o-Cab dyads in solid states exhibited highly efficient ICT emissions, in which the ICT emissive mechanism was confirmed by both the experimental data and the density function theory (DFT) calculation results.
Results and discussion
The synthetic procedures of o-1 and o-2 are depicted in Scheme 1. o-Cab was introduced as an electron-deficient acceptor onto the meta- and para-position of the central phenylene ring, respectively. Triphenylamine (TPA) functioned as an electron-donating moiety was attached onto the C1 atom of o-Cab, and the phenylene ring was used as a connected unit. The resulting targets are readily soluble in common organic solvents such as THF, CH2Cl2, CH3Cl and toluene, but insoluble in methanol and ethanol. The chemical purities and structures were fully characterized by 1H NMR, 13C NMR, 11B NMR and MALDI-TOF-MS spectroscopy (Fig. S1–8†). To investigate the thermal properties of o-1 and o-2, thermo-gravimetric analysis (TGA) and differential scanning calorimetry (DSC) measurements were carried out under N2 atmosphere with a scan rate of 10 °C min−1. Both o-1 and o-2 exhibited good thermal stability with 5% weight loss weight up to 398 °C and 402 °C, respectively. DSC curves demonstrated that o-1 and o-2 showed melting endothermic peaks at 133 °C and 131 °C, respectively (Fig. S9†). TPA-o-Cab dyads are thus thermally stable for practical applications in the field of organic optoelectronic devices.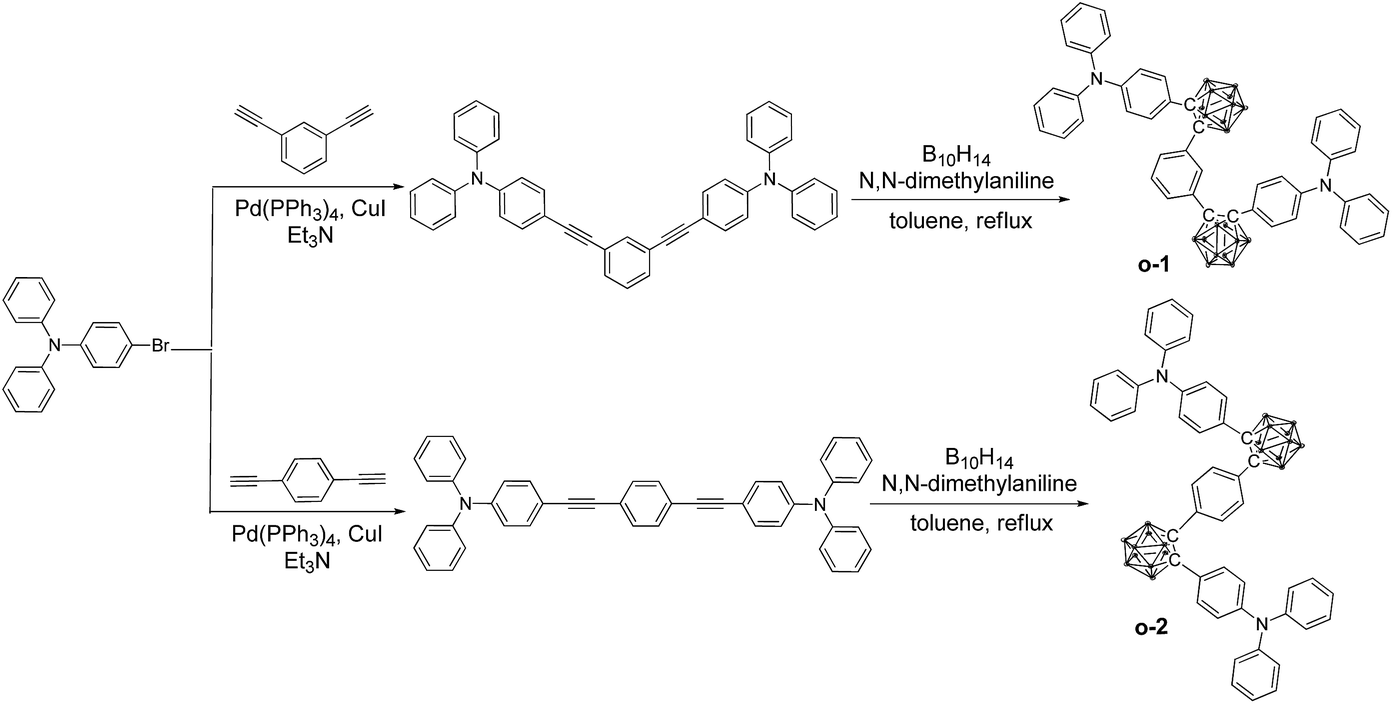 | ||
| Scheme 1 Synthetic routes towards o-1 and o-2. | ||
To get into the electron-transition behaviours of o-1 and o-2, the electrochemical behaviours were subjected to theoretical calculation based on ground geometry implemented by DFT in Gaussian 09 at the B3LYP/6-31G(d) levels to simulate the electron transition characteristics of the molecules. The highest-occupied molecular orbital (HOMO) levels for o-1 are mainly localized on the two TPA moieties, while the lowest unoccupied molecular orbital (LUMO) levels for o-1 are principally extended over the two o-Cab moieties and partial phenyl groups of TPA moieties. The TPA moieties functioned as electron-donating units, and the o-Cab moieties acted as electron-withdrawing units. The HOMO → LUMO electron transitions dominated the lowest-energy S1 excitation for o-1, giving rise as a direct evidence for the notable ICT character of acceptor–donor conjugate (Fig. 4).39–41 o-2 was also proved to be ICT-active by DFT calculation (Fig. S13†). According to the DFT calculation results, HOMO energy levels for o-1 and o-2 were determined to be of −5.33 eV and −5.41 eV, respectively, and the corresponding LUMO energy levels were −1.63 eV and −1.85 eV, respectively. The theoretical band gaps for o-1 and o-2 were thus calculated to be 3.70 eV and 3.56 eV, respectively. Fig. S14† depicts the cyclic voltammetry (CV) curves for o-1 and o-2. According to the CV results, HOMO energy levels for o-1 and o-2 were calculated to be of −5.58 eV and −5.44 eV, respectively, and the corresponding LUMO energy levels for o-1 and o-2 were −3.41 eV and −3.32 eV, respectively. The electrochemical band gaps for o-1 and o-2 were thus deduced as 2.17 eV and 2.12 eV, respectively. DFT calculations generally simulate the single-molecule energy levels and band gaps in gas phase, while CV measurements reflect the corresponding results in condensed states. It is believed that such difference is the origin for the difference of energy levels between DFT calculations and the CV results. The large difference also suggested distinct intramolecular/intermolecular interactions occurred for both o-1 and o-2 in condensed states.
To investigate the photophysical properties of o-1 and o-2, the absorption and emission spectra were measured in various solvents, such as n-hexane, cyclohexane, toluene, diethyl ether, tetrahydrofuran, dichloromethane, acetonitrile, and methanol. As shown in Fig. 1a and S10a,† the absorption spectra of o-1 and o-2 in various solvents exhibited the maximum absorption wavelength at around 331 nm and 328 nm, respectively. The main absorption peaks were ascribed to the characteristic π–π* transitions from TPA chromophores, suggesting that the main absorptions were slightly affected by the o-Cab in the ground state.42–44
 | ||
| Fig. 1 (a) UV-vis absorption and (b) emission spectra of o-1 in various solvents at room temperature. | ||
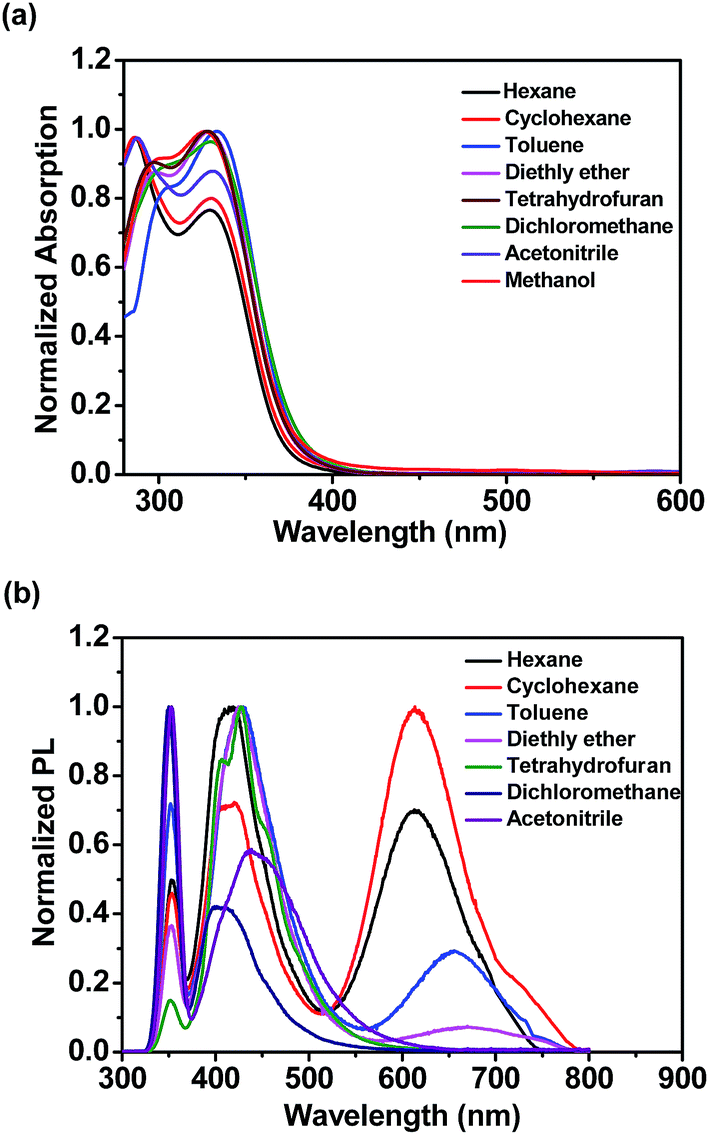
As shown in Fig. 1b, the weak emission band detected at 352 nm for o-1 was found in a variety of solvents from n-hexane to methanol and not affected by the polarity of the solvents. Such emission was presumably originated from the LE state of TPA moiety.42 This is mainly because the excited state of o-1 in a non-polar solvent is in equilibrium with the surrounding solvent molecules and its planar conformation is stabilized by the electronic conjugation which results in a sharp LE emission.33 Generally speaking, once the aromatic plane is parallel to the C1–C2 bond of an o-Cab, ICT efficiently occurs. Once the aromatic plane was twisted to the C1–C2 bond of o-Cab, TICT occurs more efficiently than in the parallel conformer.38 Thus, in a polar solvent, the excited state of o-1 is not in equilibrium with the surrounding solvent molecules. The rotation of C1–C2 bond in the o-Cab brings o-1 from LE state to TICT state, and then the electronic charge was separated from TPA unit to the C1–C2 bond in o-Cab. We can clearly find that o-1 exhibited a relative strong TICT emission at around 417 nm in n-hexane and red-shifted by 31 nm in acetonitrile, suggesting that the TICT states are susceptible to the solvent polarities.42,43 Meanwhile, in a non-polar solvent of n-hexane, another broad weak emission peaked at 613 nm was assigned to TICT emission. Moreover, with increasing the solvent polarity, the emission spectra bands of o-1 were shifted to red region and the emission intensities decreased remarkably. In acetonitrile with a large polarity, the emission spectrum was so weak that it became basically flat line parallel to the abscissa. The large Stokes shift observed in polar solvents were attributed to TICT processes from the donor TPA moieties to the C1–C2 bond of the acceptor o-Cab moieties. Similar solvent polarity-dependent TICT emissions were detected and confirmed for o-2 (Fig. S10b†).45–47 The TICT emissions for o-1 and o-2 were further verified by the emission decay lifetimes (Table S1†).23,24 With an aim to understand the solvatochromic luminescence, the Lippert–Mataga plots were performed with the values of the Stokes shift against the solvent polarizability, Δf, according to the Lippert–Matatga equation.24 As shown in Fig. 2, the slope of the approximate line plotted from the emission band around 352 nm was almost zero. Meanwhile, prominent keen slope was found from the profiles with the peak positions detected around 620 nm. Thus, the luminescent bands around 352 nm and 620 nm can be assigned to LE and TICT states, respectively. The TICT states demonstrated a strong dependence on the solvent polarity. Similar emission changes were also observed in the case of o-2.
 | ||
| Fig. 2 Mataga–Lippert plot for LE emissions (blue line) and CT emissions (red line) for o-1 in various solvents with different polarity. | ||
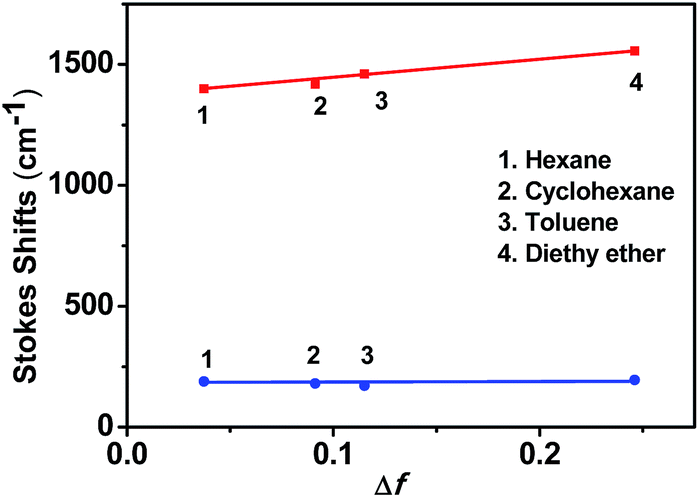
When the water fraction (fw) increased from 0% to 80%, the emission bands of o-1 exhibited no obvious change from 350 nm to 600 nm with a characteristic TICT state. Emission intensity was sharply enhanced after 90% of fw. It was clearly demonstrated that a red emission band emerged at 574 nm, originating from the lowest ICT excited state (Fig. 3a). This enhanced emission was assigned to the aggregated nanoparticles formation of o-1, and the aggregation driven growth is one of the reasons for the emission enhancement.48 Similar emission behaviours of o-2 were also identified in THF–H2O system (Fig. 3b). The above data sufficiently confirmed that the TICT emissions of o-1 and o-2 showed a crucial relationship between the excited conformation and the electronic distribution in aggregated states.
 | ||
| Fig. 3 Emission spectra of (a) o-1 and (b) o-2 in THF solution, upon increasing the water concentration from 0% to 95%; Inset: photograph of o-1 and o-2 in THF/H2O mixtures with various water contents (fw) taken under UV illustration (356 nm). | ||
To elucidate the relationships between ICT behaviours and molecular conformations, HOMO and LUMO distributions of o-1 were performed with the dihedral angles (ψ) between TPA and the C1–C2 bond in the o-Cab moiety by DFT method. According to the literature, the HOMO and LUMO distributions show a close relationship with the molecular conformations.18 The ICT effect could be significantly strengthened at the perpendicular conformation between the C1–C2 bond in the o-Cab moiety and the conjugated plane involving the directly connected aromatic unit to o-Cab.38 As depicted in Fig. 4, when the phenyl ring of TPA group for o-1 was perpendicular to the C1–C2 bond in o-Cab moiety, the HOMO resided on the TPA moiety and the connected partial o-Cab moiety. Meanwhile, the LUMO extended over two o-Cab moieties, the central phenylene ring, and phenyl groups of TPA moieties, giving rise as a direct evidence for the notable characteristic ICT behaviours. When the dihedral angle was 0°, the HOMO was primarily distributed on the TPA moieties and partial o-Cab units, and its LUMO was delocalized over the double o-Cab moieties, the connected phenylene ring and the other partial TPA groups. Since the HOMO → LUMO electron transitions determined the lowest-energy S1 excitation, the above calculation results further confirmed the distinct ICT characters of the resulting donor–acceptor TPA-o-Cab dyads and suggested that the emission from the parallel and perpendicular conformers should be derived from the ICT states. Moreover, the difference of the energy levels of each state with respect to the optimized structures was calculated. When the conformer was parallel or perpendicular conformation, the rotation barriers were 77.42 kcal mol−1 and 82.24 kcal mol−1, respectively, confirming that the intramolecular rotation was prohibited because of the steric hindrance of the substituents in o-Cab.49 The ICT behaviours for o-2 were also related with the conformation change depending on the dihedral angles (ψ) between the TPA and the C1–C2 bond in the o-Cab moiety by DFT methods (Fig. S13†). From these data, ICT processes should be responsible for the efficient emissions for o-1 and o-2 in solid states.50,51
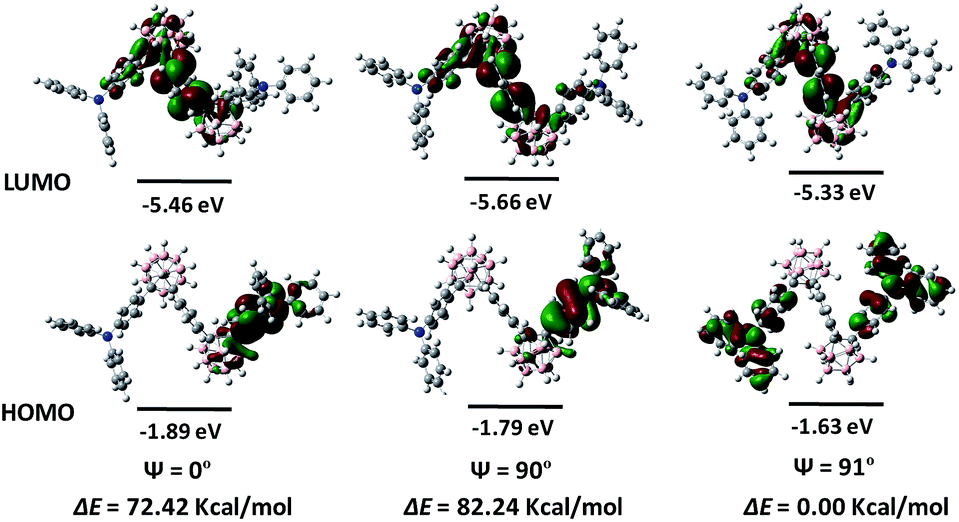 | ||
| Fig. 4 Calculated HOMO and LUMO distributions of o-1 with the dihedral angles (ψ) between the C1–C2 bond of o-Cab and the phenyl of TPA of 0°, 90° and 91°. The difference of total energy and energy levels of each orbital were calculated at the B3LYP/6-31G(d) levels by DFT calculations. | ||
In film states, o-1 and o-2 displayed well-defined peaks at around 334 nm and 337 nm, respectively, and were much broader and red-shifted with respect to their absorption spectra in organic solvents, presumably due to the strong π-π stacking interactions between the individual molecules.48 Fig. 5a showed that o-1 film, fabricated by spin-coating 1.0 mg mL−1 solution onto quartz substrates, demonstrated dual emission peaks at 417 nm and 620 nm, respectively. The dual emission bands can be assigned to the TICT and ICT states. Meanwhile, o-2 in film states exhibited dual emission peaks at 450 nm and 610 nm, respectively. Fluorescence lifetimes, τ, in air for o-1 (monitored at 417 nm: 0.60 ns, 2.26 ns; monitored at 620 nm: 3.09 ns, 9.88 ns) and o-2 (monitored at 450 nm: 0.49 ns, 1.99 ns; monitored at 610 nm: 1.11 ns, 8.68 ns) fitted to bi-exponential decays (Table S1†). It was clearly suggested that o-1 and o-2 in film states possessed both TICT and ICT properties.
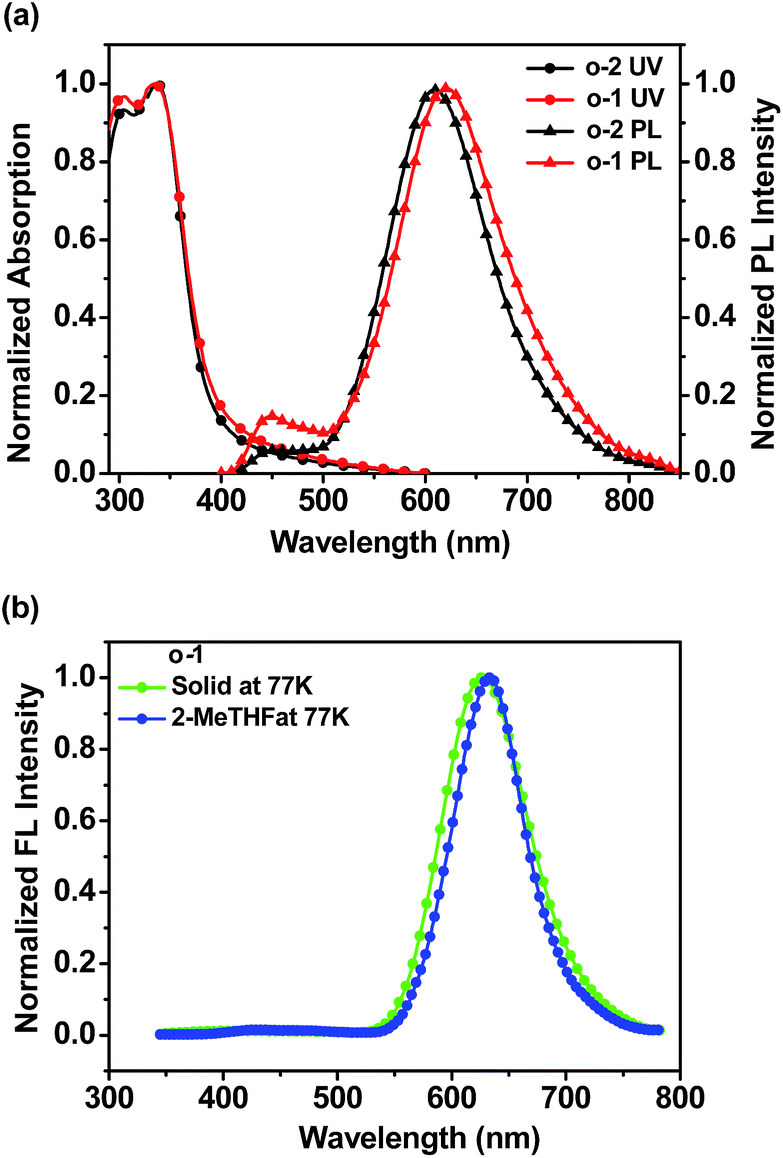 | ||
| Fig. 5 (a) Absorption and emission spectra of o-1 and o-2 in thin films at room temperature; (b) emission spectra of o-1 in solid states and in 2-MeTHF solution at 77 K. | ||
LE emission from o-Cab dyad was generally observed only under frozen states or structurally-restricted environmental conditions. In the frozen matrix of 2-MeTHF with 1.0 × 10⁻⁵ M concentration, the intense ICT emissions for o-1 and o-2 were detected at around 632 nm and 628 nm, respectively (Fig. 5b and S15a†). Fluorescence lifetimes for o-1 and o-2 were 8.14 ns and 7.27 ns, respectively, which were fitted to single-exponential decays, suggesting the existence of ICT excited states (Fig. S15b†). From emission spectra at 77 K, o-1 and o-2 in solid states presented narrow and sharp bands attributable to the ICT emissions at 630 nm and 633 nm, respectively. It is likely that the intramolecular rotation was prohibited because of the steric hindrances of the substituents in o-Cab units.49 In other words, this is why the TPA-o-Cab dyads did demonstrate ICT emission rather than LE emission in solid states. The emission lifetimes fitted to single-exponential decays (o-1: 8.76 ns; o-2: 7.53 ns), suggesting the existence of ICT excited states.49 Moreover, in solid states, the quantum efficiency for o-1 and o-2 was found to be 70% and 56%, respectively. From these data, it can be concluded that o-Cab acts as a versatile “element-block” not only for constructing ICT emission but also for designing highly efficient solid-state luminescent dyads.18
Conclusions
In conclusion, two novel TPA-o-Cab dyads were successfully designed, synthesized and characterized, in which TPA-o-Cab cages were introduced onto the meta- and para-positions of phenylene rings. The resulting luminescent dyads demonstrated similar photophysical behaviours regardless of different substituted positions. The TPA-o-Cab dyads in solutions exhibited LE or TICT emissions dependent on the solvent polarities. While, both TPA-o-Cab dyads in solid states mainly exhibited ICT emissions with high solid-state efficiency. The proposed ICT mechanism was confirmed by the experimental data and DFT calculation results. TPA-o-Cab dyads are promising skeletons for constructing efficient AIE-active solid-state emissive materials based on ICT mechanism.Experimental section
Instruments and materials
1H, 11B, and 13C NMR spectra were recorded on a Bruker Ultra Shield Plus 400 MHz NMR operating at 400, 128, and 100 MHz, respectively. All 11B chemical shifts were referenced to BF3·O(C2H5)2 (0.0 ppm) with a negative sign indicating an up-field shift. Matrix-assisted laser desorption time of flight mass spectrometry (MALDI-TOF-MS) was carried out on Bruker Daltonics Ultraflex MALDI TOF Mass Spectrometer. UV-vis absorption spectra were recorded on a PerkinElmer Lambda 35. Electrochemical behaviors were carried out by cyclic voltammetry (CV) with a standard three-electrode electrochemical cell in a 0.1 M tetra-n-butylammonium hexafluorophosphate (Bu4NPF6) in the anhydrous acetonitrile at room temperature under nitrogen atmosphere with a scanning rate of 50 mV s−1. A platinum working electrode, a glassy carbon electrode, and an Ag/AgNO3 (0.1 M) reference electrode was subjected to cyclic voltammetry. The fluorescence quantum yields were determined by full-featured steady state/transient fluorescence spectrometer FLS-920 from Edinburgh Instruments. PL decays were measured with an Edinburgh FLS-920 spectrometer. All fluorescent lifetimes were determined from the data using the Edinburgh Instruments software package. All commercially available chemicals were of A.R. grade, and all the reagents used were purchased from Sigma-Aldrich, J&K or Xiya Reagent (China). When necessary, solvents and reagents were purified using standard procedures.Synthesis and characterization
Acknowledgements
We acknowledge financial support from the National Basic Research Program of China (973 Program, 2014CB648300 and 2017YFB0404500), National Natural Science Foundation of China (No. 21404059, 21422402, 21674050), Natural Science Foundation of Jiangsu Province (No. BK20140867, BK20140060, BK20130037), and A Project Funded by the Priority Academic Program Development of Jiangsu Higher Education Institutions (Platform No. 2014-030002), National Key Research and Development Program (2016YFA0501602).Notes and references
- M. F. Hawthorne, Angew. Chem., Int. Ed., 1993, 320, 950 CrossRef.
- A. F. Armstrong and J. F. Valliant, Dalton Trans., 2007, 4240 RSC.
- F. Issa, M. Kassiou and L. M. Rendina, Chem. Rev., 2011, 111, 5701 CrossRef CAS PubMed.
- A. González-Campo, E. J. Juárez-Pérez, C. Viñas, B. Boury, R. Sillanpää, R. Kivekäs and R. núñez, Macromolecules, 2008, 41, 8458 CrossRef.
- A. Ferrer-Ugalde, E. J. Juárez-Pérez, F. Teixidor, C. Viñas and R. Núñez, Chem.–Eur. J., 2013, 19, 17021 CrossRef CAS PubMed.
- X. L. Zhang, H. M. Dai, H. Yan, W. Zou and D. Cremer, J. Am. Chem. Soc., 2016, 138, 4334 CrossRef CAS PubMed.
- Y. J. Kim, S. H. Park, Y. H. Lee, J. H. Jung, S. Yoo and M. H. Lee, Inorg. Chem., 2016, 55, 909 CrossRef CAS PubMed.
- J. Eatrda, D. H. Woen, F. S. Tham, G. M. Miyake and V. Lavallo, Inorg. Chem., 2015, 54, 5142 CrossRef PubMed.
- B. Grüner, V. Šícha, D. Hnyk, M. G. S. Londesborough and V. Císařová, Inorg. Chem., 2015, 54, 3148 CrossRef PubMed.
- J. Y. Yang and Z. W. Xie, Organometallics, 2015, 34, 2494 CrossRef CAS.
- A. Himmelspach, J. Warneke, M. Schäfer, M. Hailmann and M. Finze, Organometallics, 2015, 34, 462 CrossRef CAS.
- K. R. Wee, Y. J. Cho, S. Jeong, S. Kwon, J. D. Lee, H. Suh and S. O. Kang, J. Am. Chem. Soc., 2012, 134, 17982 CrossRef CAS PubMed.
- R. Visbal, I. Ospino, J. M. López-de-Luzuriaga, A. laguna and M. C. Gimeno, J. Am. Chem. Soc., 2013, 135, 4712 CrossRef CAS PubMed.
- A. M. Prokhorov, T. Hofbeck, R. Czerwieniec, A. F. Suleymanova, D. N. Kozhevnikov and H. Yersin, J. Am. Chem. Soc., 2014, 136, 9637 CrossRef CAS PubMed.
- Y. H. Lee, J. Park, J. Lee, S. U. Lee and M. H. Lee, J. Am. Chem. Soc., 2015, 137, 8018 CrossRef CAS PubMed.
- J. X. Guo, D. Q. Liu, J. H. Zhang, J. J. Zhang, Q. Miao and Z. W. Xie, Chem. Commun., 2015, 51, 12004 RSC.
- S. Mukherjee and P. Thilagar, Chem. Commun., 2016, 52, 1070 RSC.
- K. Nishino, H. Yamamoto, K. Tanaka and Y. Chujo, Org. Lett., 2016, 16, 4064 CrossRef PubMed.
- K. Kokado and Y. Chujo, J. Org. Chem., 2011, 76, 316 CrossRef CAS PubMed.
- K. Kokaado, A. Nagai and Y. Chjuo, Macromolecules, 2010, 43, 6463 CrossRef.
- K. Kokado and Y. Chujo, Macromolecules, 2009, 42, 9238 CrossRef CAS.
- H. Naito, Y. Morisaki and Y. Chujo, Angew. Chem., Int. Ed., 2015, 127, 5173 CrossRef.
- K.-R. Wee, Y.-J. Cho, J. K. Song and S. O. Kang, Angew. Chem., Int. Ed., 2013, 52, 9682 CrossRef CAS PubMed.
- K.-R. Wee, W.-S. Han, D. W. Cho, S. Kwon, C. Pac and S. O. Kang, Angew. Chem., Int. Ed., 2012, 51, 2677 CrossRef CAS PubMed.
- S.-Y. Kim, A.-R. Lee, G. F. Jin, Y.-J. Cho, H.-J. Son, W.-S. Han and S. O. Kang, J. Org. Chem., 2015, 80, 4573 CrossRef CAS PubMed.
- Y. H. Lee, J. Park, S.-J. Jo, M. Kim, J. Lee, S. U. Lee and M. H. Lee, Chem.–Eur. J., 2015, 21, 2052 CrossRef CAS PubMed.
- C.-F. Liu, Y. D. Jiu, J. Y. Wang, J. P. Yi, X.-W. Zhang, W.-Y. Lai and W. Huang, Macromolecules, 2016, 49, 2549 CrossRef CAS.
- Y. D. Jiu, C.-F. Liu, J. Y. Wang, W.-Y. Lai, Y. Jiang, W.-D. Xu, X.-W. Zhang and W. Huang, Polym. Chem., 2015, 6, 8019 RSC.
- L. Zhu, W. Lv, S. J. Liu, H. Yan, Q. Zhao and W. Huang, Chem. Commun., 2013, 49, 10638 RSC.
- C. Shi, H. B. Sun, X. Tang, W. Lv, H. Yan, Q. Zhao, J. X. Wang and W. Huang, Angew. Chem., Int. Ed., 2013, 52, 13434 CrossRef CAS PubMed.
- J. Mei, N. L. C. Leung, R. T. K. Kwok, J. W. Y. Lam and B.-Z. Tang, Chem. Rev., 2015, 115, 11718 CrossRef CAS PubMed.
- Y.-C. Wang, M. Gao, Y.-J. Cai, C. Zhan, Z.-J. Zhao, D.-Q. Zhang and B.-Z. Tang, Faraday Discuss., 2017, 196, 9 RSC.
- R.-R. Hu, E. Lager, A. Aguilar-Aguilar, J.-Z. Liu, J. W. Y. Lam, H. H. Y. Sung, I. D. Williams, Y.-C. Zhong, K. S. Wong, E. Peña-Cabrera and B.-Z. Tang, J. Phys. Chem. C, 2009, 113, 15845 CAS.
- Y. Sagara, S. Yamane, M. Mitani, C. Weder and T. Kato, Adv. Mater., 2016, 28, 1073 CrossRef CAS PubMed.
- J. Mei, Y.-N. Hong, J. W. Y. Lam, A.-J. Qin, Y.-H. Tang and B.-Z. Tang, Adv. Mater., 2014, 26, 5429 CrossRef CAS PubMed.
- Y.-N. Hong, J. W. Y. Lam and B.-Z. Tang, Chem. Soc. Rev., 2011, 40, 5361 RSC.
- Z.-J. Zhao, B.-R. He and B.-Z. Tang, Chem. Sci., 2015, 6, 5347 RSC.
- L. Weber, J. Kahlert, L. Bohling, A. Brockhinke, H.-G. Stammler, B. Neumann, R. A. Harder, P. J. Low and M. A. Fox, Dalton Trans., 2013, 42, 2266 RSC.
- J. C. Axtell, K. O. Kirlikovali, P. I. Djurovich, D. Jung, V. T. Nguyen, B. Munekiyo, A. T. Royappa, A. L. Rheingold and A. M. Spokoyny, J. Am. Chem. Soc., 2016, 138, 15758 CrossRef CAS PubMed.
- A. M. Prokhorov, T. Hofbeck, R. Czerwieniec, A. F. Suleymanova, D. N. Kozhevnikov and H. Yersin, J. Am. Chem. Soc., 2014, 136, 9637 CrossRef CAS PubMed.
- M. Otsuka, R. Takita, J. Kanazawa, K. Miyamoto, A. Muranaka and M. Uchiyama, J. Am. Chem. Soc., 2015, 137, 15082 CrossRef CAS PubMed.
- S.-Y. Kim, Y.-J. Cho, G. F. Jin, W.-S. Han, H.-J. Son, D. W. Cho and S. K. Kang, Phys. Chem. Chem. Phys., 2015, 17, 15679 RSC.
- Y.-J. Cho, S.-Y. Kim, M. Cho, W.-S. Han, H.-J. Son, D. W. Cho and S. O. Kang, Phys. Chem. Chem. Phys., 2016, 18, 9702 RSC.
- B. P. Dash, R. Satapathy, E. R. Gaillard, J. A. Maguire and N. S. Hosmane, J. Am. Chem. Soc., 2010, 132, 6578 CrossRef CAS PubMed.
- L. Weber, J. Kahlert, R. Brockhinke, L. Böhling, A. Brockhinke, H.-G. Stammler, B. Neumann, R. A. Harder and M. A. Fox, Chem.–Eur. J., 2012, 18, 8347 CrossRef CAS PubMed.
- Y. Morisaki, M. Tominaga and Y. Chujo, Chem.–Eur. J., 2012, 18, 11251 CrossRef CAS PubMed.
- D.-S. Tu, P. Leong, Z. H. Li, R.-R. Hu, C. Shi, K. Y. Zhang, H. Yan and Q. Zhao, Chem. Commun., 2016, 52, 12494 RSC.
- J.-F. Li, C.-L. Yang, C. Huang, Y. Wan and W.-Y. Lai, Tetrahedron Lett., 2016, 57, 1256 CrossRef CAS.
- H. Naito, K. Nishino, Y. Morisaki, K. Tanaka and Y. Chujo, Angew. Chem., Int. Ed., 2017, 129, 260 CrossRef.
- H. Naito, Y. Morisaki and Y. Chujo, Angew. Chem., Int. Ed., 2015, 54, 5084 CrossRef CAS PubMed.
- R. Furue, T. Nishimoto, I. S. Park, J. Lee and T. Yasuda, Angew. Chem., Int. Ed., 2016, 55, 7171 CrossRef CAS PubMed.
Footnotes |
| † Electronic supplementary information (ESI) available. See DOI: 10.1039/c7ra06237k |
| ‡ These authors contributed equally to this work. |
| This journal is © The Royal Society of Chemistry 2017 |