
 Open Access Article
 This Open Access Article is licensed under a Creative Commons Attribution-Non Commercial 3.0 Unported Licence
Molecular dynamics simulations of nanoscale engravings on an alkanethiol monolayer
Zhengqing Zhanga,
Yoonho Ahnb and
Joonkyung Jang *a
*a
aDepartment of Nanoenergy Engineering, Pusan National University, Busan 609-735, South Korea. E-mail: jkjang@pusan.ac.kr
bDepartment of Applied Physics, Kyung Hee University, Yongin 446-701, South Korea
First published on 17th July 2017
Abstract
Nanoscale patterns engraved on the bulk monolayer of 1-decanethiol were examined using molecular dynamics simulations. The smallest widths required for stable circular and linear engravings were found to be 3.2 and 2.4 nm, respectively. The minimum separations possible without merging for circular and linear trenches were 2.0 and 2.6 nm, respectively. These values set the ultimate the size limit and spatial resolution for engraving the alkanethiol monolayer.
Introduction
Alkanethiol monolayers with micro- or nano-scale sizes have many applications, including resists for pattern transfers,1,2 templates for biomolecules,3–6 coatings for controlling surface properties,7–9 and circuit components in molecular electronic devices.10,11 High-fidelity micro- or nano-patterns of such monolayers can be constructed using a range of techniques, such as micro-contact printing,12,13 micro-writing,1,14 dip-pen nanolithography,15,16 nano-grafting,17 and nano-shaving.18,19 These patterning methods can be categorized as either a built-up or a dig-down method. The built-up method involves the positive deposition of molecules on a specific region of a substrate, e.g., using an atomic force microscope tip15,16 or stamp.12,20 Monolayers, tens of nanometers in width, are built up on various substrates.21–23 In contrast, dig-down methods, such as nanoshaving,18,19 etch out selected regions of a monolayer fully covered with alkanethiol molecules. In this way, circular holes and linear trenches, tens of nms in width, can be engraved.19,24Simulation studies on the self-assembled monolayers of alkanethiols on gold surfaces abound. For example, Rai et al. studied the effects of the flexibility of Au–C–S bond on the structure of an alkanethiol monolayer on a gold (111) surface.25 Singh et al. studied the phase separation of a mixed monolayer of alkanethiols with different lengths on a gold nanoparticle.9 The wettability of a mixed monolayer of thiols with hydrophobic and hydrophilic terminal groups were simulated by Szöri et al.7 and by Vasumathi et al.8
Given the ever-decreasing feature sizes of these patterns, the optimal resolution of these patterns is a major research and engineering question. The stability of a thiol monolayer relies on compact and ordered intermolecular packing; alkyl chains are packed together and aligned, tilting slightly (∼25 degrees) from the surface normal. The sulfur head groups are also packed together and adsorbed strongly to a surface (typically gold). On the other hand, a finite-sized monolayer will be destabilized as its width decreases to a few nms because of the lower degree of intermolecular packing (of alkyl chains and sulfur groups). These finite-sized monolayers also have new structural features, such as periodic changes in the tilt orientation of molecules.26,27 Previously, the nanoscale monolayers of octadecanethiol (ODT) grown via a built-up method were studied using molecular dynamics (MD) simulations.23,26 The stability and structure of the nanoscale monolayers of ODT were examined by varying the widths of these monolayers to a few nms.
The ultimate size limit and spatial resolution of a nanoscale engraving on a thiol monolayer are unknown, even though these monolayers are used widely in many applications.5,28,29 Various patterns engraved on the monolayers of alkanethiol are utilized as resists for pattern transfers,1,2 the templates for biomolecules,3–6 and the circuit components in molecular electronic devices.10,11 Given the feature sizes of these negative patterns become smaller and smaller, a fundamental design principle for fabricating such patterns is desired. The present study examined circular and linear engravings on a monolayer of 1-decanethiol (DT), CH3(CH2)8CH2SH, using MD simulation. DT is a prototypical molecule previously used for controlling surface wettabilities,30,31 for molecular devices,32 for sensors,33,34 and for protective coatings.35 By analyzing the molecular packing structures and thermal stabilities of various engraved patterns, the present simulation revealed the size limits of stable circular and linear patterns engraved on a DT monolayer. How close two engraved patterns can be without coalescing into one was also studied to provide a theoretical limit to the spatial resolution of an engraved pattern on a DT monolayer.
Simulation methods
The CH3, CH2 and SH groups of DT were treated as united atoms36,37 to save simulation time without losing the accuracy of an all-atom simulation.38,39 The tilt direction of each molecule was calculated by selecting the C2, C4, and C6 atoms of DT. Three methyl groups at the tail (C8, C9, and C10) were excluded because they contain many gauche defects. The tilt direction vector of the ith molecule,![[u with combining right harpoon above (vector)]](https://www.rsc.org/images/entities/i_char_0075_20d1.gif) i, was defined as the average of the vectors from the sulfur atom to these carbon atoms (Fig. 1).36,40 The tilt angle of the ith molecule, θi, was given by the polar angle of i measured from the surface normal. The surface projection of i was designated by
i, was defined as the average of the vectors from the sulfur atom to these carbon atoms (Fig. 1).36,40 The tilt angle of the ith molecule, θi, was given by the polar angle of i measured from the surface normal. The surface projection of i was designated by ![[v with combining right harpoon above (vector)]](https://www.rsc.org/images/entities/i_char_0076_20d1.gif) i. The order parameter of the molecular orientation, Ou, was defined as41
i. The order parameter of the molecular orientation, Ou, was defined as41| Ou = 〈0.5[(i·j)2 − 1]〉i≠j, |
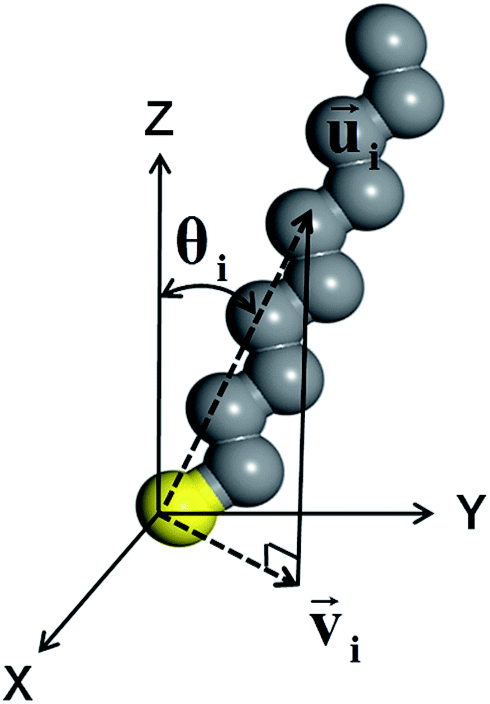 | ||
| Fig. 1 Orientation of a 1-decanethiol (DT) molecule with all-trans conformations. The tilt direction vector i for the ith molecule was calculated by selecting C2, C4, and C6 atoms. i was defined as the average of the direction vectors from the sulfur atom (in yellow) to these selected carbon atoms. i was defined as the surface (XY plane) projection of i. The tilt angle, θi, is the polar angle of i measured from the surface normal (Z direction). | ||
The bond stretching and bending angle interactions were modeled using the harmonic potentials.42 The four-atom torsion potential (C–C–C–C or C–C–C–S) was a triple cosine function of the dihedral angle φ, which has minima corresponding to the trans and gauche conformations.43 The nonbonded interatomic interactions were taken to be the Lennard–Jones (LJ) potentials,
| VAu–S(r) = De−α(r−b)[e−α(r−b) − 2], |
The MD simulations were run at a constant temperature and volume using the Berendsen thermostat.47 The MD trajectories were propagated using the velocity Verlet algorithm with a time step of 1.0 fs. The nonbonded interactions were cut off at a distance of 9.0 Å. A parallelepiped simulation box with lattice vectors of (144.85 Å, 83.63 Å, 0), (0, 167.26 Å, 0) and (0, 0, 100.0 Å).
Periodic boundary conditions were applied in the direction parallel to the surface (in X and Y direction). The gold surface, which was comprised of two layers containing 6728 atoms, was fixed in the simulation. A monolayer fully covered with 1159 DT molecules was equilibrated by running a simulation at 300 K for 3 ns. Circular or linear patterns were next carved out from the relaxed DT monolayer. These engraved monolayers were evolved in time for 40–140 ns. The DLPOLY package48 was used to implement the MD methods described above.
The present DT molecule is similar to the thiol molecule previously simulated,23,26,27,45,46 differing only in its length. We therefore employed the same force field used in our previous work. The tilt angles of the present molecules in a fully covered monolayer were 22.8° on average, agreeing with that found in a simulation using a different force field, 23.6°,49 and with the experimental values, 20–30°.50 Moreover, the present force field reproduced the packing structures of sulfur atoms of the alkanethiol monolayers measured in experiments.27 A more sophisticated force field such as the ab initio MD simulation or the reactive force field might give additional features such as the formation of a gold vacancy island51 and a dimerization of thiol molecules bridged by a gold atom.52 The present force field however captures the essential features of the overall structures of thiol monolayers, as verified in the previous studies.
Results and discussion
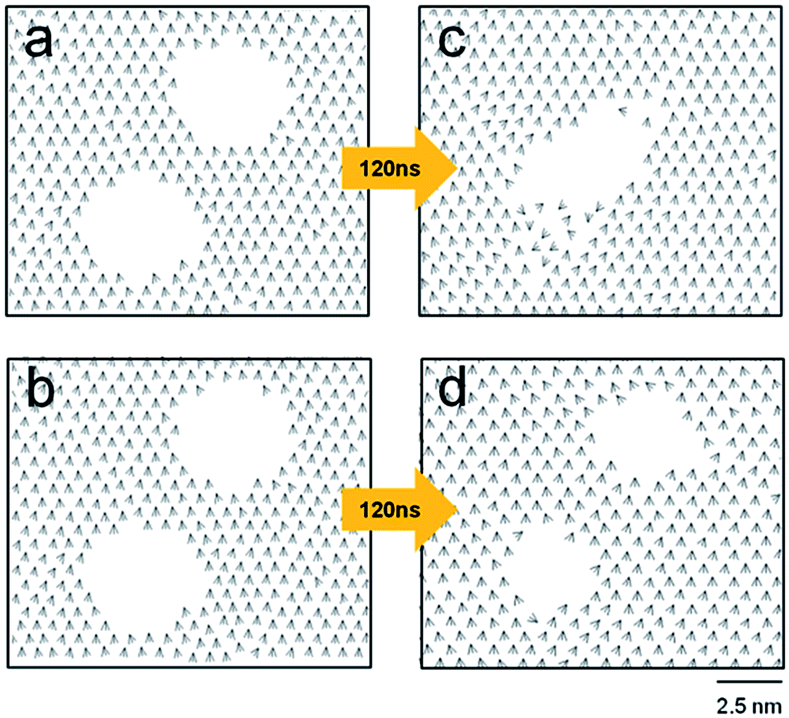
The time development of the circular engravings with diameters of 2.8, 3.0, 3.2, 3.4, and 3.6 nm on the DT monolayer was observed. Fig. 2 presents simulation snapshots and tilt direction vectors,is, of the circular holes with diameters of 3.0 (a and b) and 3.2 nm (c and d). In each panel, the MD snapshot and is are drawn in the top and bottom, respectively. The initial 3.0 nm-wide hole disappeared within 60 ns, giving rise to a fully covered monolayer that was less dense than the bulk monolayer. Note that the tilt direction vectors near the region, where the original hole existed, are disordered, as opposed to the almost perfect alignment of the tilt direction vectors in the initial monolayer. The energy of the monolayer increased slightly by 0.1 kcal mol−1 (with a standard deviation of 0.05 kcal mol−1 with time) as the hole vanished spontaneously (Fig. 2a and b). The change in the Helmholtz free energy A is given, in terms of the energy U and entropy S of the system, by ΔA = ΔU − TΔS. As the spontaneous merging or collapse of linear trenches (ΔA < 0) is accompanied by the increase in the energy (ΔU > 0), the entropy must increase to make the overall change spontaneous. Hence, this vanishing is entropy driven, which is consistent with the disorder in the tilt direction vectors shown in Fig. 2b.
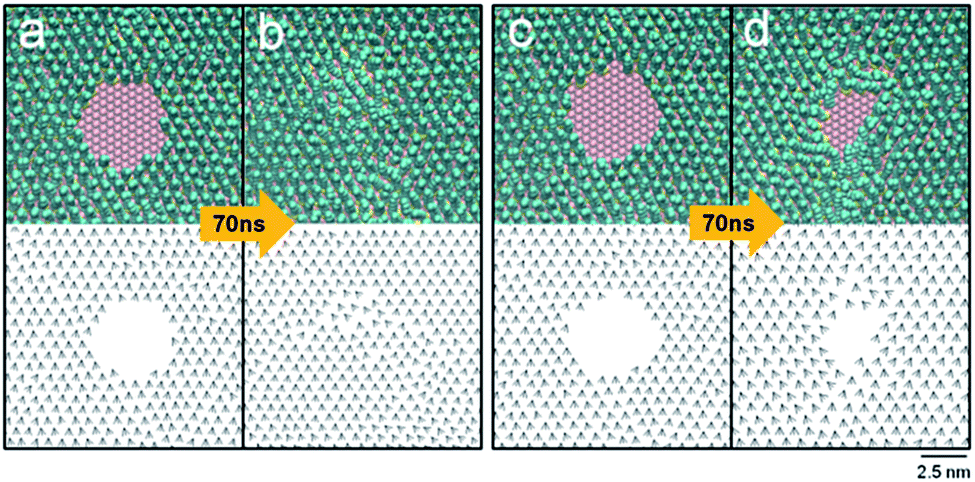 | ||
| Fig. 2 Time evolution of circular holes engraved on a DT monolayer. In each panel, the simulation snapshot (top) and projected tilt direction vectors is (bottom) are shown for times 0 and 70 ns. Drawn are the holes with initial diameters of 3.0 (a and b) and 3.2 (c and d) nm. Only a small portion of the system near the hole is shown for visual clarity. | ||
By contrast, the larger hole (of 3.2 nm in diameter) survived after 70 ns (Fig. 2c and d). Note, although the individual snapshot shown in Fig. 2d is noncircular, the shape of the pattern averaged over many snapshots is circular. The structural parameters of the hole were calculated by averaging over 500 snapshots taken from 60 to 70 ns. The average tilt angle, θ, was 24°, agreeing with the typical experimental values of the bulk monolayers (20–30°).50 The percentage of trans conformations was 97% on average. This is slightly lower than the bulk value of 99%, which was previously calculated for ODT.53 The order parameter of the molecular orientation, Ou, was 0.95, which is close to perfect ordering (1.0). These average structural parameters are dominated by the majority of molecules far away from the region, where the initial circular hole existed. In the region with radial distances less than 2.6 nm from the center of the initial hole, the average tilt angle was 25.1°, the percentage of trans conformations was 92%, and Ou was 0.85, indicating the locally disordered structure. Even larger holes with diameters of 3.4 and 3.6 nm were stable with respect to time. Therefore, a stable hole should be at least 3.2 nm in diameter. This should set the theoretical limit to the smallest circular engraving on a DT monolayer. Interestingly, this minimum size is almost twice of that of a positive pattern of an ODT monolayer, 1.9 nm.26 The present simulation considered DT, but a shorter or a longer thiol molecule, whose number of carbon atoms ranges from 6 to 24, is also utilized widely. In the case of a bulk monolayer of alkanethiol, an increased length of a thiol molecule, owing to an increased van der Waals intermolecular interaction, gives an enhanced order, packing, and stability of the resulting monolayer.10,54 The tilt angles of molecules were found to increase slightly with increasing the chain length of alkanethiol.49,55 For a nanoscale monolayer of alkanethiol, the percentage of trans conformations increased with increasing the chain length.56 For the present engraved patterns, the minimum size of such a pattern should decrease with increasing the chain length of alkanethiol, owing to the increased intermolecular interaction. Therefore, the minimum size for ODT will be smaller than the present value found for DT. An exact quantification of this decrease in the minimum size of a nanoscale engraving calls for a separate investigation and is beyond the scope of the present work.
The time-dependent areas of circular holes were investigated (Fig. 3). The area of a hole was calculated by averaging over the radial distances of sulfur atoms located at the periphery of the hole. A sulfur atom was taken to be located at the periphery if the number of neighboring sulfur atoms (within a distance < 6.0 Å) was less than 6. With increasing time, a circular hole with a diameter ≥3.2 nm decreased gradually and converged to a constant with fluctuations arising from the thermal motion of molecules. For example, the hole with a diameter of 3.2 nm converged to 453 Å2 after 60 ns (the converged value was calculated by averaging over 500 snapshots taken from 60 to 70 ns). On the other hand, the two smallest holes with diameters of 2.8 and 3.0 nm, respectively, reduced their areas abruptly at 40 and 60 ns and then decayed gradually to zero.
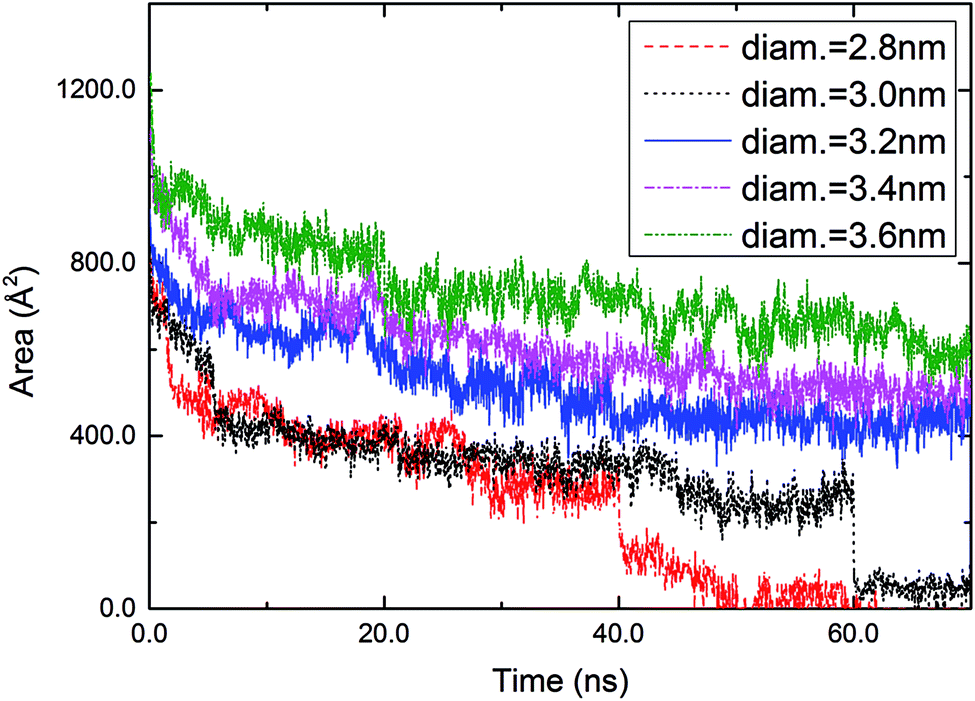 | ||
| Fig. 3 Time-dependent areas of circular holes with diameters of 2.8, 3.0, 3.2, 3.4, and 3.6 nm engraved in a DT monolayer. | ||
This study also investigated how close two circular holes can be without merging, which is relevant to the best spatial resolution of engraved patterns. Fig. 4 shows two contrasting cases: two holes with diameters of 3.2 nm coalesce (a to c), and remain separated (b to d) depending on their separation. The holes, initially 1.8 nm apart (periphery-to-periphery distance), merged into a single hole after 120 ns. In contrast, the same holes initially 2.0 nm apart remained separate even after 140 ns.
 | ||
| Fig. 4 Coalescence of circular holes at short distances. In the top (a and c) and bottom (b and d) panels, two holes with a diameter of 3.2 nm were initially separated by 1.8 and 2.0 nm (from the periphery to periphery), respectively. Drawn are the projected tilt vectors, is taken at 0 ns (a and b) and 120 ns (c and d). | ||
The merging of two circular holes was monitored by checking the tilt direction vectors, is, as shown in Fig. 5. With increasing time, the concave bridge between the holes (shown in yellow color) was distorted (Fig. 5b and c), became slender (Fig. 5d), and disappeared, eventually producing a single trench at 100 ns (Fig. 5e). Note that the molecules constituting the concave bridge are dispersed, and are mostly relocated to the periphery of the single merged trench (Fig. 5e and f). In this merging process (Fig. 5a to e), the tilt direction vectors became disordered near the periphery of the final trench. This indicates the entropy-driven nature of merging, which is also shown in the 0.18 kcal mol−1 increase in the system energy. With further evolution of time, the noncircular trench became an almost circular hole with a diameter of 4.4 nm at 120 ns.
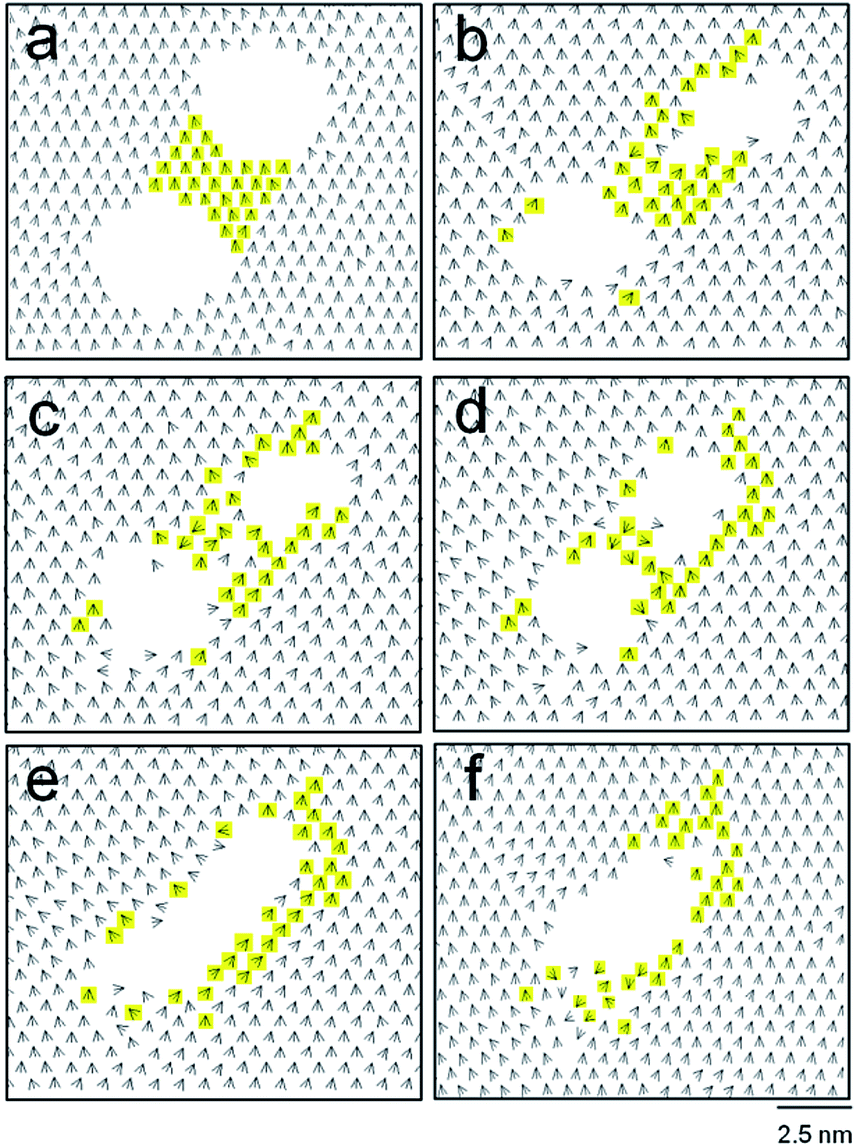 | ||
| Fig. 5 Merging process of two holes (with diameters of 3.2 nm) that are initially 1.8 nm apart. The tilt direction vector is are shown for 0 (a), 60 (b), 80 (c), 90 (d), 100 (e), and 120 (f) ns. The molecules initially bridging the two holes appear in yellow color. | ||
Linear engravings on the DT monolayer, which are also common motifs of engraved patterns, were next examined. A linear trench was taken to be parallel to one of the unit cell vectors of the gold (111) surface. This way, infinitely long trenches can be simulated by applying the periodic boundary conditions. Fig. 6 shows the time variance of the tilt direction vectors for trenches with different widths, 1.5 (a), 1.8 (b), 2.1 (c), and 2.4 (d) nm. With time, the narrowest trench was partially filled with molecules, forming three holes after 40 ns. The 1.8 nm-wide trench also collapsed after 40 ns (Fig. 6b). For the 2.1 nm-wide trench, only several DT molecules penetrated the trench, bridging the opposite sides of the trench after 60 ns. These collapses of the linear trenches were entropy-driven because the system energies increased by 0.21–0.33 kcal mol−1. With a width of 2.4 nm or larger, a linear trench was robust to thermal fluctuations after 60 ns (Fig. 6d). This sets the minimum width required for the stable lines engraved on a DT monolayer. This value (2.4 nm) is actually larger than the minimum width found for the positive (embossed) lines of an ODT monolayer, 1.7 nm.23 The structural parameters of this stable trench (2.4 nm in width) were slightly less ordered than those of the bulk monolayer. The average tilt angle, θ, percentage of trans conformations, and Ou were 24.78°, 95.74%, and 0.90, respectively. Near the peripheries of the linear trenches, however, DT molecules are more disordered than the majority of molecules far away from the trenches.
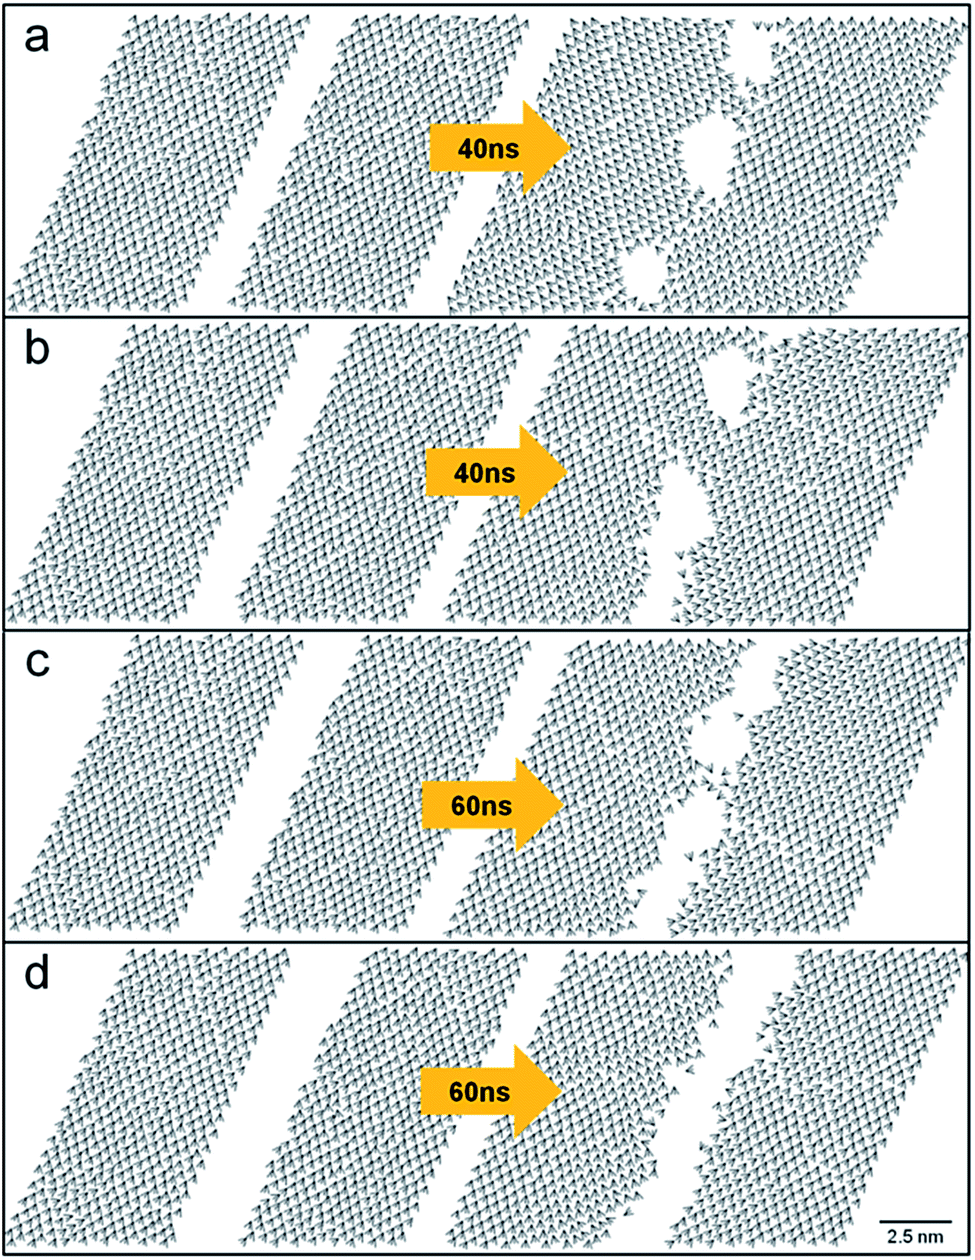 | ||
| Fig. 6 Time evolution of linear trenches on the DT monolayer with different widths, 1.5 (a), 1.8 (b), 2.1 (c), and 2.4 nm (d). Drawn are the tilt direction vectors of is. | ||
This study investigated two parallel linear trenches by varying their separation to estimate the ultimate spatial resolution of these patterns. Fig. 7 presents the cases where two linear trenches are initially 1.4, 2.0, 2.3, and 2.6 nm apart. After 40 ns, two parallel trenches merged if their initial separation was less than 2.6 nm. This merging of nearby trenches (Fig. 7a–c) were again entropy-driven because the energy of the system increased by 0.19–0.32 kcal mol−1. The monolayer with two trenches 2.6 nm apart showed robust structural parameters: the average tilt angle, θ, the percentage of trans conformations, and Ou were 24.70°, 93%, and 0.87, respectively. Therefore, the best spatial resolution of the lines engraved on the DT monolayer was 2.6 nm.
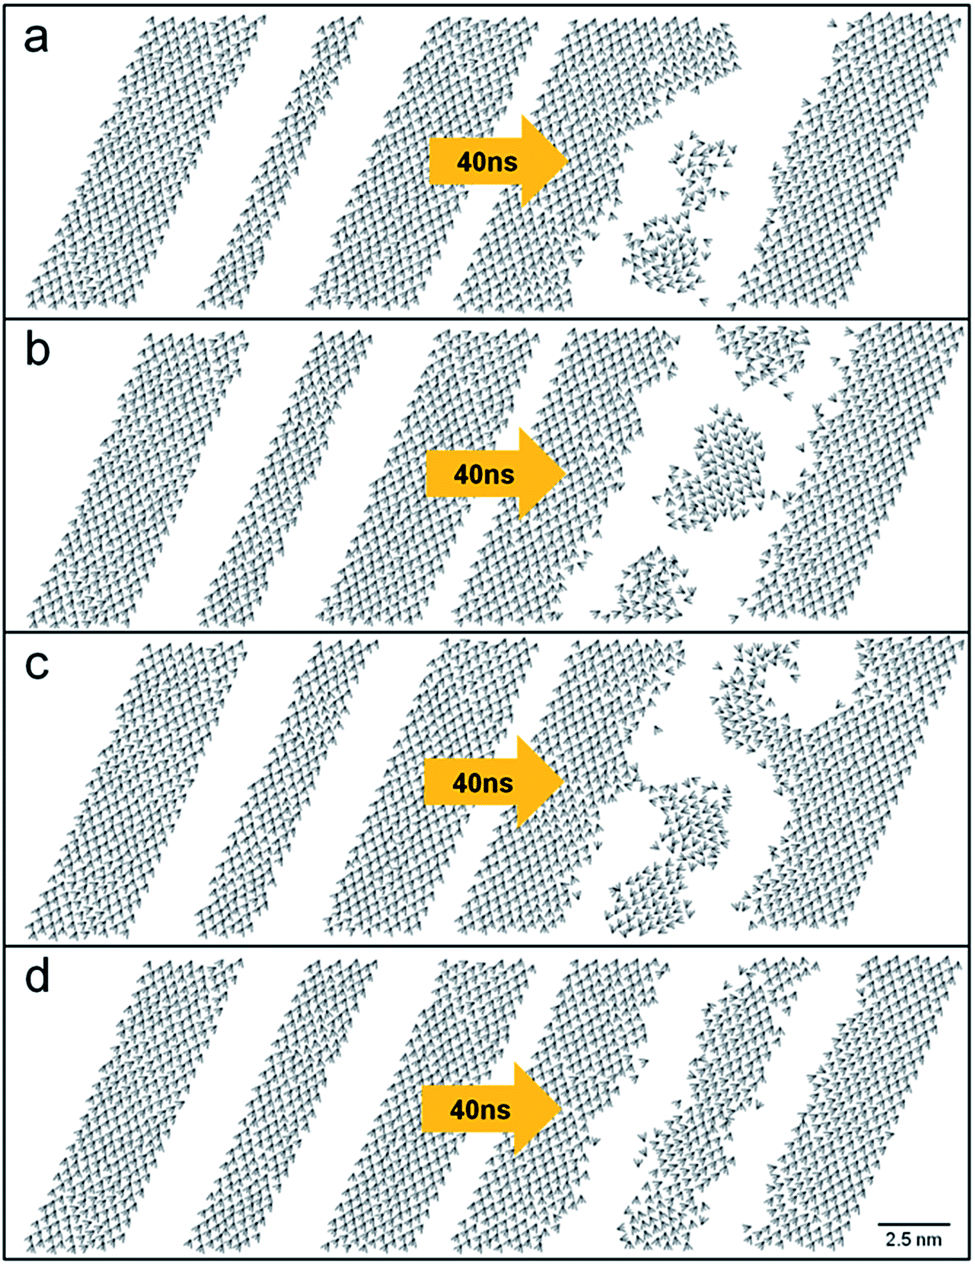 | ||
| Fig. 7 Two parallel linear engravings on the DT monolayer with various separations between them. Two 2.4 nm wide trenches were initially separated by 1.4 (a), 2.0 (b), 2.3 (c), and 2.6 (d) nm. Drawn are the tilt direction vectors of is taken at 0 (left) and 40 (right) ns. | ||
Note the collapse of an engraved pattern is a catastrophic event involving a sudden drop in its area as shown in Fig. 3. We checked whether such a catastrophic event occurs later by further running simulation for extra 30 ns, but the circular hole with a diameter of 3.2 nm in Fig. 2 remained robust. We also confirmed the two holes in Fig. 4 remain separate from each other by running simulation for extra 140 ns. Nevertheless, due to the inherent limitation of a finite MD simulation time, we cannot ensure that these patterns will survive for a much longer timescale such as >1 ms. For this purpose, an efficient sampling method such as the Monte Carlo method57,58 or accelerated MD simulation59 might be needed.
Conclusions
MD simulations were performed to investigate the nanometer-sized patterns engraved on the DT monolayer on a gold surface. This study examined circular and linear engravings, which are common motifs produced experimentally. The ultimate limits for the size and spatial resolution for these negative patterns were estimated by examining circular and linear engravings with various sizes and separations. A stable circular hole and linear trench need to have minimum widths of 3.2 and 2.4 nm, respectively; the neighboring holes and linear trenches merge if their distances are less than 2.0 and 2.6 nm, respectively. These results place theoretical limits on the ever-decreasing sizes of nanoscale engravings on alkanethiol monolayers.Conflict of interest
There are no conflicts to declare.Acknowledgements
This study was supported by the National Research Foundation of Korea (NRF) grant funded by the Korean government (NRF-2015R1A2A2A01004208, NRF-2014R1A4A1001690, and NRF-2016H1D3A1936765).Notes and references
- A. Kumar, N. L. Abbott, H. A. Biebuyck, E. Kim and G. M. Whitesides, Acc. Chem. Res., 1995, 28, 219–226 CrossRef CAS.
- L. Bumm, J. Arnold, M. Cygan, T. Dunbar, T. Burgin, L. Jones, D. Allara, J. M. Tour and P. Weiss, Science, 1996, 271, 1705–1707 CAS.
- D. C. Kim and D. J. Kang, Sensors, 2008, 8, 6605–6641 CrossRef CAS PubMed.
- Z. Zhao, I. A. Banerjee and H. Matsui, J. Am. Chem. Soc., 2005, 127, 8930–8931 CrossRef CAS PubMed.
- E. Ul-Haq, S. Patole, M. Moxey, E. Amstad, C. Vasilev, C. N. Hunter, G. J. Leggett, N. D. Spencer and N. H. Williams, ACS Nano, 2013, 7, 7610–7618 CrossRef CAS PubMed.
- K. Wadu-Mesthrige, S. Xu, N. A. Amro and G.-Y. Liu, Langmuir, 1999, 15, 8580–8583 CrossRef CAS.
- M. N. Szöri, D. J. Tobias and M. Roeselová, J. Phys. Chem. B, 2009, 113, 4161–4169 CrossRef PubMed.
- V. Vasumathi and M. N. D. Cordeiro, Chem. Phys. Lett., 2014, 600, 79–86 CrossRef CAS.
- C. Singh, P. K. Ghorai, M. A. Horsch, A. M. Jackson, R. G. Larson, F. Stellacci and S. C. Glotzer, Phys. Rev. Lett., 2007, 99, 226106 CrossRef PubMed.
- J. Zhao and K. Uosaki, Nano Lett., 2002, 2, 137–140 CrossRef CAS.
- J. M. Tour, Acc. Chem. Res., 2000, 33, 791–804 CrossRef CAS PubMed.
- Y. Xia and G. M. Whitesides, J. Am. Chem. Soc., 1995, 117, 3274–3275 CrossRef CAS.
- R. J. Jackman, J. L. Wilbur and G. M. Whitesides, Science, 1995, 269, 664–666 CAS.
- A. Kumar, H. A. Biebuyck, N. L. Abbott and G. M. Whitesides, J. Am. Chem. Soc., 1992, 114, 9188–9189 CrossRef CAS.
- C. A. Mirkin, ACS Nano, 2007, 1, 79–83 CrossRef CAS PubMed.
- R. D. Piner, J. Zhu, F. Xu, S. Hong and C. A. Mirkin, Science, 1999, 283, 661–663 CrossRef CAS PubMed.
- S. Xu, S. Miller, P. E. Laibinis and G.-Y. Liu, Langmuir, 1999, 15, 7244–7251 CrossRef CAS.
- X.-D. Xiao, G.-Y. Liu, D. H. Charych and M. Salmeron, Langmuir, 1995, 11, 1600–1604 CrossRef CAS.
- G.-Y. Liu, S. Xu and Y. Qian, Acc. Chem. Res., 2000, 33, 457–466 CrossRef CAS PubMed.
- J. C. Love, L. A. Estroff, J. K. Kriebel, R. G. Nuzzo and G. M. Whitesides, Chem. Rev., 2005, 105, 1103–1170 CrossRef CAS PubMed.
- S. Hong and C. A. Mirkin, Science, 2000, 288, 1808–1811 CrossRef CAS PubMed.
- P. Campiglio, M. Campione and A. Sassella, J. Phys. Chem. C, 2009, 113, 8329–8335 CAS.
- J. K. Saha, H. Kim and J. Jang, J. Phys. Chem. C, 2012, 116, 25928–25933 CAS.
- S. Xu and G.-y. Liu, Langmuir, 1997, 13, 127–129 CrossRef CAS.
- B. Rai, P. Sathish, C. P. Malhotra, A. Pradip and K. Ayappa, Langmuir, 2004, 20, 3138–3144 CrossRef CAS PubMed.
- J. K. Saha, Y. Ahn, H. Kim, G. C. Schatz and J. Jang, J. Phys. Chem. C, 2011, 115, 13193–13199 CAS.
- Y. Ahn, J. K. Saha, G. C. Schatz and J. Jang, J. Phys. Chem. C, 2011, 115, 10668–10674 CAS.
- H. H. Cao, N. Nakatsuka, A. C. Serino, W.-S. Liao, S. Cheunkar, H. Yang, P. S. Weiss and A. M. Andrews, ACS Nano, 2015, 9, 11439–11454 CrossRef CAS PubMed.
- E. A. Josephs and T. Ye, J. Am. Chem. Soc., 2010, 132, 10236–10238 CrossRef CAS PubMed.
- C. Xu, S. Peng, G. Qiao and X. Zhang, Langmuir, 2016, 32, 11197–11202 CrossRef CAS PubMed.
- S.-S. Li, L.-P. Xu, L.-J. Wan, S.-T. Wang and L. Jiang, J. Phys. Chem. B, 2006, 110, 1794–1799 CrossRef CAS PubMed.
- C. Chu, J.-S. Na and G. N. Parsons, J. Am. Chem. Soc., 2007, 129, 2287–2296 CrossRef CAS PubMed.
- O. Lyandres, N. C. Shah, C. R. Yonzon, J. T. Walsh, M. R. Glucksberg and R. P. Van Duyne, Anal. Chem., 2005, 77, 6134–6139 CrossRef CAS PubMed.
- L. Y. S. Lee, T. C. Sutherland, S. Rucareanu and R. B. Lennox, Langmuir, 2006, 22, 4438–4444 CrossRef CAS PubMed.
- S. Chen, L.-P. Xu, S. Pradhan and W. Chen, Solid State Commun., 2007, 144, 124–127 CrossRef CAS.
- J. Hautman and M. L. Klein, J. Chem. Phys., 1989, 91, 4994–5001 CrossRef CAS.
- P. K. Ghorai and S. C. Glotzer, J. Phys. Chem. C, 2007, 111, 15857–15862 CAS.
- W. Mar and M. L. Klein, Langmuir, 1994, 10, 188–196 CrossRef CAS.
- J. P. Bareman and M. L. Klein, J. Phys. Chem., 1990, 94, 5202–5205 CrossRef CAS.
- R. Bhatia and B. J. Garrison, Langmuir, 1997, 13, 4038–4043 CrossRef CAS.
- S. Fujiwara and T. Sato, J. Chem. Phys., 1999, 110, 9757–9764 CrossRef CAS.
- W. L. Jorgensen, D. S. Maxwell and J. Tirado-Rives, J. Am. Chem. Soc., 1996, 118, 11225–11236 CrossRef CAS.
- W. L. Jorgensen, J. D. Madura and C. J. Swenson, J. Am. Chem. Soc., 1984, 106, 6638–6646 CrossRef CAS.
- X. Zhao, Y. Leng and P. T. Cummings, Langmuir, 2006, 22, 4116–4124 CrossRef CAS PubMed.
- Z. Zhang, H. Kim, J. Noh, Y. Ahn, J. Y. Son and J. Jang, Nanoscale, 2016, 8, 1133–1139 RSC.
- Z. Zhang, Y. Ahn, J. Y. Son and J. Jang, J. Phys. Chem. C, 2016, 120, 15509–15513 CAS.
- H. J. Berendsen, J. P. M. Postma, W. F. van Gunsteren, A. DiNola and J. Haak, J. Chem. Phys., 1984, 81, 3684–3690 CrossRef CAS.
- W. Smith, C. Yong and P. Rodger, Mol. Simul., 2002, 28, 385–471 CrossRef CAS.
- L. Ramin and A. Jabbarzadeh, Langmuir, 2011, 27, 9748–9759 CrossRef CAS PubMed.
- M. D. Porter, T. B. Bright, D. L. Allara and C. E. Chidsey, J. Am. Chem. Soc., 1987, 109, 3559–3568 CrossRef CAS.
- G. S. Longo, S. K. Bhattacharya and S. Scandolo, J. Phys. Chem. C, 2012, 116, 14883–14891 CAS.
- V. Vasumathi, J. L. C. Fajin and M. N. D. S. Cordeiro, J. Phys.: Conf. Ser., 2014, 5, 1441011 Search PubMed.
- H. Kim, J. K. Saha, Z. Zhang, J. Jang, M. A. Matin and J. Jang, J. Phys. Chem. C, 2014, 118, 11149–11157 CAS.
- N. Prathima, M. Harini, N. Rai, R. Chandrashekara, K. Ayappa, S. Sampath and S. Biswas, Langmuir, 2005, 21, 2364–2374 CrossRef CAS PubMed.
- Y. Wang, J. Solano Canchaya, W. Dong, M. Alcami, H. Busnengo and F. Martin, J. Phys. Chem. A, 2014, 118, 4138–4146 CrossRef CAS PubMed.
- J. K. Saha, M. Yang and J. Jang, Bull. Korean Chem. Soc., 2013, 34, 3790–3794 CrossRef CAS.
- E. O. Fetisov and J. I. Siepmann, J. Phys. Chem. B, 2016, 120, 1972–1978 CrossRef CAS PubMed.
- O. Alexiadis, K. C. Daoulas and V. G. Mavrantzas, J. Phys. Chem. B, 2008, 112, 1198–1211 CrossRef CAS PubMed.
- H. Morgner, Langmuir, 1997, 13, 3990–4002 CrossRef CAS.
| This journal is © The Royal Society of Chemistry 2017 |