 Open Access Article
Creative Commons Attribution 3.0 Unported Licence
Electricity generation in a microbial fuel cell using yogurt wastewater under alkaline conditions
Haiping Luo,
Guofang Xu,
Yaobin Lu,
Guangli Liu *,
Renduo Zhang,
Xiao Li,
Xiyuan Zheng and
Meihan Yu
Guangdong Provincial Key Laboratory of Environmental Pollution Control and Remediation Technology, School of Environmental Science and Engineering, Sun Yat-sen University, Guangzhou, 510275, China. E-mail: liugl@mail.sysu.edu.cn
First published on 27th June 2017
Abstract
The aim of this study was to investigate the feasibility of electricity generation in a microbial fuel cell (MFC) using yogurt wastewater as the substrate under alkaline conditions. Different initial COD concentrations of yogurt wastewater (i.e., 1.0 ± 0.1, 2.0 ± 0.1, 5.0 ± 0.5, 8.0 ± 0.6, and 13.0 ± 1.0 g L−1) at pH 10.5 were tested in the single-chamber air-cathode MFC. The maximum power density reached 1043 ± 100 mW m−2, which was much higher than those previously reported using food-processing wastewater under alkaline conditions. The COD and NH4-N removal efficiencies were more than 87% and 74%, respectively. With the increase of COD concentration in yogurt wastewater, the internal resistance in the MFC increased but the bacterial viability in the anode biofilm decreased, resulting in a decrease of electricity generation in the MFC. Geoalkalibacter with a relative abundance of 12.9–49.9% dominated the bacterial community in the anode biofilm. Our results should be useful in expanding the application scope of MFCs in wastewater treatment under alkaline conditions.
1. Introduction
High electricity consumption is required in many wastewater treatment processes, which accounts for ∼3% of the total electricity usage in the USA.1 In a typical municipal wastewater treatment plant, the chemical energy in the organic compounds of wastewater is much higher than the electricity needed for the wastewater treatment (∼0.6 kW h m−3).1 In the microbial fuel cell (MFC), electrochemically active bacteria (EAB) in the anode can convert the chemical energy in organic compounds directly into electricity.2–4 The wastewater in the food-processing industries has abundant organics with easy biodegradability, thus it is possible to generate electricity from the food-processing wastewater using a MFC.5The pH value in the anolyte is crucial to electricity generation of the MFC. It has been reported that alkaline conditions in anolyte can enhance electricity generation in the MFC.6–8 The maximum power density in the MFC with pH 9.0 anolyte was 38.6% higher than that with pH 7.0 using acetate as substrate.6 The coulombic efficiency (CE) increased from 43 ± 10% at neutral pH to 60 ± 5% at pH 9.5 in the MFC fed with acetate. With anolyte pH increase from 7.0 to 9.5, the relative abundance of Geobacter decreased from 79% to less than 1% and Geoalkalibacter increased from less than 1% to 21%.9 In the air-cathode MFC with glucose as substrate, the maximum power density increased from 213 to 235 mW m−2 with pH in the solution increased from 10.0 to 11.0.7 Previous studies also demonstrated that electricity could be produced in the MFC inoculated with marine consortia even with anolyte pH of 13 (7 mW m−2).8 Many EABs can keep high activities under alkaline conditions.10–13 The maximum power density in the MFC inoculated with Shewanella oneidensis MR-1 increased by ∼2.5 times when the analytic pH increased from 7.0 to 9.0 (102 vs. 40 mW m−2) using 5% LB medium and 95% M9 minimal medium.10 Using acetate as the substrate with pH = 9.3, halophilic Geoalkalibacter subterraneus DSM 23483 and alkaliphilic Geoalkalibacter ferrihydriticus DSM 17813 could produce electricity 5000–8300 and 2400–3300 mA m−2, respectively.11 The MFC with Pseudomonas alcaliphila strain MBR could produce the maximum current density of 71.0 mA m−2 at pH 9.5 with sodium citrate as the substrate.12 Halanaerobium hydrogeniformans in the MFC could generate a maximum current density of 12.5 mA m−2 at pH 11.0 with formate as the substrate.13 However, the above studies of the MFCs were based on individual substrates or ideal media. Information is not available about MFC operation in real wastewater treatment under alkali conditions, different food-processing industry wastewaters have been tested in the MFC and performance of the MFC varies greatly with the wastewater compositions.5 The maximum power density of 111 mW m−2 was produced in the MFC using red wine lees with pH 7.0 ± 0.2.14 The MFC produced the maximum power density of 669 mW m−2 with brewery wastewater as the substrate at pH 6.5 ± 0.4.15 In the slaughterhouse wastewater treatment, the maximum power density of 578 mW m−2 was observed in the MFC at pH 7.8.16 However, food-industry wastewater with higher pH values (e.g., >10.0) has not been tested in the MFC as far as we know. It is important to ascertain the performance of MFC using real wastewater with high pH values to expand the application field of MFC.
During the bottle washing procedure in many food-processing industries, such as beverage or yogurt production, the usage of sodium hydroxide result in pH values in wastewater >11.0.17 The chemical oxygen demand (COD) in the yogurt wastewater can reach 136 g L−1.5 It should be unique to test the performance of MFC using the yogurt wastewater as the substrate with high COD concentration as well as high pH value.17.
The objective of this study is to explore the feasibility of electricity generation in the MFC using the yogurt wastewater as the substrate under the alkali condition. The performance of MFC was tested in terms of power density, internal resistance, COD removal, etc. The bacterial community in the anode biofilm was analyzed and discussed.
2. Materials and methods
2.1 Yogurt wastewater
The yogurt wastewater was taken from the bottled yogurt production line using returnable glass jars in a local dairy. The sediment pretreatment was used to remove the suspended solids in the wastewater. Because the yogurt wastewater was discharged in the batch mode in the factory, the quality of the yogurt wastewater was fluctuated greatly. The characteristics of the original yogurt wastewater was in a range of pH = 6–11, conductivity 1.5–4.0 mS cm−1, COD 0.8–14 g L−1, ammonia 4.0–60 mg L−1, total nitrogen (TN) 20–350 mg L−1.2.2 MFC construction and operation
The single-chamber air-cathode MFC was made of Perspex with a hole of 3 cm in diameter and 4 cm long.18,19 The effective volume was 28 mL in the MFC with three pieces of a stainless steel fiber felt (20 μm, 316 L SS felt, Lier Filter Ltd., China) as the anode. Each piece had a projected surface area of 7 cm2 (2.98 cm in diameter) and was heated at 600 °C for 15 min before use.20 The air-cathode was prepared using a rolling method with activated carbon (SPC-01, Xinsen Carbon Co. Ltd., Fujian, China) as the catalyst and the effective projected surface area of cathode was 7 cm2.21 An external resistor of 1000 Ω was used in the MFC throughout all the tests.The matured MFCs fed by 1 g L−1 acetate and 50 mM phosphate buffer solution were used to test the yogurt wastewater. The reactors were refreshed using a diluted yogurt wastewater with COD of 1 g L−1 at pH = 8.5. After a stabilized performance was reached, pH was gradually increased to 10.5. The total acclimation period was about one month when the electricity generation in the MFC became stable and repeatable at pH = 10.5. Then yogurt wastewaters with different COD values (i.e., 1.0 ± 0.1, 2.0 ± 0.1, 5.0 ± 0.5, 8.0 ± 0.6, 13.0 ± 1.0 g L−1) were tested in the MFC, respectively, which were prepared using deionized water and the raw yogurt wastewater with a final volume of 28 mL. To improve the conductivity and to control initial pH value of wastewater to 10.5 in the anolyte, 50 mM carbonate buffer solution was used throughout all the tests. The conductivity in the solution was kept at ∼6 mS cm−1 in all the tests. The experiments were carried out in duplicate at 30 ± 1 °C.
2.3 Analysis and calculations
The EIS measurements were carried out using an electrochemical station (Chenhua 660C, China). The anode and cathode electrodes were used as the counter and working electrodes, respectively. The calomel electrode (CHI150, Chenhua Co. Ltd, Shanghai, China) was used as the reference electrode. A frequency range of 100 kHz to 100 mHz with a sinusoidal perturbation of 5 mV amplitude were used in all the EIS measurements. The total internal resistance in the MFC was divided into the ohmic and charge transfer resistances. The ohmic resistance (RΩ) and charge transfer resistance (Rct) were analyzed with Nyquist plot and simulated by the Zsimp Win software.19,22COD concentration was determined using the standard titration method.23 The conductivity and pH were measured using a pH meter (Mettler Toledo, FE 30, Switzerland) and a conductivity meter (Mettler Toledo, FE 30K, Switzerland), respectively. Output voltages in the MFC were obtained by measuring the voltage across the external resistance of 1000 Ω using a data acquisition system (2700, Keithley Instruments, Inc., USA). The power density and coulombic efficiency (CE) were calculated as previously reported.18 The polarization curve was obtained by changing the external resistances from 100 to 3000 Ω.24
2.4 The anode biofilm analysis
Samples in the anode biofilms were stained with LIVE/DEAD Baclight staining kit (Molecular Probes, Invitrogen), and visualized using the Confocal laser scanning microscopy (CLSM, LSM 700, Zeiss) by distinguishing bacteria with high (green color) or low (red color) growth activities.25,26 The biomass measurements on the anode biofilm were carried out using Coomassie light blue staining.22The composition of bacterial communities in the anode biofilms were evaluated after at least 3 cycles of operation with a stable electricity generation. The total DNA of anode sample was extracted using DNA kit (12888-50, MOBIO, USA) according to manufacturer's protocol. The V3–V4 region of the 16S rDNA gene was amplified with the 338F (ACTCCTACGGGAGGCAGCA) and 806R (GGACTACVSGGGTATCTAAT). The PCR products were examined by 1% agarose gel electrophoresis and then sequenced on the Illumina Miseq platform (Majorbio Bio-Pharm Technology Co., Ltd, Shanghai, China). The obtained results (raw sequencing reads) were submitted to the NCBI SRA database (accession number: SRP108185). The Shannon index was calculated to determine the microbial diversity in the anode biofilm.22
3. Results and discussion
3.1 Performance of MFCs under alkali condition
The maximum power densities in the MFC decreased with the increase of COD concentrations in the anolyte. The maximum power density was 1043 ± 104 and 996 ± 100 mW m−2 in the MFC with 1.0 ± 0.1 g L−1 and 2.0 ± 0.1 g L−1 of COD in the anolyte, respectively (Fig. 1A). The maximum power densities with 5.0 ± 0.5, 8.0 ± 0.6, 13.0 ± 1.0 g L−1 COD values in the anolyte were only 69% (722 ± 70 mW m−2), 54% (567 ± 60 mW m−2), 21% (221 ± 20 mW m−2) of that with 1.0 ± 0.1 g L−1 COD, respectively. Correspondingly, the internal resistances in the MFCs gradually increased from 113 ± 10 Ω (1.0 ± 0.1 g L−1 COD) to 464 ± 40 Ω (13.0 ± 1.0 g L−1 COD) with the increase of COD concentrations (Fig. 1B).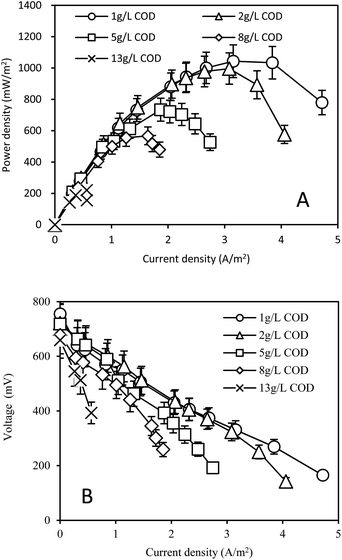 | ||
| Fig. 1 (A) Power density and (B) voltage outputs in the MFC fed by yogurt wastewater with different COD concentrations. | ||
The CEs and operation time per cycle in the MFC with different COD concentrations of yogurt wastewater in the anolyte are shown in Fig. 2. The high COD concentrations in the anolyte resulted in low CEs of the MFC. The CEs decreased from 23 ± 3% to 5 ± 1% with the COD increasing from 1.0 ± 0.1 to 13.0 ± 1.0 g L−1. The CEs were 16 ± 2%, 12 ± 2%, and 10 ± 2% for COD of 2.0 ± 0.1, 5.0 ± 0.5, and 8.0 ± 0.6 g L−1, respectively. The operation time per cycle in the MFC was 44 ± 8, 60 ± 8, 150 ± 15, 174 ± 18 and 240 ± 25 h when the COD concentration of the yogurt wastewater in the anolyte was 1.0 ± 0.1, 2.0 ± 0.1, 5.0 ± 0.5, 8.0 ± 0.6, and 13.0 ± 1.0 g L−1, respectively.
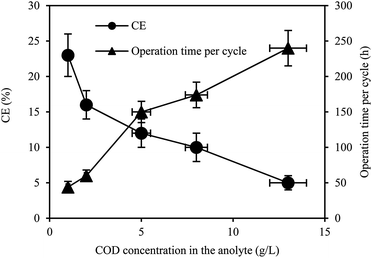 | ||
| Fig. 2 The CE and operation time per cycle in the MFC fed by yogurt wastewater with different COD concentrations. | ||
The COD, NH4-N, and TN removals in the MFCs were determined using different yogurt wastewaters as shown in Table 1. The COD removals were higher than 85% with the different initial COD concentrations used in the MFC. Efficient denitrification occurred in the MFC under different initial concentrations of NH4-N and TN. The NH4-N removal reached 96 ± 4% within 44 ± 8 h under the initial NH4-N concentration of 4.3 ± 0.5 mg L−1. With the initial NH4-N concentration increased to 50.0 ± 5.0 mg L−1, 75 ± 8% of the NH4-N removal was achieved within 240 ± 25 h. The TN removal was 69 ± 3% within 44 ± 8 h under the initial TN concentration of 26 ± 4 mg L−1. The final TN concentration gradually increased from 14 ± 3 to 51 ± 5 mg L−1 with the increase of the initial TN concentrations from 49 ± 6 to 303 ± 30 mg L−1. Nevertheless, the TN removals could be kept at more than 69% throughout all the tests. Simultaneous nitrification and denitrification, volatilization, and assimilation could occur in the single-chamber air-cathode MFC, resulting in high nitrogen removal as previously reported.27,28
| Initial (g L−1) | Final (g L−1) | Removal (%) | Initial (mg L−1) | Final (mg L−1) | Removal (%) | Initial (mg L−1) | Final (mg L−1) | Removal (%) |
|---|---|---|---|---|---|---|---|---|
| COD | NH4-N | TN | ||||||
| 1.0 ± 0.1 | 0.12 ± 0.05 | 88 ± 7 | 4.3 ± 0.5 | 0.2 ± 0.1 | 96 ± 4 | 26 ± 4 | 8 ± 1 | 69 ± 3 |
| 2.0 ± 0.1 | 0.20 ± 0.05 | 89 ± 8 | 8.2 ± 0.7 | 0.7 ± 0.4 | 91 ± 6 | 49 ± 6 | 14 ± 3 | 72 ± 3 |
| 5.0 ± 0.5 | 0.28 ± 0.05 | 95 ± 5 | 22.6 ± 3.0 | 2.7 ± 0.5 | 88 ± 9 | 129 ± 14 | 40 ± 4 | 69 ± 2 |
| 8.0 ± 0.6 | 0.29 ± 0.05 | 96 ± 4 | 35.8 ± 4.0 | 3.2 ± 0.5 | 91 ± 6 | 204 ± 20 | 46 ± 5 | 77 ± 2 |
| 13.0 ± 1.0 | 0.40 ± 0.6 | 97 ± 3 | 50.0 ± 5.0 | 12.5 ± 1.5 | 75 ± 8 | 303 ± 30 | 51 ± 5 | 83 ± 2 |
Many factors could affect the MFC performance, including types of substrate, reactor configuration, etc., thus it was difficult to make full assessment on our results. A preliminary comparison between our results and those in the literature was carried out (Table 2). The maximum power density in our MFC with yogurt wastewater was much higher than those previously reported with yogurt wastewater or dairy wastewater. With the same initial COD of 1.0 g L−1 under pH 10.0, the maximum power density yogurt wastewater in our study was 6.47 times higher than that with dairy wastewater, (1043 ± 100 vs. 161 mW m−2).17 With the similar initial COD of 8.0 g L−1, the maximum power density in our MFC was 12.9 times higher than that using yogurt wastewater under pH 6.15 (567 ± 50 vs. 44 mW m−2).5. The performance of our MFC with yogurt wastewater was also comparable to that with acetate, glucose, etc.6–8 The maximum power density of our MFC was 1.25 and 34.1 times higher than that with acetate as the substrate under pH 9.5 (1043 ± 100 vs. 833 mW m−2), and acetate + petone under pH 11.0 (1043 ± 100 vs. 30 mW m−2), respectively. In addition, it was the first time to report electricity generation in the MFC with real wastewater under pH 10.5 as far as we know.
| Substrate | MFC configuration | pH in the anolyte | Influent COD concentration (g L−1) | COD removal (%) | Maximum power density (mW m−2) | CE (%) | Ref. |
|---|---|---|---|---|---|---|---|
| a 20–30 mM acetate.b 1g L−1 acetate and 1.25 g L−1 petone. | |||||||
| Acetate | Single-chamber air-cathode MFC | 9.5 | —a | — | 833 | — | 6 |
| Glucose + yeast extract | Single-chamber air-cathode MFC | 10.0 | 2.2 | 81 ± 7 | 213 | 19.8 ± 2.3 | 7 |
| Acetate + petone | Dual-chamber MFC | 11.0 | —b | 42 | 30 | — | 8 |
| Dairy wastewater | Dual-chamber MFC | 7.0 | 1.6 | 91 | 192 | 17 | 29 |
| Dairy wastewater | Single-chamber MFC | 7.0 | 3.7 | 95 | ∼36 (1.10 W m−3) | 7.5 | 30 |
| Dairy wastewater | Single-chamber MFC with spiral anode | ∼10.0 | 1.0 | 91 | 161 (20.2 W m−3) | 27 | 17 |
| Dairy industry wastewater | Dual-chamber MFC | 7.0 | 3.6 | 90 | 621 | 37 | 31 |
| Yogurt waste | Dual-chamber MFC | 6.15 | 8.2 | — | 44 | — | 5 |
| Yogurt wastewater | Single-chamber air-cathode MFC | 10.5 | 1.0 ± 0.1 | 88 ± 7 | 1043 ± 100 | 23 ± 3 | This study |
| 2.0 ± 0.1 | 89 ± 8 | 997 ± 100 | 16 ± 2 | ||||
| 5.0 ± 0.5 | 95 ± 5 | 734 ± 75 | 12 ± 2 | ||||
| 8.0 ± 0.6 | 96 ± 4 | 567 ± 50 | 10 ± 2 | ||||
| 13.0 ± 0.1 | 97 ± 3 | 221 ± 22 | 5 ± 1 | ||||
3.2 EIS measurements on the MFCs with different yogurt wastewater
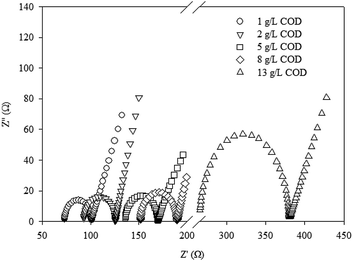
The internal resistances in the MFCs with different yogurt wastewaters were determined by the EIS measurements (Fig. 3). The total internal resistances in the MFC were in the following order: 101 ± 10 Ω < 127 ± 13 Ω < 172 ± 18 Ω < 190 ± 20 Ω < 380 ± 40 Ω with increase in COD concentration of the feed from 1.0 ± 0.1, 2.0 ± 0.1, 5.0 ± 0.5, 8.0 ± 0.6, to 13.0 ± 1.0 g L−1. The change of the total internal resistances based on the EIS measurements was consistent with that determined by the polarization curves, but with some differences between these methods.32 The ohmic resistance in the MFC had the same order as the total internal resistance as follows: 73 ± 8 Ω < 93 ± 10 Ω < 136 ± 15 Ω < 152 ± 15 Ω < 265 ± 25 Ω with increase in COD concentration of the feed from 1.0 ± 0.1, 2.0 ± 0.1, 5.0 ± 0.5, 8.0 ± 0.6, to 13.0 ± 1.0 g L−1. The charge transfer resistances in the MFC were increased from 28 ± 4 Ω to 114 ± 15 Ω with increase in COD concentration of the feed from 1.0 ± 0.1 to 13.0 ± 1.0 g L−1. High charge transfer resistance in the MFC indicated that the electrochemical activity of the anode biofilm was decreased.33 Limiting the electrochemical activity of the anode biofilm, higher concentrations of yogurt wastewater increased the internal resistance in the MFC.3.3 CLSM measurements on the anode biofilms of MFCs
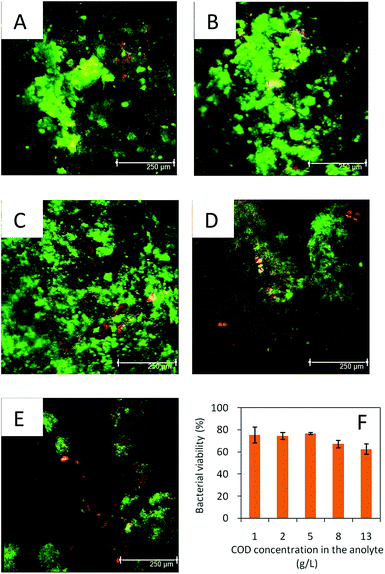
The bacterial viability in the anode biofilm was determined using the CLSM measurement (Fig. 4). Similar bacteria viability (about 75 ± 7%) was observed under the initial COD concentrations from 1.0 ± 0.1 to 5.0 ± 0.5 g L−1 in the yogurt wastewater. However, the bacteria viability decreased to 67 ± 3% and 63 ± 5% under the initial COD concentrations of 8.0 ± 0.6 and 13.0 ± 1.0 g L−1, respectively. The bacterial viability can change from 20% to 95% in the anode biofilm in the MFC, depending on the substrate, exoelectrogens, etc.25,26Our results indicated that high concentration of organics could inhibit the bacterial activity. The biomass on the anode biofilm slightly increased from 1.75 ± 0.14 mg g−1 under the initial COD of 1.0 ± 0.1 g L−1 to 1.91 ± 0.13 and 2.25 ± 0.11 mg g−1 under the COD values of 2.0 ± 0.1 and 5.0 ± 0.5 g L−1 in the yogurt wastewater, respectively. With the increase of the initial COD from 8.0 ± 0.6 to 13.0 ± 1.0 mg L−1, the anode biomass decreased from 1.89 ± 0.08 to 1.65 ± 0.10 mg g−1. Such high concentrations of organics may inhibit the bacterial growth on the anode and decrease the electricity generation in the MFC.34
3.4 Bacterial community in the anode biofilm of MFC
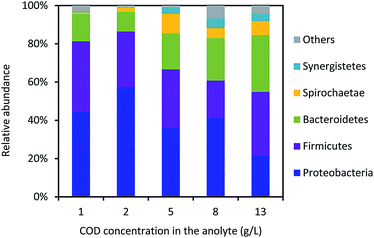
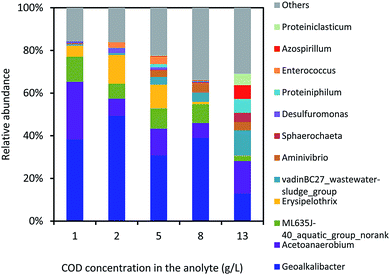
The bacterial community in the anode biofilm was identified in the phyla level (Fig. 5). The relative abundance of Proteobacteria in the anode biofilm was 44.5%, 57.5%, 36.2%, 41.3% and 21.5% using the yogurt wastewater with COD values of 1.0 ± 0.1, 2.0 ± 0.1, 5.0 ± 0.5, 8.0 ± 0.6 and 13.0 ± 1.0 g L−1, respectively. The relative abundance of Firmicutes was kept in a range of 19.5–36.8% with the different yogurt wastewaters in the MFC. Bacteroidetes had the lowest relative abundance of 14.3% with 1.0 ± 0.1 g L−1 COD and the highest value of 29.7% with 13.0 ± 0.1 g L−1 COD in the yogurt wastewater. With the increase of the initial COD concentrations, the relative abundance of Bacteroidetes gradually increased from 10.2% (2.0 ± 0.1 g L−1 COD) to 22.2% (8.0 ± 0.6 g L−1 COD), indicating that Bacteroidetes preferred to grow with higher concentrations of organics. Spirochaetae and Synergistetes were identified with the relative abundance of 7.3% and 4.0%, respectively, in the MFC using 13.0 ± 1.0 g L−1 COD in the yogurt wastewater. But both Spirochaetae and Synergistetes were less than 1% in the MFC using 1.0 ± 0.1 g L−1 COD in the yogurt wastewater.The bacterial community in the anode biofilm was identified in the genus level as shown in Fig. 6. Geoalkalibacter dominated the bacterial community in the anode biofilm throughout all the tests. The relative abundance of Geoalkalibacter was 37.6%, 49.9%, 30.1%, 39.0% and 12.9% in the anode biofilm in the MFC with COD values of 1.0 ± 0.1, 2.0 ± 0.1, 5.0 ± 0.5, 8.0 ± 0.6, and 13.0 ± 1.0 g L−1 in the yogurt wastewater, respectively. The relative abundance of Acetoanaerobium was in a range of 6.9–26.4% in the anode biofilm of MFCs fed by the different COD concentrations in the yogurt wastewater. With the increase of the initial COD concentrations from 1.0 ± 0.1 to 13.0 ± 1.0 g L−1 in the yogurt wastewater, the relative abundance of vadinBC27_wastewater-sludge_group increased from 0.6% to 11.9%, whereas the genus ML635J-40_aquatic_group_norank decreased from 11.5% to 2.3%. Proteiniphilum and Proteiniclasticum had the highest relative abundance of 6.5% and 5.4%, respectively, with 13.0 ± 1.0 g L−1 COD in the yogurt wastewater among all the tests. The Shannon indexes were 2.20, 2.22, 2.73, 2.74, and 3.22 in the MFC with COD values of 1.0 ± 0.1, 2.0 ± 0.1, 5.0 ± 0.5, 8.0 ± 0.6, and 13.0 ± 1.0 g L−1 in the yogurt wastewater, respectively. The result indicated that higher concentrations of yogurt wastewater could result in higher microbial diversity in the anode biofilm.
Geoalkalibacter is capable of electricity generation and prefers to grow with acetate as substrate under alkaline conditions.9,11 Acetoanaerobium is able to produce acetate and has been widely reported in the anodic biofilm of the MFCs.35,36 VadinBC27_wastewater-sludge_group has been identified in the MFC fed with glucose, propyl alcohol or methanol,37 or the mesophilic anaerobic digester treating food waste,38 indicating that various organics may be degraded by vadinBC27_wastewater-sludge_group. ML635J-40_aquatic_group_norank is found to survive under an extreme alkaline salinity condition.39 Proteiniphilum and Proteiniclasticum are able to degrade the amino acids under anaerobic condition,38,40,41 indicating that high concentration of yogurt wastewater may boost the growth of Proteiniphilum and Proteiniclasticum. Our bacterial community in the anode biofilm in MFC with yogurt wastewater under pH = 10.5 was greatly different from that in the MFC with the sole substrate under alkaline conditions,8,9 indicating that the type of substrate could significantly affect the bacterial community in the anode biofilm. The electricity generation and degradation of yogurt wastewater in the MFC should be dependent on Geoalkalibacter and various other bacteria with high microbial diversity in the anode biofilm. Nevertheless, the synergistic actions between Geoalkalibacter and various other bacteria need further investigation.
There are many other industrial wastewaters with high alkalinity such as paper making wastewater, petrochemical industry wastewater, etc.42,43 The pH adjustment in the industrial wastewater is usually needed for the biological treatment, which will consume a lot of acid and increase the operation cost. Therefore, our results should be useful to expand the application scope of MFC in the wastewater treatment under alkaline conditions.
4. Conclusions
The electricity generation in the MFC was investigated using yogurt wastewater as the substrate under an alkali condition in this study. With the initial COD concentration of 1.0 ± 0.1 g L−1 and pH = 10.5 in the yogurt wastewater, the maximum power density reached 1043 ± 100 mW m−2 in the MFC, which was much higher than those previously reported using food-processing wastewater under alkaline conditions. Correspondingly, the COD, NH4-N, TN removal reached 88 ± 7%, 96 ± 4% and 69 ± 3%, respectively. Higher concentrations of yogurt wastewater increased the internal resistance in the MFC and decreased the bacterial viability in the anode biofilm, resulting in the decrease of the electricity generation in the MFC. Geoalkalibacter with the relative abundance of 12.9–49.9% was dominant of the bacterial community in the anode biofilm.Acknowledgements
This work was partly supported by grants from the National Natural Science Foundation of China (No. 51278500, 41471181, and 51308557), the Natural Science Foundation of Guangdong Province (2015A030313102), and the Fundamental Research Funds for the Central Universities (16lgjc65).References
- P. L. McCarty, J. Bae and J. Kim, Environ. Sci. Technol., 2011, 45, 7100–7106 CrossRef CAS PubMed.
- L. Hsu, B. Chadwick, J. Kagan, R. Thacher, A. Wotawabergen and K. Richter, RSC Adv., 2013, 3, 15947–15954 RSC.
- W. Chen, Y. X. Huang, D. B. Li, H. Q. Yu and L. Yan, RSC Adv., 2014, 4, 21619–21624 RSC.
- Y. Qiao, X. S. Wu, C. X. Ma, H. He and C. Li, RSC Adv., 2014, 4, 21788–21793 RSC.
- B. Cercado-Quezada, M.-L. Delia and A. Bergel, Bioresour. Technol., 2010, 101, 2748–2754 CrossRef CAS PubMed.
- Y. Fan, H. Hu and H. Liu, Environ. Sci. Technol., 2007, 41, 8154–8158 CrossRef CAS PubMed.
- E. Zhang, W. Zhai, Y. Luo, K. Scott, X. Wang and G. Diao, Bioresour. Technol., 2016, 211, 736–742 CrossRef CAS PubMed.
- V. Margaria, T. Tommasi, S. Pentassuglia, V. Agostino, A. Sacco, C. Armato, A. Chiodoni, T. Schilirò and M. Quaglio, Int. J. Hydrogen Energy, 2017, 42, 1820–1829 CrossRef CAS.
- L. Rago, J. A. Baeza and A. Guisasola, Bioelectrochemistry, 2016, 109, 57–62 CrossRef CAS PubMed.
- Y.-C. Yong, Z. Cai, Y.-Y. Yu, P. Chen, R. Jiang, B. Cao, J.-Z. Sun, J.-Y. Wang and H. Song, Bioresour. Technol., 2013, 130, 763–768 CrossRef CAS PubMed.
- J. P. Badalamenti, R. Krajmalnikbrown and C. I. Torres, mBio, 2013, 4, e00144-13 CrossRef PubMed.
- T. Zhang, L. Zhang, W. Su, P. Gao, D. Li, X. He and Y. Zhang, Bioresour. Technol., 2011, 102, 7099–7102 CrossRef CAS PubMed.
- V. G. Paul, S. D. Minteer, B. L. Treu and M. R. Mormile, Environ. Technol., 2014, 35, 1003–1011 CrossRef CAS PubMed.
- T. Pepe Sciarria, G. Merlino, B. Scaglia, A. D'Epifanio, B. Mecheri, S. Borin, S. Licoccia and F. Adani, J. Power Sources, 2015, 274, 393–399 CrossRef CAS.
- Q. Wen, Y. Wu, L. Zhao and Q. Sun, Fuel, 2010, 89, 1381–1385 CrossRef CAS.
- K. P. Katuri, A.-M. Enright, V. O'Flaherty and D. Leech, Bioelectrochemistry, 2012, 87, 164–171 CrossRef CAS PubMed.
- M. Mahdi Mardanpour, M. Nasr Esfahany, T. Behzad and R. Sedaqatvand, Biosens. Bioelectron., 2012, 38, 264–269 CrossRef CAS PubMed.
- F. Zhang, D. Pant and B. E. Logan, Biosens. Bioelectron., 2011, 30, 49–55 CAS.
- G. Chen, B. Wei, B. E. Logan and M. A. Hickner, RSC Adv., 2012, 2, 5856–5862 RSC.
- K. Guo, A. H. Soeriyadi, H. J. Feng, A. Prevoteau, S. A. Patil, J. J. Gooding and K. Rabaey, Bioresour. Technol., 2015, 195, 46–50 CrossRef CAS PubMed.
- H. Dong, H. B. Yu, X. Wang, Q. X. Zhou and J. L. Feng, Water Res., 2012, 46, 5777–5787 CrossRef CAS PubMed.
- G. Liu, Y. Zhou, H. Luo, X. Cheng, R. Zhang and W. Teng, Bioresour. Technol., 2015, 198, 87–93 CrossRef CAS PubMed.
- L. S. Clesceri, A. E. Greenberg and A. D. Eaton, Standard methods for the examination of water and wastewater, APHA, Washington, DC, 1998 Search PubMed.
- H. C. Tao, X. N. Sun and Y. Xiong, RSC Adv., 2014, 5, 4659–4663 RSC.
- Y. Yang, Y. Xiang, C. Xia, W.-M. Wu, G. Sun and M. Xu, Bioresour. Technol., 2014, 164, 270–275 CrossRef CAS PubMed.
- S. T. Read, P. Dutta, P. L. Bond, J. Keller and K. Rabaey, BMC Microbiol., 2010, 10, 98 CrossRef PubMed.
- H. Yan and J. M. Regan, Biotechnol. Bioeng., 2013, 110, 785–791 CrossRef CAS PubMed.
- H. Yan, T. Saito and J. M. Regan, Water Res., 2012, 46, 2215–2224 CrossRef CAS PubMed.
- E. Elakkiya and M. Matheswaran, Bioresour. Technol., 2013, 136, 407–412 CrossRef CAS PubMed.
- S. Venkata Mohan, G. Mohanakrishna, G. Velvizhi, V. L. Babu and P. N. Sarma, Biochem. Eng. J., 2010, 51, 32–39 CrossRef CAS.
- H. J. Mansoorian, A. H. Mahvi, A. J. Jafari and N. Khanjani, J. Saudi Chem. Soc., 2016, 20, 88–100 CrossRef CAS.
- A. L. Vázquez-Larios, F. Esparza-García, G. Vázquez-Huerta, O. Solorza-Feria and H. M. Poggi-Varaldo, J. Biotechnol., 2010, 150, 145 Search PubMed.
- Q. Liao, J. Zhang, J. Li, D. Ye, X. Zhu, J. Zheng and B. Zhang, Int. J. Hydrogen Energy, 2014, 39, 19349–19354 CrossRef CAS.
- H. Luo, S. Yu, G. Liu, R. Zhang and W. Teng, Fuel, 2016, 182, 732–739 CrossRef CAS.
- K. L. Lesnik and H. Liu, Appl. Microbiol. Biotechnol., 2014, 98, 4187–4196 CrossRef CAS PubMed.
- N. Xafenias and V. Mapelli, Int. J. Hydrogen Energy, 2014, 39, 21864–21875 CrossRef CAS.
- S. H. Zhang, C. H. Qiu, C. F. Fang, Q. L. Ge, Y. X. Hui, B. Han and S. Pang, Appl. Biochem. Microbiol., 2017, 53, 250–257 CrossRef CAS.
- L. Li, Q. He, Y. Ma, X. Wang and X. Peng, Bioresour. Technol., 2015, 189, 113–120 CrossRef CAS PubMed.
- Y. Li, J. Cheng, Q. Sun and X. Meng, Fresenius Environ. Bull., 2016, 1827 CAS.
- D. M. Hodgson, A. Smith, S. Dahale, J. P. Stratford, J. V. Li, A. Grüning, M. E. Bushell, J. R. Marchesi and C. A. Rossa, Front. Microbiol., 2016, 7, 699 Search PubMed.
- W. Liu, Z. He, C. Yang, A. Zhou, Z. Guo, B. Liang, C. Varrone and A. J. Wang, Biotechnol. Biofuels, 2016, 9, 83 CrossRef PubMed.
- D. Pokhrel and T. Viraraghavan, Sci. Total Environ., 2004, 333, 37–58 CrossRef CAS PubMed.
- H. Macarie, Water Sci. Technol., 2000, 42, 201–214 CAS.
| This journal is © The Royal Society of Chemistry 2017 |

