 Open Access Article
Structure, absolute configuration, and variable-temperature 1H-NMR study of (±)-versiorcinols A–C, three racemates of diorcinol monoethers from the sponge-associated fungus Aspergillus versicolor 16F-11†
Bin-Bin Gu,
Jie Tang,
Shu-Ping Wang,
Fan Sun,
Fan Yang,
Lei Li,
Ying Xu and
Hou-Wen Lin *
*
Key Laboratory for Marine Drugs, Department of Pharmacy, State Key Laboratory of Oncogenes and Related Genes, Renji Hospital School of Medicine, Shanghai Jiao Tong University, Shanghai 200127, China. E-mail: franklin67@126.com
First published on 27th October 2017
Abstract
Three racemates of diorcinol monoethers, (±)-versiorcinols A–C (1–3), were initially isolated from the fungus Aspergillus versicolor 16F-11. The structures of versiorcinols B and C were elucidated by comprehensive spectroscopic analysis, while the structure of versiorcinol A was elucidated on the basis of quantum-chemical NMR chemical shifts, supported by DP4 probability analysis, and DU8 proton–proton spin–spin coupling constants (SSCCs) calculations in consortium with extensive experimental NMR analysis. The absolute configurations of the enantiomers (+)-1 and (−)-1, (+)-2 and (−)-2, and (+)-3 and (−)-3 were assigned from ECD calculations. At very low temperatures, the 1H-NMR spectra of 1–3 revealed doubling of signals, which suggested the presence of two conformers in solution. Variable-temperature (VT) 1H-NMR studies supported this hypothesis.
Introduction
Fungi are widespread all over the world and have occupied almost every ecological niche, not only in terrestrial but also in freshwater and marine environments. For survival, secure access to living space and sufficient nutrition, fungi have developed a rich chemical ecology to survive the attacks of competitors and predators by the process of natural selection.1 For instance, secondary metabolites serve chemical defense purposes, communication purposes, symbiotic interaction purposes, which have resulted in fungi as a promising reservoir for biologically and pharmaceutically active molecules attracting ever-growing studies.2Phenyl ethers derived from a simple aromatic tetraketide orsellinic acid are a family of fungal metabolites that containing 5-methylbenzene-1,3-dioxy substructure. Their chemical diversity is attributed to: the number of orsellinic acid presented in these ethers (dimers in most cases and rare trimers);3–12 differences in hydroxylation and decarboxylation of the orsellinic acid subunit;3,4,6,9–12 multiformity of the ether bonds formed from phenolic hydroxyl groups;3,6,8,10,11 differences in glycosylated and prenylated modifications;3,5–8,13 and fusion of orsellinic acid derived units with other polyketide units,10,14 such as C–C fusion of an anthraquinone and orcinol unit.10 Among these structurally diverse orsellinic acid-derived phenyl ethers, diphenyl ethers were found to have various functions such as antiviral,3 antibacterial,4,7,9 anticancer,5,6,8 antifungal,15 acetylcholinesterase (AChE) inhibiting,9 antioxidant,10 osteoclastogenesis inhibiting,16 and geranylgeranyl diphosphate synthase inhibiting11 activities, and other orsellinic acid-derived phenyl ethers, such as F9775A and F9775B, were shown to have anti-osteoporosis activity.17
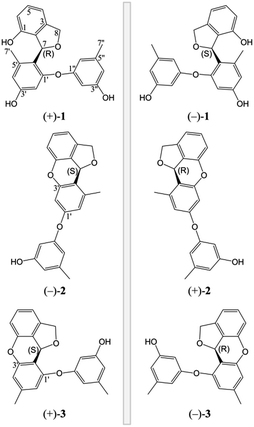
As part of our efforts for biological fungal metabolites, chemical investigations of fungi isolated from several marine sponges collected from Yongxing Island were initiated.18,19 In the course of antibacterial activities-guided screening, a fungal strain Aspergillus versicolor 16F-11 (KM605199) isolated from marine sponge Phakellia fusca aroused our interest as the EtOAc extract of this fungal culture showed antibacterial activity against a panel of pathogenic bacteria. Our investigation of the EtOAc extract of the liquid fermentation of this fungus led to the discovery three racemates of diorcinol monoethers, (±)-versiorcinols A–C (1–3). Enantioseparations for (±)-1, (±)-2, and (±)-3 were achieved on chiral HPLC to afford the enantiomers (+)-1 and (−)-1, (+)-2 and (−)-2, and (+)-3 and (−)-3, respectively. The structures and absolute configurations of 1, 2, and 3 were unambiguously elucidated by high/low temperature 1D and 2D NMR spectra (recorded at 80 °C in DMSO-d6 for 1 and 3 and −40 °C in CD3OD for 2); DFT calculations of NMR chemical shifts, and 1H NMR coupling constants; and time-dependent density functional theory (TDDFT) ECD calculations for solution conformers. Besides, the interesting phenomena of paired 1H NMR signals of 1, 2, and 3 appeared at various low temperatures in the same solvent were investigated using VT 1H-NMR study. Herein, we report the isolation, structural elucidation, VT 1H-NMR study, and biological evaluation of these compounds.
Results and discussion
The fungus A. versicolor 16F-11 was cultivated on fungal liquid medium for 12 days. The crude EtOAc extract of the whole fermentation broth was fractionated by preparative medium pressure liquid chromatography (MPLC) followed by RP-HPLC chromatography to yield (±)-versiorcinol A–C (1–3, Fig. 1).(±)-Versiorcinol A (1) has a molecular formula of C22H20O5 provided by the positive HRESIMS (m/z 365.1371 [M + H]+, calcd 365.1389), which indicated thirteen double-bound equivalents in the molecule. The IR spectrum of 1 displayed absorptions for hydroxyl (3327 cm−1) group(s) and aromatic ring(s) (1700, 1594, 1468 cm−1). As several carbon signals were broadened and disappeared at 25 °C and improved and emerged at 80 °C in DMSO-d6 (ESI, Fig. S7 and S8†), we rerecorded the 1D and 2D NMR spectra of 1 at 80 °C in DMSO-d6. The 1H NMR spectrum of compound 1 (Table 1) showed: eight aromatic protons, three of which were apparently characterized by a first-order ABC coupling system (δH 6.68, 7.04, and 6.57); two diastereotopic oxygenated methylene protons (δH 5.16, 4.98); one oxygen-bearing methine proton (δH 6.63), and two methyl protons most probably attached to aromatic ring(s) (δH 2.01, 2.19). Its 13C NMR and DEPT spectra (Table 1) exhibited a total of 22 carbon resonances divided into 10 sp2 quaternary carbon atoms (5 oxygenated quaternary carbons, 5 quaternary carbons) and 8 sp2 methines at low field and 4 sp3 carbon atoms at high field (1 sp3 methine, 1 sp3 methylene, and 2 methyls), accounting for nine double-bond equivalents. The remaining four degrees of unsaturation is due to the presence of four rings in its molecule. The HSQC cross peaks facilitated the assignment of the protons to the corresponding carbon atoms. A consecutive 1H–1H COSY correlation from H-4 to H-6, together with the HMBC correlations form aromatic H-4 (δH 6.68, dd, J = 7.0, 0.6 Hz) and H-6 (δH 6.57, dd, J = 7.9, 0.6 Hz) to C-2 (δC 126.8), from H-6 and H-5 (δH 7.04, t, J = 7.6 Hz) to C-1 (δC 151.7), from H-5 to C-3 (δC 141.4), from oxygenated methylene H2-8 (δH 5.16, dd, J = 11.9, 3.0 Hz; 4.98, d, J = 11.9 Hz) to C-2, C-3, C-4 (δC 110.7), and C-7 (δC 77.5), from oxygenated methine H-7 (δH 6.63, brt, J = 2.8 Hz) to C-2 could establish the 3,4-disubstituted 1,3-dihydroisobenzofuran moiety, the A and B rings (Fig. 2). Moreover, the magnitude of C-1 carbon chemical shift (δC 151.7) hinted that an oxygen atom is positioned at C-1. The rest 1H and 13C NMR resonances of 1, two methyls, five aromatic methines (δH 6.23, d, J = 2.4 Hz; 6.17, d, J = 2.3 Hz; 6.18, t, J = 2.2 Hz; 6.25, m; 6.33, m), and four oxygen-bearing sp2 quaternary carbons (156.9, 155.8, 158.1, and 157.2), highlighted that 1 contains two additional benzene rings, the ring C (tetra-substituted) and the D ring (tri-substituted), which was reinforced by HMBC correlations of H-7′/C4′ and C6′, H-2′/C4′ and C6′, H-4′/C6′, H-7′′/C4′′ and C6′′, H-2′′/C4′′ and C6′′, and H-4′′/C6′′. The HMBC correlations of H2-8 with C6′ (δC 120.4) and of H-7 with C1′ (δC 156.9), C5′ (139.1), and C6′ allowed a connection of ring C and the aforementioned 3,4-disubstituted 1,3-dihydroisobenzofuran moiety to form the A/B/C fragment via a C–C bond (C7–C6′). However, the final ether linkage site, between ring D and the A/B/C, is uncertain (the shortest bond distance (H→C) between ring D and A/B/C is 4-bond) and leaving it open as to whether the ether bond is formed between C1′ (156.9) and C1′′ (a, Fig. 2) or between C3′ (155.8) and C1′′ (b, Fig. 2) or between C1 (151.7) and C1′′ (c, Fig. 2) as no 1H/13C correlation(s) between ring D and A/B/C could be found in the HMBC spectrum (Fig. 2 and ESI, Fig. S21†). Initial proofreading the experimental NOEs with the spatial locations of the corresponding hydrogens in the most stable conformers of structures of a, b, and c (Fig. 2), however, ruled out the candidate structure c, because H-7′ (δH 2.01) and H-8 (δH 5.16) are at the opposite side of A/B plane in c and no NOE effect could be observed (see ESI, Fig. S1,† in any and every of all the low-energy conformers of c, H-7′ and H-8 (δH 5.16) are on the opposite face of the A/B ring). Finally, for ruling out candidate structure and supporting the correct one for the single stereocenter-containing compound 1, a solution was secured by computation, including DFT calculations accurate NMR chemical shifts and 1H NMR coupling constants.
| Position | 1a | 2b | 3a | |||||
|---|---|---|---|---|---|---|---|---|
| Conformer Ac (58.2%) | Conformer Bc (41.8%) | |||||||
| δH (J in Hz) | δC | δH (J in Hz) | δC | δH (J in Hz) | δC | δH (J in Hz) | δC | |
| a In DMSO-d6 at 80 °C.b In CD3OD at −40 °C.c These percents were estimated based upon the ratio of integral areas of H-7′ of conformer A to H-7′* of conformer B in the 1H NMR spectrum. | ||||||||
| 1 | 151.7 | 153.3 | 153.7 | 151.5 | ||||
| 2 | 126.8 | 127.5 | 127.2 | 126.9 | ||||
| 3 | 141.4 | 142.4 | 142.4 | 141.6 | ||||
| 4 | 6.68, dd (7.0, 0.6) | 110.7 | 6.50, m | 111.9 | 6.75, m | 112.5 | 6.55, d (7.4) | 110.3 |
| 5 | 7.04, t (7.6) | 128.1 | 6.92, t (7.7) | 129.7 | 7.13, t (7.7) | 130.4 | 6.94, t (7.7) | 127.6 |
| 6 | 6.57, dd (7.9, 0.6) | 113.5 | 6.50, m | 113.9 | 6.60, d (7.9) | 114.5 | 6.52, d (7.9) | 113.1 |
| 7 | 6.63, brt (2.8) | 77.5 | 6.56, d (2.4) | 81.2 | 6.75, m | 79.4 | 6.59, d (2.5) | 75.7 |
| 8 | 5.16, dd (11.9, 3.0) | 72.3 | 5.15, dd (11.3, 2.9) | 75.2 | 5.23, dd (11.9, 2.3) | 73.9 | 5.02, dd (11.5, 3.1) | 72.7 |
| 4.98, brd (11.9) | 5.01, d (11.2) | 5.10, dd (12.0, 2.6) | 4.87, d (11.4) | |||||
| 1′ | 156.9 | 158.6 | 158.8 | 156.8 | ||||
| 2′ | 6.23, d (2.4) | 103.3 | 6.00, d (2.2) | 106.1 | 6.11, d (2.3) | 104.9 | 116.8 | |
| 3′ | 155.8 | 158.6 | 157.9 | 155.6 | ||||
| 4′ | 6.17, d (2.3) | 111.2 | 123.1 | 121.7 | 6.02, m | 110.3 | ||
| 5′ | 139.1 | 140.5 | 142.1 | 137.5 | ||||
| 6′ | 120.4 | 6.39 d (2.1) | 113.1 | 6.30, m | 115.1 | 6.35, brs | 111.5 | |
| 7′ | 2.01, s | 18.9 | 2.53, s | 20.7 | 1.84, s | 19.6 | 2.10, s | 20.4 |
| 1′′ | 158.1 | 159.8 | 160.7 | 158.2 | ||||
| 2′′ | 6.18, t (2.2) | 102.9 | 5.84, brs | 103.2 | 6.30, m | 103.8 | 6.02, m | 102.2 |
| 3′′ | 157.2 | 159.0 | 159.5 | 157.6 | ||||
| 4′′ | 6.25, m | 109.8 | 6.15, brs | 110.9 | 6.31, brs | 111.3 | 6.02, m | 109.1 |
| 5′′ | 139.5 | 140.8 | 141.4 | 138.8 | ||||
| 6′′ | 6.33, m | 110.9 | 5.79, brs | 110.7 | 6.37, brs | 111.3 | 6.22, brs | 110.0 |
| 7′′ | 2.19, s | 20.6 | 2.09, s | 21.6 | 2.23, s | 21.7 | 2.11, s | 20.6 |
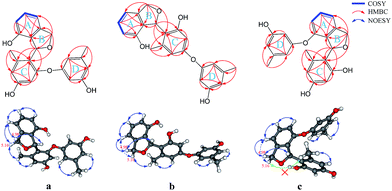 | ||
| Fig. 2 Key 2D NMR correlations of three possible structures (a, b, and c) of 1. No NOESY correlation could be found between H-7′ (δH 2.01) and H-8 (δH 5.16) in c (the green arrow). | ||
With improvements in accuracy and affordability, computational modeling of 1H and 13C chemical shifts by ab initio methods based on gauge including atomic orbital (GIAO)20 have found increased utility in natural product assignments.21 In this event, the initial MMFF conformational search of a and b resulted in, respectively, 91 and 93 stable conformers in a 21 kJ mol−1 energy window. These stable conformers for a and b were optimized by DFT calculations at the B3LYP/6-31G(d) level with the PCM solvent model for DMSO. Then, the thereby yielded 62 and 63 conformers (ESI, Tables S1 and S2†), respectively, were subjected to NMR chemical shifts calculations at the B3LYP/6-311+G(2d,p) level with the PCM solvent model for DMSO.21 The theoretical NMR chemical shifts for a and b were estimated from calculated chemical shifts for each of the stable conformers for a and b weighted to their Boltzmann distribution (B3LYP/6-31G(d), PCM/DMSO, 353.15 K). Both 1H and 13C NMR chemical shifts of 1 showed better overall agreement with the theoretical NMR chemical shifts for a than those for b (CMAE: 1.2 vs. 1.6 ppm for 13C, 0.07 vs. 0.10 ppm for 1H; R2: 0.998 vs. 0.996 for 13C, 0.996 vs. 0.994 for 1H; Fig. 3 and ESI, Fig. S2 and S3 and Table S3†). This comparison was also judged by DP4 probability, using t distribution and DP4-database 2.22,23 DP4 analysis identified a as the real structure of versiorcinol A (1) from two possible structures (a and b) with a probability of 100.0% (using both carbon and proton data; 0.0% for b).
Accurate and rapid computations of proton SSCC are particularly attractive as SSCCs carry a plethora of structural information helping to inform and guide the structural assignment of complex organic molecules. In 2015, Kutateladze and Mukhina improved the SSCC calculation based on parametric scaling of the DFT-computed Fermi contacts (FCs), extended by a “minimalistic relativistic force field” (DU8) that utilized the natural bond order (NBO) hybridization coefficients for parametric scaling, requiring only four general types of SSCCs.24 The (wall) time for running a individual conformer of a size on a single 4-core Linux node does not exceed 1 h and yet gives 0.4 Hz rmsd, which is usually sufficient for unambiguous structural assignment.
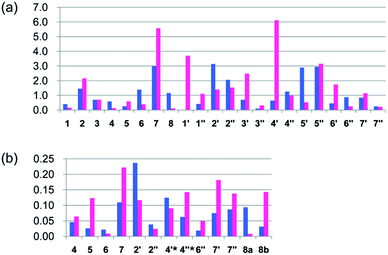
The geometries of conformers of a and b were first optimized using B3LYP/6-31G(d) PCM/DMSO level of theory, followed by calculation of SSCCs of each conformer using DU8 basis set24b (ESI, Table S5†). Energies of each of the 62 stable conformers of a and 63 stable conformers of b were calculated (B3LYP/6-31G(d) or B3LYP/6-311+G(2d,p), PCM/DMSO, 353.15 K) and the correspondingly theoretical SSCCs of a and b were acquired after weighting by the Boltzmann populations of the associated conformers.21 As expected (ESI, Table S5† and Fig. 4), all the corresponding ΔJ values of the aromatic parts of a and b are very close (not exceeding 0.4 Hz) and the different locations of D ring in a and b affect most the couplings between H-7 and H2-8 (with the ΔJ values of 4JH7–H8b and 4JH7–H8a about 0.7 and 0.7 Hz for a and 1.1 and 1.4 Hz for b, respectively). Again, a matched more closely (rmsd: 0.4 Hz for a vs. 0.7 Hz for b) with the measured values of 1 (ESI, Table S5†).
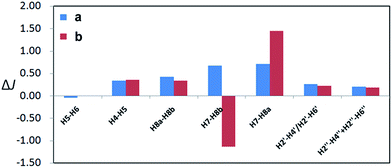 | ||
| Fig. 4 Calculated (DFT optimized geometries, DU8 basis set, and B3LYP/6-31G(d) relative free energies at 353.15 K for Boltzmann distributions; see ref. 24b, text, and ESI, Table S5†) coupling constants differences (ΔJ) of a and b from experimental values of versiorcinol A (1). | ||
Taken collectively, our computational evidences strongly suggest that a is the true structure of 1.25 Fig. 5 illustrates how well its multiplets are simulated with the computed SSCCs of a.
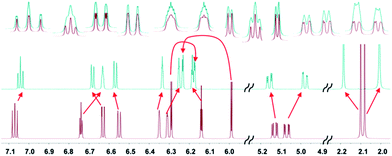 | ||
| Fig. 5 Experimental (top) and simulated NMR spectra for versiorcinol A (1); using the linearly corrected chemical shifts (ESI, Table S3†) mentioned above (all the calculated coupling constants and 1H chemical shifts were Boltzmann distributed using the B3LYP/6-31G(d) ΔG energy). | ||
The lack of optical activity indicated the racemic nature of 1. Following resolution for 1 was tackled by an enantioseparation procedure ((+)-1 and (−)-1 in a ratio of almost 1![[thin space (1/6-em)]](https://www.rsc.org/images/entities/char_2009.gif) :
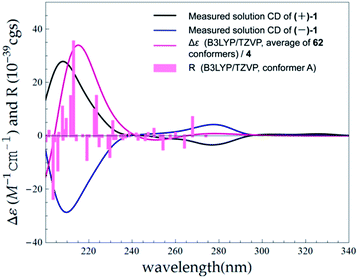
:![[thin space (1/6-em)]](https://www.rsc.org/images/entities/char_2009.gif) 1) (ESI, Fig. S63†). The observation of opposite optical rotation values and mirror ECD spectra for (+)-1 and (−)-1 confirmed their enantiomeric relationship (Fig. 6).
1) (ESI, Fig. S63†). The observation of opposite optical rotation values and mirror ECD spectra for (+)-1 and (−)-1 confirmed their enantiomeric relationship (Fig. 6).
The absolute configurations of (+)-1 and (−)-1 were determined by TDDFT ECD calculation. The B3LYP/6-31G(d) PCM/MeOH reoptimization of the 91 MMFF conformers of (7R)-1 yielded 14 conformers above 1% (ESI, Tables S6 and S7 and Fig. S4†). The resulted theoretical ECD spectrum were in fairly good agreement with the experimental ECD spectrum for (+)-1 (Fig. 6). Therefore, 7R and 7S were finally assigned for (+)-1 and (−)-1, respectively.
(±)-Versiorcinol B (2) has a molecular formula of C22H18O4, with 14 degrees of unsaturation, one more degree of unsaturation and 18 less mass units (H2O) than in (±)-versiorcinol A (1), as established by HRESIMS (m/z 347.1266 [M + H]+, calcd 347.1283). The IR spectrum also suggested the presence of hydroxyl group(s) (3329 cm−1) and aromatic ring(s) (1700, 1599, 1468 cm−1). As the 1H NMR spectra of compound 2 were severely broadened and distorted at 25 °C and improved tremendously at 80 °C in DMSO-d6 (ESI, Fig. S10 and S11†), we thus registered the 1D and 2D NMR spectra of 2 at 80 °C in DMSO-d6. However, several carbon signals were still broadened. As a consequence, a few key HMBC correlations were unexposed in its HMBC spectrum. Then, we resorted to cryogenic NMR experiments. Pre-examination the 1H NMR spectra of 2 (dissolved in CD3OD) showed that when the temperature dropped to −20 °C, two sets of well-distinguished peaks were emerged and, moreover, this distinctiveness and the shape of peaks were further improved at −40 °C (ESI, Fig. S12†). Accordingly, we rerecorded the 1D and 2D NMR spectra of 2 at −40 °C in CD3OD as well. An initial study of the 1H NMR data (Table 1) revealed a doubling of all the signals with a nearly 1.39![[thin space (1/6-em)]](https://www.rsc.org/images/entities/char_2009.gif) :
:![[thin space (1/6-em)]](https://www.rsc.org/images/entities/char_2009.gif) 1.00 ratio. We attributed this phenomenon to the presence of two conformers in a 1.39
1.00 ratio. We attributed this phenomenon to the presence of two conformers in a 1.39![[thin space (1/6-em)]](https://www.rsc.org/images/entities/char_2009.gif) :
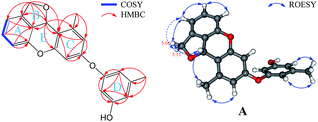
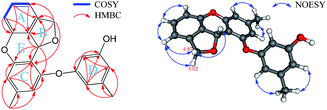
:![[thin space (1/6-em)]](https://www.rsc.org/images/entities/char_2009.gif) 1.00 ratio at −40 °C in CD3OD. Comparing the 1H and 13C NMR spectra of 2 with those of 1 showed that they are almost identical, with the exception that there are very small deviations in the values of chemical shifts and coupling constants (Table 1), which suggested, as in 1, these 1H and 13C NMR data also encompass nine degrees of unsaturation. The remaining five indices of hydrogen deficiency indicated 2 is a pentacyclic compound (one more ring than in 1). Detailed analyses of the 1H–1H COSY, HMBC, and ROESY correlations (Fig. 7) disclosed that 2 also has a 3,4-disubstituted 1,3-dihydroisobenzofuran scaffold, the A and B rings, and a 4/6-substituted diorcinol unit, the C and D rings, being edited into the molecule according to key HMBC correlations of H2-8 with C4′ (δC 123.1) and of H-7 with C3′ (δC 158.6), C4′, and C5′ (140.5) (cluster A, 58.2%, Table 1). It remained to assign a single oxygen to accommodate the last ring in 2. Based on geometric considerations and 18 mass units (H2O) less than in 1, it could only be explained by assuming an ether bond formed between C1 and C3′ (Fig. 7).
1.00 ratio at −40 °C in CD3OD. Comparing the 1H and 13C NMR spectra of 2 with those of 1 showed that they are almost identical, with the exception that there are very small deviations in the values of chemical shifts and coupling constants (Table 1), which suggested, as in 1, these 1H and 13C NMR data also encompass nine degrees of unsaturation. The remaining five indices of hydrogen deficiency indicated 2 is a pentacyclic compound (one more ring than in 1). Detailed analyses of the 1H–1H COSY, HMBC, and ROESY correlations (Fig. 7) disclosed that 2 also has a 3,4-disubstituted 1,3-dihydroisobenzofuran scaffold, the A and B rings, and a 4/6-substituted diorcinol unit, the C and D rings, being edited into the molecule according to key HMBC correlations of H2-8 with C4′ (δC 123.1) and of H-7 with C3′ (δC 158.6), C4′, and C5′ (140.5) (cluster A, 58.2%, Table 1). It remained to assign a single oxygen to accommodate the last ring in 2. Based on geometric considerations and 18 mass units (H2O) less than in 1, it could only be explained by assuming an ether bond formed between C1 and C3′ (Fig. 7).
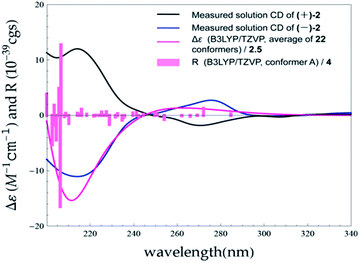
The MMFF conformational search resulted in 35 conformers for (7S)-2, which were reoptimized at the B3LYP/6-31G(d) with PCM model for MeOH level, yielding 22 conformers above 1% (ESI, Tables S6 and S8 and Fig. S5†). The Boltzmann-averaged ECD spectrum for (7S)-2 reproduced well the two ECD transitions of the experimental spectrum of (−)-2, enabling the unambiguous assignments of the 7R and 7S absolute configurations for (+)-2 and (−)-2, respectively (Fig. 8).
(±)-Versiorcinol C (3), which also consists of a pair of enantiomers, has the same molecular formula of C22H18O4 as 2 (HRESIMS m/z 347.1266 [M + H]+, calcd 347.1283). As the situation in 1 and 2, several carbons were disappeared at 25 °C and emerged at 80 °C in DMSO-d6 (ESI, Fig. S13 and S14†), we then registered the 1D and 2D NMR spectra of 3 at 80 °C in DMSO-d6. Detailed comparison of its NMR data with those of 2 indicated that the only difference between 3 and 2 is the small deviation of the values of chemical shifts and coupling constants (Table 1), which suggested that 3 has a 3,4-disubstituted 1,3-dihydroisobenzofuran moiety (A and B rings) and a diorcinol moiety (C and D rings) as well, being corroborated by the 1H–1H COSY, HMBC, and NOESY correlations (Fig. 9). The discerned key HMBC correlations of H2-8 with C2′ (δC 116.8) and of H-7 with C1′ (δC 156.8), C2′, and C3′ (δC 155.6) manifested the connection of these two moieties via the C7–C2′ bond. Based on geometric considerations, the ring E, formed through the formation of an ether bond between C1 and C3′, was assigned to accommodate the last degree of unsaturation and complete the structure of 3.
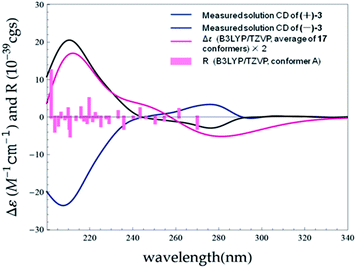
The initial MMFF conformational search of (7S)-3 resulted in 24 conformers. The B3LYP/6-31G(d) PCM/MeOH optimization of these conformers yielded 17 conformers above 1% (ESI, Tables S6 and S9 and Fig. S6†). The overall ECD spectrum for (7S)-3 is in good accordance with the experimental ECD for (+)-3 (Fig. 10). Therefore, the absolute configurations of (+)-3 and (−)-3 were designated as 7S and 7R.
The 1H- and 13C-NMR spectra of 2 at −40 °C in CD3OD revealed doubling of signals, which suggested the presence of two conformers in solution separated by a relatively high energy barrier. To support this hypothesis, VT 1H-NMR study was conducted for compounds 1–3.
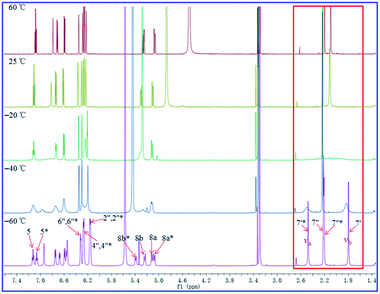
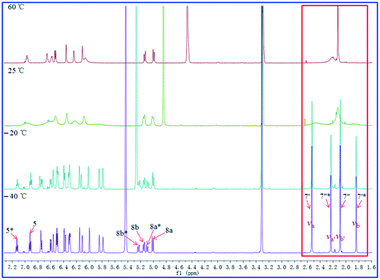
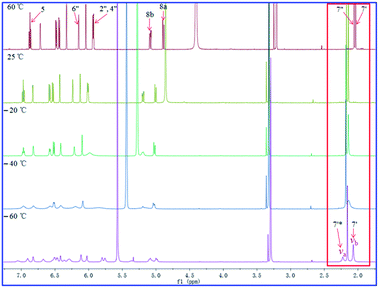
As shown in Fig. 11–13, the 1H NMR spectra of 1–3 at different temperatures in CD3OD, ranging from −60 °C to 60 °C, were recorded. At 25 °C, the 1H NMR of 1 and 3 displayed sharp and well J-coupling splitted peaks (Fig. 11 and 13), while in the 1H NMR of 2, the whole 1H NMR spectrum was broadened seriously (Fig. 12), which even let us suspect whether we got the pure form of 2 before. When the measurement temperature raised to 60 °C, all the originally unresolved peaks of 2 were emerged, though with “apparently simple” peak pattern, indicating that this low-resolved peak pattern could be further refined and finally resolved as the temperature grows if possible (the boiling point of MeOH is 64.7 °C), whereas the 1H NMR spectra of 1 and 3 had almost no change. On the contrary, when the temperature dipped to −20 °C, several peaks of 1 were disappeared, while the other peaks of 1 were broadened in varying degrees; all of the proton signals in 3 were just broadened (with varying degrees); two sets of well-discriminated peaks of 2 in a nearly 1.39![[thin space (1/6-em)]](https://www.rsc.org/images/entities/char_2009.gif) :
:![[thin space (1/6-em)]](https://www.rsc.org/images/entities/char_2009.gif) 1.00 ratio were well resolved. The discrimination of the paired signals as well as the splitting and shape of the relevant peaks of 2 were further refined at −40 °C. However, the trend for forming paired signals of 1 lagged behind that of 2. As shown in Fig. 11, the paired signals of 1 (1.19
1.00 ratio were well resolved. The discrimination of the paired signals as well as the splitting and shape of the relevant peaks of 2 were further refined at −40 °C. However, the trend for forming paired signals of 1 lagged behind that of 2. As shown in Fig. 11, the paired signals of 1 (1.19![[thin space (1/6-em)]](https://www.rsc.org/images/entities/char_2009.gif) :
:![[thin space (1/6-em)]](https://www.rsc.org/images/entities/char_2009.gif) 1.00) were appeared and well-resolved till the temperature was dropped to −60 °C. For 3, even at −60 °C (Fig. 13), the 1H NMR spectrum was yet broadened, with the beginning of the sign of paired signals being discerned for the methyl group at 2.0–2.2 δH (1.79
1.00) were appeared and well-resolved till the temperature was dropped to −60 °C. For 3, even at −60 °C (Fig. 13), the 1H NMR spectrum was yet broadened, with the beginning of the sign of paired signals being discerned for the methyl group at 2.0–2.2 δH (1.79![[thin space (1/6-em)]](https://www.rsc.org/images/entities/char_2009.gif) :
:![[thin space (1/6-em)]](https://www.rsc.org/images/entities/char_2009.gif) 1.00; because of the lowest-temperature limitation of our available NMR probe, we didn't record 1H NMR spectra of 3 at lower temperatures than −60 °C).
1.00; because of the lowest-temperature limitation of our available NMR probe, we didn't record 1H NMR spectra of 3 at lower temperatures than −60 °C).
For compound 1 (Fig. 11), using the H3-7′ signals as a marker, two conformers were in slow exchange at −60 °C, therefore, two absorptions for this methyl group were individually detected. At −40 °C, conformational exchange was fast enough for time averaging to cause broadening of these two absorptions. At −20 °C, the increased rate of exchange has caused a initial coalescence of the methyl signals at ca. 2.12 ppm. At 25 °C, the methyl signal has sharpened dramatically. Thus the coalescence temperature (TC) of this methyl was slightly higher than −20 °C. This coalescence of signals was noticed for the entire 1H NMR spectrum, although the other pairs of signals coalesced at lower temperatures manifesting their smaller chemical shift differences. For compound 2 (Fig. 12), we used H3-7′ and H3-7′′ signals as markers. And the two signals for H3-7′′ coalesced to a single peak at ca. 2.13 ppm at a TC of 25 °C, while the two signals for H3-7′ coalesced to a single peak at ca. 2.21 ppm at a TC of 60 °C. For compound 3 (Fig. 13), using the H3-7′ signals as a marker, at a TC of −40 °C, the two signals for this methyl group coalesced to a single peak at ca. 2.14 ppm.
The free energies of activation for the interconversion between the two unequally populated conformers of versiorcinol A (1), versiorcinol B (2), and versiorcinol C (3) can be calculated using the modified Eyring's equations (a and b):26 ΔG‡A = 4.57TC{10.62 + log[X/2π(1 − ΔP)] + log(TC/Δv)} (a) and ΔG‡B = 4.57TC{10.62 + log[X/2π(1 + ΔP)] + log(TC/Δv)} (b), where X = 2πτΔv and ΔP = PA − PB. PA and PB represent the population of the conformers A and B (PA > PB, PA + PB = 1), respectively, τ is the mean lifetime, TC is the coalescence temperature, and Δv is the chemical shift difference between the two lines expressed in Hz (va − vb). X is obtained using equation (c): PA − PB = ΔP = [(X2 − 2)/3]3/2 × 1/X.
From the 1H NMR spectrum of 1 at −60 °C (213 K), the frequency difference, Δv, between the H3-7′ signals was 409.2 Hz and the TC of this H3-7′ group in 1 was slightly higher than −20 °C (253 K). Thereby, the ΔG‡A and ΔG‡B values should be slightly larger than 11.7 and 11.8 kcal mol−1, respectively. For compound 2, using the H3-7′′ signals as a marker, the ΔG‡A and ΔG‡B were respectively calculated as 14.8 and 15.0 kcal mol−1 (Δv = 87.0, TC = 25 °C (298 K)); when the H3-7′ signals was used as a marker, these two values were 15.5 and 15.8 kcal mol−1, respectively (Δv = 415.2, TC = 60 °C (333 K)). Finally, for compound 3, the ΔG‡A and ΔG‡B were calculated as 11.3 and 11.7, respectively, when the H3-7′ signals were employed as a marker (Δv = 94.2, TC = −40 °C (233 K)). Accordingly, we approximately estimated the ΔG‡ about 12.0, 15.0, and 11.0 kcal mol−1 for 1, 2, and 3, respectively.
The VT 1H-NMR study confirmed the hypothesis that each appearance of doubled signals in the 1H NMR spectra of 1, 2, and 3 was due to the presence of two conformers in solution separated by a relatively high energy barrier. Besides, the relative sizes of numerical magnitudes of ΔG‡ for 1, 2, and 3 are in accordance with the relative temperature levels for showing paired signals in their 1H NMR spectra.
In the cases of the bioactivities, in vitro cytotoxic activity evaluation for racemates (±)-1, (±)-2, and (±)-3 and enantiomers (+)-1 and (−)-1, (+)-2 and (−)-2, and (+)-3 and (−)-3 was performed indicating that none of them displayed cytotoxicity toward MCF-7 and U937 cell lines even after 72 h treatments at the highest dose of 20 μmol L−1 (μM). For antibacterial activity testing (ESI, Table S10†), however, the racemate (±)-1 and enantiomers (+)- and (−)-1 showed medium antibacterial activity against Staphylococcus aureus (32, 32, and 16 μg mL−1, respectively), methicillin-resistant Staphylococcus aureus (64, 64, and 32 μg mL−1, respectively), and Enterococcus faecalis C1129 (64, 64, and 32 μg mL−1, respectively); no antibacterial activity against Escherichia coli, Salmonella typhimurium SL1344, Acinetobacter baumanii ATCC19606, and Klebsiella pneumoniae ATCC13883 was observed (MIC > 64 μg mL−1).
Conclusions
We reported three racemates of diorcinl monoethers, (±)-versiorcinols A–C (1–3), isolated from the marine sponge P. fusca associated fungus A. versicolor 16F-11. Although structural elucidations on the basis of room temperature NMR experiments could not resolve the structures of 1, 2, and 3, the 1D and 2D NMR experiments carried out at −40 °C in CD3OD for 2 and at 80 °C in DMSO-d6 for 3, respectively, resulted in the planar structures of 2 and 3 to be determined. For 1, its structure was ascertained by theoretical NMR chemical shifts and 1H NMR SSCCs studies of its two possible candidates elucidated from the 1D and 2D NMR spectra acquired at 80 °C in DMSO-d6. Then, the absolute configurations of the enantiomers (+)-1 and (−)-1, (+)-2 and (−)-2, and (+)-3 and (−)-3 were elucidated with solution-state TDDFT ECD calculations. Concerning the paired 1H NMR signals of 1, 2, and 3 appeared in solution, the calculated free energies of activation using the modified Eyring's equations based on VT 1H-NMR study confirmed the hypothesis that the doubling of signals was due to the presence of two conformers separated by a relatively high energy barrier.Experimental section
General procedures
Analytical thin-layer chromatography (TLC) systems were carried out on silica gel 60 F254 plates. 1H, 13C, DEPT135, COSY, HSQC, HMBC, NOESY, and ROESY NMR spectra were collected on an Agilent 600 MHz NMR instrument. UV and IR (film) spectra were recorded on a Hitachi U-3010 spectrophotometer and Jasco FTIR-400 spectrometer, respectively. Optical rotation measurements were conducted on a PerkinElmer model 341 polarimeter with a 10 cm length cell at room temperature. CD spectra were acquired on a Jasco J-715 spectropolarimeter at room temperature. HRESIMS spectra were determined on a Waters Xevo G2-XS QTOF spectrometer. HPLC-MS spectra were obtained using a Waters HPLC system equipped with a Waters Acquity QDa spectrometer and a Waters XBridge C18 column (Waters, 4.6 × 250 mm, 5 μm). Preparative MPLC was performed on an Interchim Puriflash 450 Instrument. Semi-preparative reversed-phased HPLC (RP-HPLC) was performed using a Waters 1525 pump equipped with a 2998 photodiode array detector and a Waters XBridge C18 column (Waters, 10 × 250 mm, 5 μm). Chiral HPLC separation was performed using CHIRALCEL OJ-RH column (150 × 4.6 mm, 5 μm).Fungal material
The fungus Aspergillus versicolor 16F-11 was isolated from the inner tissue of the sponge Phakellia fusca collected from Yongxing Island, China and was identified by its rDNA amplification and sequence analysis of the ITS region (GenBank accession no. KM605199). A voucher specimen was deposited at the School of Life Sciences and Biotechnology, Shanghai Jiao Tong University, Shanghai, China.Culture, extraction, and isolation
Aspergillus versicolor 16F-11 was initially grown on PDA medium in a Petri dish for recovery (7 days). Its spores were directly inoculated into 250 mL Erlenmeyer flasks each containing 100 mL of the seed medium (potato 200 g L−1, dextrose 20 g L−1, and artificial seawater salts27 30 g L−1 in purified water) on a rotatory shaker (180 rpm) at 28 °C for 72 h. The subsequent expanded fermentation was proceeded in 54 × 2 L Erlenmeyer flasks. Each flask contained 6 g of sodium glutamate, 12 g of maltose, 12 g of mannitol, 12 g of CaCO3, 6 g of glucose, 1.8 g of yeast extract, 0.6 g of corn syrup, 0.3 g of KH2PO4, 0.18 g of MgSO4·7H2O, 18 g L−1 artificial seawater salts, and 600 mL of purified water, where 60 mL of the seed culture was transferred and incubated at 28 °C with shaking at 180 rpm for 12 days. The filtrated culture medium was extracted three times with EtOAc (30 L each) to afford a residue (3.0 g) after removal of the solvent under reduced pressure. The extract (3.0 g) was separated by reversed-phase MPLC (10–100% MeOH/H2O, 180 min, flow rate 20 mL min−1, UV detection at 210 nm) to afford twelve fractions (Fr.1–12). Subsequently, the fraction Fr.5 was purified by semipreparative RP-HPLC (Waters XBridge C18 column (Waters, 10 × 250 mm, 5 μm), 35% MeCN/H2O (2.0 mL min−1, UV detection at 215 and 280 nm)) to yield versiorcinol B (2, 2.7 mg, tR 40 min), versiorcinol C (3, 1.5 mg, tR 46 min), and versiorcinol A (1, 2.0 mg, tR 68 min).![[thin space (1/6-em)]](https://www.rsc.org/images/entities/char_2009.gif) ε) 221 (4.44), 279 (3.69) nm; IR (film) νmax 3327, 2958, 2925, 2861, 1700, 1594, 1495, 1468, 1362, 1318, 1291, 1260, 1228, 1153, 1120, 1092, 1053, 1030, 997 cm−1; 1H and 13C NMR data (DMSO-d6 at 80 °C), see Table 1; HRESIMS m/z 365.1371 [M + H]+ (calcd for C22H21O5, 365.1389).
ε) 221 (4.44), 279 (3.69) nm; IR (film) νmax 3327, 2958, 2925, 2861, 1700, 1594, 1495, 1468, 1362, 1318, 1291, 1260, 1228, 1153, 1120, 1092, 1053, 1030, 997 cm−1; 1H and 13C NMR data (DMSO-d6 at 80 °C), see Table 1; HRESIMS m/z 365.1371 [M + H]+ (calcd for C22H21O5, 365.1389).
(+)-1. Colorless solid; [α]25D +45.9 (c 0.0027, MeOH); CD (3.38 × 10⁻⁴ M, MeOH), λmax (Δε) 208 (27.9), 277 (−3.40) nm.
(−)-1. Colorless solid; [α]25D −46.5 (c 0.0027, MeOH); CD (3.38 × 10⁻⁴ M, MeOH), λmax (Δε) 209 (−28.7), 277 (3.37) nm.
(±)-Versiorcinol B (2). Colorless solid; UV (MeOH) λmax (log
![[thin space (1/6-em)]](https://www.rsc.org/images/entities/char_2009.gif) ε) 213 (4.45), 278 (3.53) nm; IR (film) νmax 3329, 2926, 2857, 1700, 1658, 1599, 1468, 1361, 1319, 1289, 1259, 1148, 1054, 1026, 997 cm−1; 1H and 13C NMR data (CD3OD at −40 °C), see Table 1; HRESIMS m/z 347.1266 [M + H]+ (calcd for C22H19O4, 347.1283).
ε) 213 (4.45), 278 (3.53) nm; IR (film) νmax 3329, 2926, 2857, 1700, 1658, 1599, 1468, 1361, 1319, 1289, 1259, 1148, 1054, 1026, 997 cm−1; 1H and 13C NMR data (CD3OD at −40 °C), see Table 1; HRESIMS m/z 347.1266 [M + H]+ (calcd for C22H19O4, 347.1283).
(+)-2. Colorless solid; [α]25D +37.6 (c 0.0029, MeOH); CD (3.61 × 10⁻⁴ M, MeOH), λmax (Δε) 214 (12.0), 270 (−1.83) nm.
(−)-2. Colorless solid; [α]25D −39.7 (c 0.0029, MeOH); CD (3.61 × 10⁻⁴ M, MeOH), λmax (Δε) 214 (−11.0), 276 (2.72) nm.
![[thin space (1/6-em)]](https://www.rsc.org/images/entities/char_2009.gif) ε) 218 (4.48), 279 (3.66) nm; IR (film) νmax 3328, 2924, 2856, 1700, 1619, 1596, 1496, 1467, 1423, 1323, 1288, 1259, 1217, 1147, 1055, 998 cm−1; 1H and 13C NMR data (DMSO-d6 at 80 °C), see Table 1; HRESIMS m/z 347.1266 [M + H]+ (calcd for C22H19O4, 347.1283).
ε) 218 (4.48), 279 (3.66) nm; IR (film) νmax 3328, 2924, 2856, 1700, 1619, 1596, 1496, 1467, 1423, 1323, 1288, 1259, 1217, 1147, 1055, 998 cm−1; 1H and 13C NMR data (DMSO-d6 at 80 °C), see Table 1; HRESIMS m/z 347.1266 [M + H]+ (calcd for C22H19O4, 347.1283).
(+)-3. Colorless solid; [α]25D +38.9 (c 0.0029, MeOH); CD (3.61 × 10⁻⁴ M, MeOH), λmax (Δε) 211 (20.5), 276 (−2.92) nm.
(−)-3. Colorless solid; [α]25D −39.9 (c 0.0029, MeOH); CD (3.61 × 10⁻⁴ M, MeOH), λmax (Δε) 208 (−23.6), 276 (3.37) nm.
Antibacterial activity assay
Racemates (±)-1, (±)-2, and (±)-3 and enantiomers (+)-1 and (−)-1, (+)-2 and (−)-2, and (+)-3 and (−)-3 were evaluated for antibacterial activities against Staphylococcus aureus ATCC25923, methicillin-resistant Staphylococcus aureus ATCC43300, Escherichia coli ATCC25922, Salmonella typhimurium SL1344, Acinetobacter baumanii ATCC19606, Klebsiella pneumoniae ATCC13883, and Enterococcus faecalis C1129 in 96-well microplates according to a previously published protocol.18,19,28 The final concentrations of each compound in the wells were 64, 32, 16, 8, 4, 2, 1, 0.5, 0.25, and 0.125 μg mL−1. Chloramphenicol was used as the positive control and exhibited MICs of 4, 8, 4, 2, 32, 2, and 4 μg mL−1, respectively, against the above mentioned bacteria.Cytotoxicity assay
The cytotoxic activities of racemates (±)-1, (±)-2, and (±)-3 and enantiomers (+)-1 and (−)-1, (+)-2 and (−)-2, and (+)-3 and (−)-3 against the human breast cancer cell MCF-7 and the lymphoma cell U937 were evaluated by the CCK-8 method as described previously.29 The MCF-7 and U937 cell lines were obtained from the Institute of Biochemistry and Cell Biology (Shanghai, China).Computational details
where δcalcdx is the calculated chemical shift x (in ppm) relative to tetramethylsilane (TMS), which is calculated at the same level of theory, and slope and intercept are the slope and intercept resulting from a regression calculation on a plot of δcalcd against δexptl.
Conflicts of interest
There are no conflicts of interest to declare.Acknowledgements
This research was supported by the National Natural Science Fund for Distinguished Young Scholars of China (81225023), the National Natural Science Fund of China (No. 41476121, 81402844, 81502936, 31600014, 41406139), the National High Technology Research and Development Program of China (863 Project, No. 2013AA092902), the Fund of the Science and Technology Commission of Shanghai Municipality (No. 15431900900), the Beijing Medical Award Foundation (No. YJHYXKYJJ-125).Notes and references
- P. Spiteller, Nat. Prod. Rep., 2015, 32, 971 RSC.
- J. W. Blunt, B. R. Copp, R. A. Keyzers, M. H. Munro and M. R. Prinsep, Nat. Prod. Rep., 2015, 32, 116 RSC.
- T. Bunyapaiboonsri, S. Yoiprommarat, K. Intereya and K. Kocharin, Chem. Pharm. Bull., 2007, 55, 304 CrossRef CAS PubMed.
- M. Chen, C.-L. Shao, X.-M. Fu, R.-F. Xu, J.-J. Zheng, D.-L. Zhao, Z.-G. She and C.-Y. Wang, J. Nat. Prod., 2013, 76, 547 CrossRef CAS PubMed.
- H. Gao, L. Zhou, S. Cai, G. Zhang, T. Zhu, Q. Gu and D. Li, J. Antibiot., 2013, 66, 539 CAS.
- X. Wang, Y. Mou, J. Hu, N. Wang, L. Zhao, L. Liu, S. Wang and D. Meng, Chem. Biodiversity, 2014, 11, 133 CAS.
- S.-S. Hu, N. Jiang, X.-L. Wang, C.-J. Chen, J.-Y. Fan, G. Wurin, H.-M. Ge, R.-X. Tan and R.-H. Jiao, Tetrahedron Lett., 2015, 56, 3894 CrossRef CAS.
- O. I. Zhuravleva, N. N. Kirichuk, V. A. Denisenko, P. S. Dmitrenok, E. A. Yurchenko, E. M. Min′ko, E. V. Ivanets and S. S. Afiyatullov, Chem. Nat. Compd., 2016, 52, 227 CrossRef CAS.
- X.-M. Hou, C.-Y. Wang, Z.-G. She, Y.-C. Gu and C.-L. Shao, Chem. Nat. Compd., 2016, 52, 478 CrossRef CAS.
- Z.-H. Wu, Y.-R. Wang, D. Liu and P. Proksch, Tetrahedron, 2016, 72, 50 CrossRef CAS.
- (a) S. Zenitani, S. Tashiro, K. Shindo, K. Nagai, K. Suzuki and M. Imoto, J. Antibiot., 2003, 56, 617 CrossRef CAS PubMed; (b) S. Zenitani, K. Shindo, S. Tashiro, M. Sekiguchi, M. Nishimori, K. Suzuki and M. Imoto, J. Antibiot., 2003, 56, 658 CrossRef CAS PubMed.
- J. F. Sanchez, Y. M. Chiang, E. Szewczyk, A. D. Davidson, M. Ahuja, C. Elizabeth Oakley, J. Woo Bok, N. Keller, B. R. Oakley and C. C. Wang, Mol. BioSyst., 2010, 6, 587 RSC.
- F.-Y. Du, X.-M. Li, J.-Y. Song, C.-S. Li and B.-G. Wang, Helv. Chim. Acta, 2015, 97, 973 CrossRef.
- V. Schroeckh, K. Scherlach, H. W. Nützmann, E. Shelest, W. Schmidt-Heck, J. Schuemann, K. Martin, C. Hertweck and A. A. Brakhage, Proc. Natl. Acad. Sci. U. S. A., 2009, 106, 14558 CrossRef CAS PubMed.
- Y. Li, W. Chang, M. Zhang, X. Li, Y. Jiao and H. Lou, PLoS One, 2015, 10, e0128693 Search PubMed.
- M. Kawatani, H. Okumura, K. Honda, N. Kanoh, M. Muroi, N. Dohmae, M. Takami, M. Kitagawa, Y. Futamura, M. Imoto and H. Osada, Proc. Natl. Acad. Sci. U. S. A., 2008, 105, 11691 CrossRef CAS PubMed.
- A. Satou, T. Morishita, T. Hosoya and Y. Ishikawa, Japanese patent application JP11001480, 1999.
- L.-J. Ding, B.-B. Gu, W.-H. Jiao, W. Yuan, Y.-X. Li, W.-Z. Tang, H.-B. Yu, X.-J. Liao, B.-N. Han, Z.-Y. Li, S.-H. Xu and H.-W. Lin, Mar. Drugs, 2015, 13, 5579 CrossRef CAS PubMed.
- L.-J. Ding, W. Yuan, X.-J. Liao, B.-N. Han, S.-P. Wang, Z.-Y. Li, S.-H. Xu, W. Zhang and H.-W. Lin, J. Nat. Prod., 2016, 79, 2045 CrossRef CAS PubMed.
- R. Ditchfield, Mol. Phys., 1974, 27, 789 CrossRef CAS.
- (a) M. W. Lodewyk, M. R. Siebert and D. J. Tantillo, Chem. Rev., 2012, 112, 1839 CrossRef CAS PubMed; (b) P. H. Willoughby, M. J. Jansma and T. R. Hoye, Nat. Protoc., 2014, 9, 643 CrossRef CAS PubMed.
- S. G. Smith and J. M. Goodman, J. Am. Chem. Soc., 2010, 132, 12946 CrossRef CAS PubMed.
- Use of the DP4 analysis is quite practical, owing to a versatile Java applet that the Goodman group has made available online, URL, http://www.jmg.ch.cam.ac.uk/tools/nmr/nmrParameters.html.
- (a) A. G. Kutateladze and O. A. Mukhina, J. Org. Chem., 2014, 79, 8397 CrossRef CAS PubMed; (b) A. G. Kutateladze and O. A. Mukhina, J. Org. Chem., 2015, 80, 5218 CrossRef CAS PubMed.
- Though we use two different DFT theory level for ΔG energies (B3LYP/6-311+G(2d,p) with PCM for DMSO at 353.15 K; B3LYP/6-31G(d) with PCM for DMSO at 353.15 K), increasing the basis set did not reduce the differences between calculated and experimental data (ESI, Tables S3–S5†). This anomaly and the small differences between measured and theoretical values are possibly due to imperfect conformer weightings in the DFT calculations (see ref. 24).
- H. Shanan-Atidi and K. H. Bar-Eli, J. Phys. Chem., 1970, 74, 961 CrossRef CAS.
- D. R. Kester, I. W. Duedall, D. N. Connors and R. M. Pytkowicz, Limnol. Oceanogr., 1967, 12, 176 CrossRef CAS.
- Z. G. Khalil, R. Raju, A. M. Piggott, A. A. Salim, A. Blumenthal and R. J. Capon, J. Nat. Prod., 2015, 78, 949 CrossRef CAS PubMed.
- W.-Z. Tang, Z.-Z. Yang, F. Sun, S.-P. Wang, F. Yang and H.-W. Lin, J. Asian Nat. Prod. Res., 2016, 691 Search PubMed.
- MacroModel, Schrödinger LLC, 2012, http://www.schrodinger.com/productpage/14/11/.
- M. J. Frisch, G. W. Trucks, H. B. Schlegel, G. E. Scuseria, M. A. Robb, J. R. Cheeseman, G. Scalmani, V. Barone, B. Mennucci, G. A. Petersson, H. Nakatsuji, M. Caricato, X. Li, H. P. Hratchian, A. F. Izmaylov, J. Bloino, G. Zheng, J. L. Sonnenberg, M. Hada, M. Ehara, K. Toyota, R. Fukuda, J. Hasegawa, M. Ishida, T. Nakajima, Y. Honda, O. Kitao, H. Nakai, T. Vreven, J. A. Montgomery, J. E. Peralta Jr, F. Ogliaro, M. Bearpark, J. J. Heyd, E. Brothers, K. N. Kudin, V. N. Staroverov, R. Kobayashi, J. Normand, K. Raghavachari, A. Rendell, J. C. Burant, S. S. Iyengar, J. Tomasi, M. Cossi, N. Rega, J. M. Millam, M. Klene, J. E. Knox, J. B. Cross, V. Bakken, C. Adamo, J. Jaramillo, R. Gomperts, R. E. Stratmann, O. Yazyev, A. J. Austin, R. Cammi, C. Pomelli, J. W. Ochterski, R. L. Martin, K. Morokuma, V. G. Zakrzewski, G. A. Voth, P. Salvador, J. J. Dannenberg, S. Dapprich, A. D. Daniels, O. Farkas, J. B. Foresman, J. V. Ortiz, J. Cioslowski and D. J. Fox, Gaussian 09, revision B.01, Gaussian, Inc., Wallingford, CT, 2010 Search PubMed.
- G. Barone, L. Gomez-Paloma, D. Duca, A. Silvestri, R. Riccio and G. Bifulco, Chem.–Eur. J., 2002, 8, 3233 CrossRef CAS.
- T. Bruhn, Y. Hemberger, A. Schaumlöffel and G. Bringmann, SpecDis version 1.50, University of Wuerzburg, Germany, 2010 Search PubMed.
- U. Varetto, MOLEKEL 5.4.,Swiss National Supercomputing Centre, Manno, Switzerland, 2009 Search PubMed.
Footnote |
| † Electronic supplementary information (ESI) available: Tables and figures giving HRESIMS, UV, IR, and 1D and 2D NMR spectra for compounds 1–3, the low energy conformers for a, b, c, 2, and 3, the computed NMR chemicals shifts and SSCCs for a and b, the in vitro antibacterial activity of racemates (±)-1, (±)-2, and (±)-3 and enantiomers (+)-1 and (−)-1, (+)-2 and (−)-2, and (+)-3 and (−)-3, and atom coordinates of the computed structures. See DOI: 10.1039/c7ra06106d |
| This journal is © The Royal Society of Chemistry 2017 |

