 Open Access Article
Creative Commons Attribution 3.0 Unported Licence
Suppression of degradation for lithium iron phosphate cylindrical batteries by nano silicon surface modification
Wenyu Yangab,
Zhisheng Wangab,
Lei Chenab,
Yue Chenab,
Lin Zhangab,
Yingbin Linab,
Jiaxin Liab and
Zhigao Huang *ab
*ab
aCollege of Physics and Energy, Fujian Normal University, Fujian Provincial Key Laboratory of Quantum Manipulation and New Energy Materials, Fuzhou, 350117, China. E-mail: zghuang@fjnu.edu.cn
bFujian Provincial Collaborative Innovation Center for Optoelectronic Semiconductors and Efficient Devices, Xiamen, 361005, China
First published on 4th July 2017
Abstract
Nano-scale silicon particles were successfully decorated uniformly on a LiFePO4@C electrode through utilization of spray technique. The electrochemical measured results indicate that the Si surface modification results in improved electrochemical performances for commercial 18![[thin space (1/6-em)]](https://www.rsc.org/images/entities/char_2009.gif) 650 cylindrical batteries, especially at elevated temperature, which is attributed to the fact that Si introduction can enable the LiFePO4 electrodes to suppress cylindrical battery degradation. Based on the analysis of structural characterization, it is revealed that the battery cathode with Si modification retains a better LiFePO4 phase and exhibits less Li+ loss. In addition, the negative electrode of the battery contains a better graphite carbon structure and a thinner thickness of SEI film due to Si decoration. Furthermore, the related high-temperature aging and degradation mechanisms of the batteries were discussed.
650 cylindrical batteries, especially at elevated temperature, which is attributed to the fact that Si introduction can enable the LiFePO4 electrodes to suppress cylindrical battery degradation. Based on the analysis of structural characterization, it is revealed that the battery cathode with Si modification retains a better LiFePO4 phase and exhibits less Li+ loss. In addition, the negative electrode of the battery contains a better graphite carbon structure and a thinner thickness of SEI film due to Si decoration. Furthermore, the related high-temperature aging and degradation mechanisms of the batteries were discussed.
Introduction
Recently, the commercial LiFePO4-based lithium-ion batteries (LFP-LIBs) have been widely applied in mobile phones, laptop computers and electric vehicles, because it demonstrates lots of advantages including environment friendliness, abundant source materials and high security.1–7 However, LFP-LIBs still suffer from the issue of significant capacity fading, especially at high temperature, due to possible catalytic effects of the metallic iron particles and the active lithium ions being intensively consumed to construct an interfacial film on the graphite electrodes.8,9 Thus, many useful strategies, such as carbon coating, metal nanoparticle attachment and surface modification of active materials or electrodes, have been developed to overcome these technical bottlenecks. Among them, surface modification is regarded as one of the most promising approaches for LFP-LIBs.10–12 The electrochemical performances of LiNi1/3Co1/3Mn1/3O2 were enhanced via employing atomic layer deposition to coat a solid-state electrolyte with an appropriate thickness directly onto a prefabricated electrode.10 Moreover, various metal oxides have been selected as a candidate material for directly coating electrode.11 Many semiconductor materials, especially including Si acted as an intermediate isolated layer were employed in the field of surface engineering, which can efficiently suppress transition cations from being dissolved from the active material causing by the attacking of HF in the electrolyte.13,14As a typical example, compared to pristine LiFePO4 electrodes, the electrodes decorated with nano-sized Si can display less coarsening degree, higher rate capability and better cycling performance, especially at elevated temperature.15 Guo et al.9 have exhibited that the LiFePO4/graphite soft-packed cell has noticeable capacity loss at high temperature even though several electrolyte additives have been added to greatly hold down Fe dissolution. It has been proposed that greatly consumption of active lithium results from continuous reformation/repairing of SEI layer, which was ascribed to SEI instability in electrolyte at elevated temperatures.16 In addition, the reports revealed that the degradation of LFP-LIBs is also leaded by the structural damage of active material resulting from the dissolution of Fe3+ into the electrolyte, impedance rise arising from the decrease of electrical conductivity for electrode sheet leaded by slack of contact between active particles, and lithium inventory loss associated with side reaction at electrode/electrolyte interface including the redox decomposition of the electrolyte, establishment of unstable solid electrolyte interface (SEI) films.17–19 Based on the preliminary understanding of aging mechanism for LFP-LIBs at high temperature, Si modification on the electrodes is an effective path to suppress the degradation of LFP and to obtain an excellent LIB performance.
Continuing with the above description, how to investigate the degradation of LFP materials and further to analysis the related aging mechanism is an eternal topic for the studies and application of LFP-LIBs.20,21 The phase transformations of LiFePO4 in Li+ intercalation/deintercalation have been investigated by means of XRD.22 However, it is difficult to exactly provide information about the surface properties of material. Fortunately, Raman spectroscopy (RS) has ability to detect the surface phase change for active cathode material accurately.23,24 According to previous research results, both internal and external modes were used to investigate the phase changes.25–27 In addition, Kelvin Probe Force Microscopy (KPFM) has also been considered as a novel surface characterization technique to study the aging mechanism of battery material surface on nanoscale by measuring surface potential.28,29 The surface potential is generally the electronic work function (EWF) difference between the sample and the tip, which is sensitive to the structural and chemical changes for the surface chemical composition. It can effectively reflect the micro variation of the electronic structure, providing vital information about surface destruction. Thus, using effective analytical methods including MS and KPFM to discuss the above topic is useful and much needed.
However, most reports were based on the different types of button cells using very small amount of active materials, which may lead to deviation from the actual situation of the commercial LIBs. Thus, for commercial LFP-LIBs, it is critically urgent to realize the Si surface decoration on LFP electrodes by a simple route, and to further reveal their high-temperature aging mechanism via effective analytical methods. In this paper, Si modified LFP electrodes successfully prepared with the technique of ultrasonic spray, combined with the anodic graphite electrodes, have been assembled in commercial 18![[thin space (1/6-em)]](https://www.rsc.org/images/entities/char_2009.gif) 650 cylindrical batteries. Compared to pristine LiFePO4 electrodes, the 18
650 cylindrical batteries. Compared to pristine LiFePO4 electrodes, the 18![[thin space (1/6-em)]](https://www.rsc.org/images/entities/char_2009.gif) 650 cylindrical batteries with Si modification can deliver obviously better LIB performances at room temperature and elevated temperature. It can be concluded that silicon surface modification implements suppression of degeneration of lithium ion batteries. Eventually, the aging and degradation mechanisms of the batteries were discussed by using effective analytical methods, such as RS and KPFM.
650 cylindrical batteries with Si modification can deliver obviously better LIB performances at room temperature and elevated temperature. It can be concluded that silicon surface modification implements suppression of degeneration of lithium ion batteries. Eventually, the aging and degradation mechanisms of the batteries were discussed by using effective analytical methods, such as RS and KPFM.
Experimental
LiFePO4/graphite cylindrical battery preparation
The positive electrodes were prepared by uniformly pasting a slurry consisting of 90 wt% active material (commercial LiFePO4 powder), 5 wt% Super-P and 5 wt% polyvinylidene fluoride (PVDF) dissolved in N-methyl-2-pyrrolidone on an aluminum foil. The negative electrodes were obtained by bonding the slurry mixed with commercial-grade graphite material, styrene butadiene rubber (SBR), carboxymethyl cellulose (CMC) and Super P onto a copper foil substrate. Silicon nanoparticles were uniformly deposited on the positive electrodes by a simple and novel spray technique, as seen in our previous work.15 On the process of spraying, the distance between nozzles and electrode sheet was controlled about 12 cm. Meanwhile, the spraying flow rate was controlled as 2 ml min−1. The compaction of positive and negative electrodes was finished by adjusting the best thickness in the large rolled and pressed device (LDHY400-N45). Here, the ratio of active material mass of negative electrode to that of positive electrode was chosen to be 0.453. Eventually, they were rolled together to make the battery core with a separator as isolating layer. Then this was packed into a cylindrical can and dried overnight at 85 °C under vacuum. The commercial electrolyte containing a lithium hexafluorophosphate (LiPF6) salt in 1![[thin space (1/6-em)]](https://www.rsc.org/images/entities/char_2009.gif) :
:![[thin space (1/6-em)]](https://www.rsc.org/images/entities/char_2009.gif) 1 ethyl carbonate (EC) and dimethyl carbonate (DMC) was injected into dried batteries in a glove box filled argon atmosphere. The fabricated batteries were conducted at 0.02C (1C = 1500 mA h) to build up a smooth SEI layer on the negative electrode surface. According to our previous report,15 the purchased commercial active materials of LiFePO4 and graphite can deliver the reversible capacities of ∼110 and ∼290 mA h g−1 at 1C tested rate. As expected, the cycling capacity for the 18
1 ethyl carbonate (EC) and dimethyl carbonate (DMC) was injected into dried batteries in a glove box filled argon atmosphere. The fabricated batteries were conducted at 0.02C (1C = 1500 mA h) to build up a smooth SEI layer on the negative electrode surface. According to our previous report,15 the purchased commercial active materials of LiFePO4 and graphite can deliver the reversible capacities of ∼110 and ∼290 mA h g−1 at 1C tested rate. As expected, the cycling capacity for the 18![[thin space (1/6-em)]](https://www.rsc.org/images/entities/char_2009.gif) 650 cylindrical batteries used in this work was designed to be ∼1400 mA h g−1 at 1C tested rate. Hereinafter, the batteries used pristine LiFePO4@C and Si modification of LiFePO4@C/Si as cathodic materials were named as battery A and battery B, respectively.
650 cylindrical batteries used in this work was designed to be ∼1400 mA h g−1 at 1C tested rate. Hereinafter, the batteries used pristine LiFePO4@C and Si modification of LiFePO4@C/Si as cathodic materials were named as battery A and battery B, respectively.
Electrochemical measurement for 18![[thin space (1/6-em)]](https://www.rsc.org/images/entities/h3_char_2009.gif) 650 cylindrical batteries
650 cylindrical batteries
The cycle performances of batteries A and B were measured in the voltage range 2.5 V to 3.95 V, under room temperature. After the two days storage in drying oven at 60 °C, the cycle performances for batteries A and B were measured at 60 °C in the same voltage range. The batteries were charged to 3.95 V at 0.2C via galvanostatic mode, then constant voltage charging was conducted until the current was less than 0.02C (1C = 1500 mA h). Hereafter, these were galvanostatically discharged to 2.5 V at 3C. Their rate performances of batteries A and B were conducted at room temperature. Their testing conditions for charging process were the same as the above. In the process of discharge, the batteries were discharged to 2.5 V at 0.5C, 1C, 2C and 3C at the conduction of constant current, respectively. In impedance measurement, the batteries A and B in fully discharge state down to 2.5 V in various cycles were recorded over the frequency range from 10 mHz to 100 KHz with an amplitude of 15 mV on electrochemical workstation (CHI660C).
Characterization of materials
The cycled batteries A and B were disassembled in glove box at fully-discharged state. Then, the stripping of long anode and cathode strips were finished carefully, after batteries were unrolled. Subsequently, the anode and cathode were washed several time with pure dimethyl carbonate (DMC) to totally remove electrolyte and dried under vacuum. The morphologies of electrode samples were characterized by a scanning electron microscope (SEM, Hitachi SU8010), which equipped with energy dispersive X-ray spectroscopy (EDS) and elemental mapping facilities. The phases of electrode materials were characterized by an X-ray diffraction (XRD, Rigaku MiniFlex II) using CuKα radiation (λ = 0.15405 nm) with a step of 8 degree per minute. The Raman spectra (RS) were carried out at room temperature by usage of HORIBA Jobin Yvon Evolution with laser excitation at 532 nm. To avoid damage of electrode material surface, the laser power was adjusted below 5 mW. The surface condition of the cycled electrodes was recorded through the X-ray photoelectron spectroscopy (XPS, Thermo Fisher ESCALAB 250Xi) using Al-Kα (1486.6 eV) radiation as excitation source operated at 150 W. Surface potential of samples were conducted with amplitude modulated Kelvin Probe Force Microscopy (KPFM, Dimension Icon). The value of the surface potential (VSP) is described by the following equation:
 | (1) |
Results and discussion
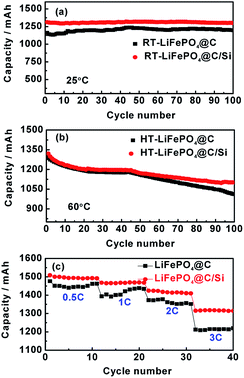
The cycle performances of LiFePO4@C and LiFePO4@C/Si at high rate of 3C and under 25 and 60 °C are displayed in Fig. 1a and b. From the Fig. 1a, the battery B can exhibit a stable reversible capacity of 1325 mA h g−1 tested at 3C rate after 100 cycles at room temperature, being obviously better than 1145 tested temperature to 60 °C, it could be observed from Fig. 1b that the capacities of both batteries exhibit evident capacity fade compared to 25 °C, which is similar to the previous report.30,31 Similarly, an reversible capacity of 1110 mA h g−1 for battery B is retained at 3C, while for the battery A only 1010 mA h g−1 is observed. This result reveals that Si modification does effectively suppress the degradation of cylindrical battery at elevated temperature. Fig. 1c shows the rate performances of cells A and B between 2.5 and 3.95 V at 25 °C. From the figure, it is found that battery B has higher capacity and rate capability than those of battery A, which further confirms that the introduction of silicon nanoparticles is beneficial for the electrochemical performance improvement of 18![[thin space (1/6-em)]](https://www.rsc.org/images/entities/char_2009.gif) 650 cylindrical batteries. Similar rate performances of cells A and B were also observed at 60 °C. Here, the content of Si on the electrode is about 2.45 at%, which is verified by EDS. In addition, the discharging curves of the batteries A and B under different current density are shown in Fig. 2a and b, respectively. And the discharge plateaus voltage as a function of C-rate is shown in Fig. 2c. From the figures, it is observed that the batteries A and B have a comparatively flat discharging voltage plateau. However, the curves for battery A become shorter and lower than that of battery B with the increase of current density, indicating that the cell B with silicon modification during discharging process has much higher energy storage. Moreover, it can be found that the discharging plateaus voltage of battery B are higher than those of battery A, implying that battery B possesses less internal resistance due to the introduction of silicon. In order to illustrate the variation of internal resistance, both batteries A and B under various conditions after 100 cycles were conducted by EIS. Fig. 3a and b show the typical Nyquist plots for both batteries A and B respectively, which is consist of an inductive tail, a small loop, a large loop, and a straight line. Here, one of loops may become too small to be observed or maybe two loops have partly overlapped. The appearance of inductive tail can be attributed to the geometry effects and being neglected.32 The higher frequency loop is believed to be come from the SEI components on the surface of electrode and the others in the medium frequency is derived from the charge transfer and the double layer effect.33 The straight line is assigned to the Li+ diffusion coefficient in a solid-phase electrode. As seen in Fig. 3a, the width of semicircle in the middle frequency for battery A is similar to those of battery B at 25 °C, which means that the total internal resistance of battery A is nearly equal to those of battery B. By fitting EIS date well, the Rct values of charge transfer resistance were found to be 2.73 mΩ and 2.98 mΩ for batteries A and B. However, the total impedance for battery A is obviously larger than that of battery B after 100 cycles under high temperature, as demonstrated by the larger semicircle of EIS spectra for the former, shown in Fig. 3b. The date fitting results show that the Rct values of batteries A and B is 27.5 mΩ and 2.16 mΩ at 60 °C, respectively. It implies that the increase of internal impedance for battery is suppressed by the protection of silicon for surface of cathode electrode. This is consistent with the results of cycle performances at 60 °C. As we know, the high-temperature LIB performance is an important indicator for practical application. Thus, the high-temperature aging and degradation mechanisms of the batteries were discussed in the following section.
650 cylindrical batteries. Similar rate performances of cells A and B were also observed at 60 °C. Here, the content of Si on the electrode is about 2.45 at%, which is verified by EDS. In addition, the discharging curves of the batteries A and B under different current density are shown in Fig. 2a and b, respectively. And the discharge plateaus voltage as a function of C-rate is shown in Fig. 2c. From the figures, it is observed that the batteries A and B have a comparatively flat discharging voltage plateau. However, the curves for battery A become shorter and lower than that of battery B with the increase of current density, indicating that the cell B with silicon modification during discharging process has much higher energy storage. Moreover, it can be found that the discharging plateaus voltage of battery B are higher than those of battery A, implying that battery B possesses less internal resistance due to the introduction of silicon. In order to illustrate the variation of internal resistance, both batteries A and B under various conditions after 100 cycles were conducted by EIS. Fig. 3a and b show the typical Nyquist plots for both batteries A and B respectively, which is consist of an inductive tail, a small loop, a large loop, and a straight line. Here, one of loops may become too small to be observed or maybe two loops have partly overlapped. The appearance of inductive tail can be attributed to the geometry effects and being neglected.32 The higher frequency loop is believed to be come from the SEI components on the surface of electrode and the others in the medium frequency is derived from the charge transfer and the double layer effect.33 The straight line is assigned to the Li+ diffusion coefficient in a solid-phase electrode. As seen in Fig. 3a, the width of semicircle in the middle frequency for battery A is similar to those of battery B at 25 °C, which means that the total internal resistance of battery A is nearly equal to those of battery B. By fitting EIS date well, the Rct values of charge transfer resistance were found to be 2.73 mΩ and 2.98 mΩ for batteries A and B. However, the total impedance for battery A is obviously larger than that of battery B after 100 cycles under high temperature, as demonstrated by the larger semicircle of EIS spectra for the former, shown in Fig. 3b. The date fitting results show that the Rct values of batteries A and B is 27.5 mΩ and 2.16 mΩ at 60 °C, respectively. It implies that the increase of internal impedance for battery is suppressed by the protection of silicon for surface of cathode electrode. This is consistent with the results of cycle performances at 60 °C. As we know, the high-temperature LIB performance is an important indicator for practical application. Thus, the high-temperature aging and degradation mechanisms of the batteries were discussed in the following section.
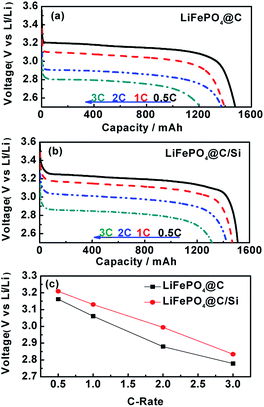 | ||
| Fig. 2 The discharging curves of batteries A (a) and B (b) at 0.5, 1C, 2C and 3C between 2.5 and 3.95 V, respectively; (c) the discharge plateaus voltage as a function of C-rate. | ||
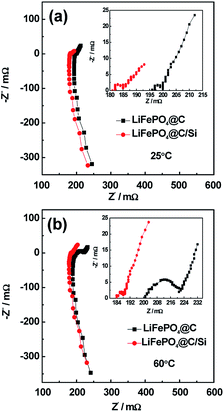 | ||
| Fig. 3 The electrochemical impedance spectroscopy of batteries A and B at fully discharge state down to 2.5 V during 100 cycles (a) at 25 °C and (b) 60 °C. | ||
To get more insight to the mechanism of Si modification suppression of capacity fading for the cycled 18![[thin space (1/6-em)]](https://www.rsc.org/images/entities/char_2009.gif) 650 cylindrical battery, the cycled battery A and B after 100 cycles at 60 °C were disassembled at fully discharge state. As found in Fig. 4, the three measured sites “1”, “2” and “3” on the anode and cathode electrodes for batteries A and B were chosen. Herein, the site “1” is the most near to the lead. Correspondingly, Fig. 5a and 6a compared the SEM images of graphite anodes for both batteries. Compared to the morphology at site “1” for the battery A in Fig. 5a, SEM image for battery B in Fig. 6a displays smoother surface without visible physical damage. The compact and smooth coating layer for electrode means that the battery B has relatively low contact resistance, thus improving the electrochemical performance at 60 °C. From Fig. 5c and 6c, it is also found that carbon, oxygen and phosphorus elements exist on the surface of anode except for iron element for both batteries. Here, it is suggested that oxygen comes from different organic and inorganic salts which are major components of SEI and phosphorus appearance comes likely from the reduction of PF6.34 Furthermore, Fig. 5b and 6b show element mappings of Fe for batteries A and B, respectively. From the figure, it is observed that Fe element is distributed uniformly on the both anodic electrode surfaces, which reveals that the dissolution Fe from LFP active material was deposited on the graphite anode surface. Especially, as confirmed by EDS, in comparison with 0.33 at% Fe deposition on site “1” of graphite electrode of battery A, that of battery B presents less value of ∼0.17 at%, indicating that Si modification effectively avoids the damage of active materials by means of the dangling bonds of silicon absorbing H+. It is worth mention that Fe deposition could catalyze the SEI formation on the surface of anode. And SEI continuous growth and rearrangement on carbon surface consume active Li+ simultaneously, which gives rise to the increase of the surface resistance. This is confirmed as a main reason to explain plenty of lithium loss during electrochemical cycles.35 It is not difficult to explain that the battery B with less Fe deposition content on the surface of the anode electrode has the better electrochemical performances. More Fe deposition intensifies the formation of thicker SEI and leads to more irreversible capacity loss. Due to brittle nature of thick SEI, the trace of cracking of anode electrode surface observed from Fig. 5a could also illustrate the existence of thicker SEI, further explaining that an amount of Fe element distributed on the anode electrode surface is associated with much irreversible capacity loss. On the other hand, EDS spectra at the site “2” and “3” for anode electrodes of batteries A and B were also detected. It is found that the sites “2” and “3” for battery A have 0.28 at% and 0.03 at% Fe contents. However, the sites “2” and “3” for battery B only own Fe contents of 0.04 at% and 0.0 at%, respectively. It demonstrates that the degree of degradation on different surface site is quite different. Moreover, it is clearly observed that the Fe contents of different sites on the anode electrode of battery A are all much more than those for battery B. These SEM and EDS measured results verify that silicon nanoparticle surface modification could prevent the cathode active materials from attacking of HF in the electrolyte and subsequently alleviates active Li+ loss.
650 cylindrical battery, the cycled battery A and B after 100 cycles at 60 °C were disassembled at fully discharge state. As found in Fig. 4, the three measured sites “1”, “2” and “3” on the anode and cathode electrodes for batteries A and B were chosen. Herein, the site “1” is the most near to the lead. Correspondingly, Fig. 5a and 6a compared the SEM images of graphite anodes for both batteries. Compared to the morphology at site “1” for the battery A in Fig. 5a, SEM image for battery B in Fig. 6a displays smoother surface without visible physical damage. The compact and smooth coating layer for electrode means that the battery B has relatively low contact resistance, thus improving the electrochemical performance at 60 °C. From Fig. 5c and 6c, it is also found that carbon, oxygen and phosphorus elements exist on the surface of anode except for iron element for both batteries. Here, it is suggested that oxygen comes from different organic and inorganic salts which are major components of SEI and phosphorus appearance comes likely from the reduction of PF6.34 Furthermore, Fig. 5b and 6b show element mappings of Fe for batteries A and B, respectively. From the figure, it is observed that Fe element is distributed uniformly on the both anodic electrode surfaces, which reveals that the dissolution Fe from LFP active material was deposited on the graphite anode surface. Especially, as confirmed by EDS, in comparison with 0.33 at% Fe deposition on site “1” of graphite electrode of battery A, that of battery B presents less value of ∼0.17 at%, indicating that Si modification effectively avoids the damage of active materials by means of the dangling bonds of silicon absorbing H+. It is worth mention that Fe deposition could catalyze the SEI formation on the surface of anode. And SEI continuous growth and rearrangement on carbon surface consume active Li+ simultaneously, which gives rise to the increase of the surface resistance. This is confirmed as a main reason to explain plenty of lithium loss during electrochemical cycles.35 It is not difficult to explain that the battery B with less Fe deposition content on the surface of the anode electrode has the better electrochemical performances. More Fe deposition intensifies the formation of thicker SEI and leads to more irreversible capacity loss. Due to brittle nature of thick SEI, the trace of cracking of anode electrode surface observed from Fig. 5a could also illustrate the existence of thicker SEI, further explaining that an amount of Fe element distributed on the anode electrode surface is associated with much irreversible capacity loss. On the other hand, EDS spectra at the site “2” and “3” for anode electrodes of batteries A and B were also detected. It is found that the sites “2” and “3” for battery A have 0.28 at% and 0.03 at% Fe contents. However, the sites “2” and “3” for battery B only own Fe contents of 0.04 at% and 0.0 at%, respectively. It demonstrates that the degree of degradation on different surface site is quite different. Moreover, it is clearly observed that the Fe contents of different sites on the anode electrode of battery A are all much more than those for battery B. These SEM and EDS measured results verify that silicon nanoparticle surface modification could prevent the cathode active materials from attacking of HF in the electrolyte and subsequently alleviates active Li+ loss.
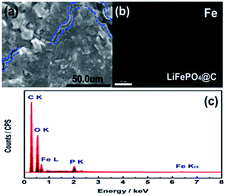 | ||
| Fig. 5 (a) SEM images, (b) element mappings of Fe, and (c) EDS spectrum of anode at site “1” for battery A after 100 cycles, at 3C and 60 °C. | ||
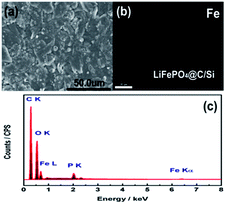 | ||
| Fig. 6 (a) SEM images, (b) element mappings of Fe, and (c) EDS spectrum of anode at site “1” for battery B after 100 cycles, at 3C and 60 °C. | ||
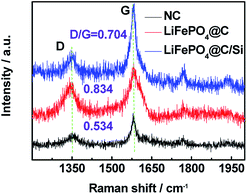
To further explore the change of surface microstructure of graphite anode under high-temperature cycling, the aged electrodes were analyzed by XPS and Raman tests. Fig. 7a and b show C 1s XPS spectra of anode at site “1” for batteries A and B after 100 cycles at 3C and 60 °C, respectively. According to the report,35 the C 1s XPS spectra for both batteries were fitted well. The sharp peak around 284.5 eV is assigned to sp2− bonded graphite (C–C). At higher binding energy, the shoulder peak at 285.7 eV belongs to typical carbon atoms as C–C (or C–H). The peak located at 289.7 eV is attributed to CO3 from SEI film, which is generally considered as (CH2OCO2Li)2, ROCO2Li and Li2CO3.36 By calculation, we can get that the area ratios of the peaks at 284.5 eV, 285.7 eV and 289.7 eV for battery A are 26.0%, 44.2%, 29.8%, respectively; while they for battery B are 33.9%, 43.6%, 22.5%, respectively. Through comparing, it can be found that relative peak area at 289.7 eV for battery A is bigger than that of battery B, which means that battery A has thicker SEI film. Moreover, relative peak ratio at 284.5 eV for battery B is larger than that of battery A, which means that battery B retains better graphite carbon structure. Furthermore, Fig. 7c and d show the Fe 2p XPS spectra for batteries A and B. The typical characteristic peaks at 710.7 and 725 eV referring to Fe 2p3/2 and Fe 2p1/2, indicated the appearance of iron oxide on the surface of the anode for both batteries.37,38 Especially, the presence of satellite peak at about 718.3 eV further confirms the existence of Fe2O3 on the surface of the anode.39 Moreover, from the XPS spectra, the contents of Fe element deposited on both graphite anodes for batteries A and B are found to be 1.19 at% and 0.76 at%, which is consistent with the results from EDS. It also demonstrates that the more Fe deposition intensifies indeed the formation of thicker SEI, which leads to more irreversible capacity fading.40 Zheng et al.36 proposed that the decomposition production of LiPF6 reacting with amounts of protic impurities can initiate an autocatalytic decomposition of electrolyte components, which causes metal ion dissolution, damage of the SEI on the carbon anode, and final capacity decay of battery. When Si is introduced on the surface cathode as a physical isolating layer, the decomposition speed of electrolyte components is slowed down and the destruction degree of cathode material is alleviated since the HF could not easily react with the cathode material. Fig. 8 shows Raman spectra for site “1” of both graphite electrodes after test and fresh graphite electrode for comparison, respectively. Herein, the relative intensity ratios between D and G peaks are associated with the disorder degree in carbon structure.41,42 It is found that the ID/IG values for batteries A and B are increased drastically after tested at 60 °C for 100 cycles, implying that a large disorder degree was induced on the both graphite anode surface. Noticeably, compared to battery B, battery A with larger value of 0.834 for ID/IG, suffers from obvious capacity loss, which is attributed to the severe destruction and reformation of SEI layer happening on the anode surface resulting in great active lithium consumption. Thus, combined the varied results in Fig. 5a and 6a, the compact and smooth anode for battery B has a thinner SEI film and less Fe element deposition on the graphite surface than those of battery A, being responsible for the improved LIB performance.
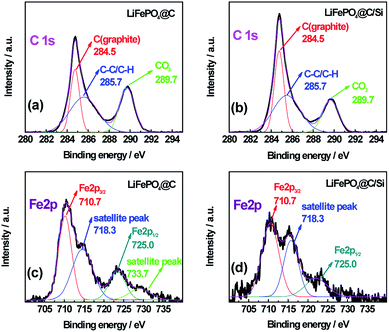 | ||
| Fig. 7 The C 1s XPS spectra of anode at site “1” for batteries A (a) and B (b), and the Fe 2p XPS spectra of anode at site “1” for batteries A (c) and B (d), after 100 cycles at 3C and 60 °C. | ||
In addition to the analysis for the graphite anode, the XRD and Raman have been used to analysis the LFP cathodes. The data detected from sites of “1”, “2” and “3” for XRD and Raman results were shown in Fig. 9 and 10, respectively. As displayed in Fig. 9a and b, almost diffraction peaks are indexed to orthorhombic olivine LFP (JCPDS no. 40-1499). From figures, two diffraction peaks around 18° and 31° are assigned to the phase of FePO4. The existence of FePO4 reveals that some Li+ released from LFP phase were consumed by the formation of SEI layer on the anode surface, which leads to the decrease of reversible capacity of the battery. It is worth mention that the peak at 17.1° corresponding to LFP phase (denoted with plum blossom) is sensitive with the extraction of Li+. Especially, the peak at 17.1° belong to LFP phase on the site “1” for Si modified electrode remains, indicating that battery B has the lower loss of capacity, which is associated with relative improved LIB performances at elevated temperature. In other words, battery B possesses the lower intensity of FePO4 phase, demonstrating that battery B encounters a small degree of Li+ consumption. Meanwhile, the other XRD results detected from sites “2” and “3” also support the above conclusion of site “1”. Comparing these three sites, different intensity of FePO4 observed in different site displayed that the different site experiences different Li+ consumption, which also affected by the electrode temperature during cycling. Fig. 10a and b show the Raman spectra tested at those three sites from cathodes of both batteries after 100 cycles at 60 °C. At the sites “1”, “2” and “3” of cathode electrode for battery B, there still exist the scatting peaks near 953 cm−1, which is ascribe to the Ag mode of ν1 in the internal modes of LiFePO4. This means that the surface of cathode electrode with silicon surface modification retains largely the structure of PO43−. On the contrary, as seen in Fig. 10b, the peak at 953 cm−1 disappears while the two weak peaks at 908 and 959 cm−1 belong to the internal modes of FePO4 are observed for the cathode electrode of battery A. Meanwhile, the other three peaks around 174 cm−1, 244 cm−1, 305 cm−1 corresponding to characteristic one for the external modes of FePO4 were found. The appearance of the above three peaks means a phase change from LiFePO4 to FePO4 due to an amount of lithium-ion loss during high rate at elevated temperature. It reveals that silicon nanoparticle modification supports effective protection for the surface of cathode electrode of the battery, and suppressing effectively the consumption of lithium-ion.
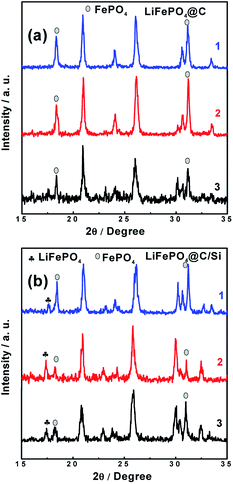 | ||
| Fig. 9 XRD patterns of cathode surfaces at sites “1”, “2” and “3” for (a) battery A, (b) battery B after 100 cycles, at 3C and 60 °C. | ||
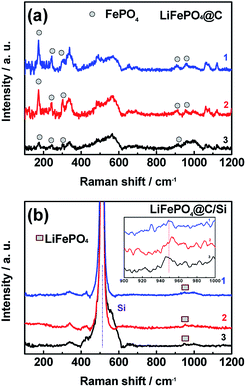 | ||
| Fig. 10 The Raman spectra of cathode surfaces at sites “1”, “2” and “3” for (a) battery A, (b) battery B after 100 cycles, at 3C and 60 °C. | ||
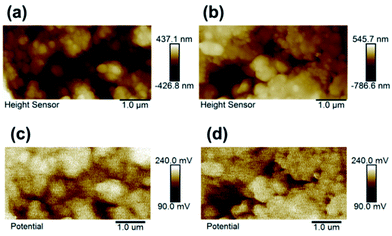
As we know, KPFM is a novel surface characterization technique to study the aging mechanism of battery material surface on nanoscale by measuring surface potential. Fig. 11 shows the surface height maps of site “1” of cathode for batteries A and B, respectively. From the figure, it is obviously observed that nano-scale silicon particles are still remained on the surface to hinder active material from being attacking even though experienced various cycles under elevated temperature. Within each surface potential map for site “1” of cathodes of batteries A and B, there exist no large difference in the contrast, as shown in Fig. 11c and d. However, their surface potentials and work functions have evident different. Fig. 12 shows the work function distribution curves of fresh LiFePO4@C, the aged LiFePO4@C and LiFePO4@C/Si. From the figure, one notices that the aged LiFePO4@C possesses larger work function and wider full width at half maximum (FWHM), which should be attributed to the increase of FePO4 phase on the surface of cathode due to the more loss of lithium ion during the battery aging. These results demonstrate again that Si modification effectively suppresses the consumption of Li+ due to on account of Li ions possessing the larger diffusion coefficient and less activation energy.43
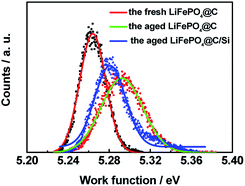 | ||
| Fig. 12 The work function distribution curves of the cathodes for fresh LiFePO4@C, batteries A and B after 100 cycles, at 3C and 60 °C. | ||
As is well known, the capacity fading of lithium-ion batteries mainly result from the irreversible side reactions between electrode interface and electrolyte in the electrochemical system. In view of the potentials of the two electrodes, it is more possible that these side reactions occur on the negative surface. As a result, a complicated SEI containing inorganic and organic Li salt components deposits on the anode surface, which plays an important role in allowing Li ion to pass and efficiently preventing reductive decomposition of the electrolyte components.44 However, in practice, the stability and compactness of SEI is almost depending on either its chemical or physical properties.45 Especially when a certain amount of the Fe dissolution from lithium iron phosphate was electroreduced on the anode surface, it could catalyze the formation of the roughness SEI layer. Taking account for instability of SEI, especially solubility at elevated temperature, a continuous development and rearrangement of the SEI film is carrying on during repeated electro-chemical cycles, which consumes more active lithium-ion leading to loss of capacity. To explain the growth and rearrangement of SEI film on surface of anode under repeated electro-chemical cycles, three different mechanisms have been proposed by Tan et al.16 Combining the catalysis of Fe for the formation of SEI and a continuous development and rearrangement of SEI, it is not difficult to understand for evident capacity loss of battery A, especially at elevated temperature. From another perspective, the observation of relative more Fe element distribution on the surface of anode electrode of battery A means that cathode active material drastically suffer from the destruction of HF in the electrolyte. It is responsible for the capacity fading for battery cycled at high temperature. On the basic of the above discussion, it is proposed that silicon surface modification implements suppression of degradation of 18![[thin space (1/6-em)]](https://www.rsc.org/images/entities/char_2009.gif) 650 battery with LiFePO4 cathode material. Meanwhile, it improves also the rate, cycling performances of the battery at high discharge rate, especially at elevated temperature.
650 battery with LiFePO4 cathode material. Meanwhile, it improves also the rate, cycling performances of the battery at high discharge rate, especially at elevated temperature.
Conclusions
In summary, Si modified LFP electrodes successfully prepared with the technique of ultrasonic spray, combined with the anodic graphite electrodes, have been assembled in commercial 18![[thin space (1/6-em)]](https://www.rsc.org/images/entities/char_2009.gif) 650 cylindrical batteries and used to investigate their aging mechanism for LFP. Both 18
650 cylindrical batteries and used to investigate their aging mechanism for LFP. Both 18![[thin space (1/6-em)]](https://www.rsc.org/images/entities/char_2009.gif) 650 cylindrical batteries were evaluated by cycling test and EIS, and their electrodes were characterized by EDS, SEM, XPS, XRD, Raman spectrum and Kelvin probe force microscopy, respectively. Compared with the batteries without Si modification, the results confirmed that, (a) the battery with modification contains better graphite carbon structure, less deposited Fe2O3 and thinner thickness of SEI film; (b) the cathode with Si modification remains better LiFePO4 phase, less Li+ loss and integrity of structure. Therefore, Si modification implements suppression of degeneration of LIBs at high temperature.
650 cylindrical batteries were evaluated by cycling test and EIS, and their electrodes were characterized by EDS, SEM, XPS, XRD, Raman spectrum and Kelvin probe force microscopy, respectively. Compared with the batteries without Si modification, the results confirmed that, (a) the battery with modification contains better graphite carbon structure, less deposited Fe2O3 and thinner thickness of SEI film; (b) the cathode with Si modification remains better LiFePO4 phase, less Li+ loss and integrity of structure. Therefore, Si modification implements suppression of degeneration of LIBs at high temperature.
Acknowledgements
We acknowledge the financial support by the Natural Science Foundations of China (No. 61574037, 21203025, 11344008, 11204038), Science and Technology Major Projects of Fujian Province (2013HZ0003), Project of Fujian Development and Reform Commission (2013-577), Educational Department of Fujian Province, China (JB14029). The authors gratefully acknowledge She-huang Wu for valuable discussions.Notes and references
- J. Vetter, P. Novak, M. R. Wagner, C. Veit, K. C. Moller, J. O. Besenhard, M. Winter, M. Wohlfahrt-Mehrens, C. Vogler and A. Hammouche, J. Power Sources, 2005, 147, 269–281 CrossRef CAS.
- M. Broussely, P. Biensan, F. Bonhomme, P. Blanchard, S. Herreyre, K. Nechev and R. J. Staniewicz, J. Power Sources, 2005, 146, 90–96 CrossRef CAS.
- R. F. Nelson, J. Power Sources, 2000, 91, 2–26 CrossRef CAS.
- K. Smith and C. Y. Wang, J. Power Sources, 2006, 160, 662–673 CrossRef CAS.
- E. M. Krieger, J. Cannarella and C. B. Arnold, Energy, 2013, 60, 492–500 CrossRef CAS.
- J. Kang, F. Yan, P. Zhang and C. Du, Energy, 2014, 70, 618–625 CrossRef CAS.
- M. Xu, Z. Q. Zhang, X. Wang, L. Jia and L. X. Yang, Energy, 2015, 80, 303–317 CrossRef CAS.
- D. J. Li, D. Dandslevelilov, L. Gao, Y. Yang and P. H. L. Notten, Electrochim. Acta, 2016, 210, 445–455 CrossRef CAS.
- Z. J. Guo and Z. L. Chen, J. Electroanal. Chem., 2015, 754, 148–153 CrossRef CAS.
- X. F. Li, J. Liu, M. NorouziBanis, A. Lushington, R. Y. Li, M. Cai and X. L. Sun, Energy Environ. Sci., 2014, 7, 768–778 CAS.
- X. F. Li, J. Liu, X. B. Meng, Y. J. Tang, M. NorouziBanis, J. L. Yang, Y. H. Hu, R. Y. Li, M. Cai and X. L. Sun, J. Power Sources, 2014, 247, 57–69 CrossRef CAS.
- B. Yan, X. F. Li, Z. M. Bai, Y. Zhao, L. Dong, X. S. Song, D. J. Li, C. Langford and X. L. Sun, Nano Energy, 2016, 24, 32–44 CrossRef CAS.
- X. Y. Dai, A. J. Zhou, J. Xu, B. Yang, L. P. Wang and J. Z. Li, J. Power Sources, 2015, 298, 114–122 CrossRef CAS.
- Q. Hao, C. X. Xu, S. Z. Jia and X. Y. Zhao, Electrochim. Acta, 2013, 113, 439–445 CrossRef CAS.
- W. Y. Yang, Z. Y. Zhuang, X. Chen, M. Z. Zou, G. Y. Zhao, Q. Feng, J. X. Li, Y. B. Lin and Z. G. Huang, Appl. Surf. Sci., 2015, 359, 875–882 CrossRef CAS.
- L. Tan, L. Zhang, Q. N. Sun, M. Shen, Q. T. Qu and H. H. Zheng, Electrochim. Acta, 2013, 111, 802–808 CrossRef CAS.
- N. Dupre, J. F. Martin, J. Degryse, V. Fernandez, P. Soudan and D. Guyomard, J. Power Sources, 2010, 195, 7415–7425 CrossRef CAS.
- M. Safari and C. Delacourt, J. Electrochem. Soc., 2011, 158, A1123–A1135 CrossRef CAS.
- K. Kumaresan, Q. Z. Guo, P. Ramadass and R. E. White, J. Power Sources, 2006, 158, 679–688 CrossRef CAS.
- B. Kang and G. Ceder, Nature, 2009, 458, 190–193 CrossRef CAS PubMed.
- K. Sun and S. J. Dillon, Electrochem. Commun., 2011, 13, 200–202 CrossRef CAS.
- Y. Bai, Y. F. Yin, J. M. Yang, C. B. Qing and W. F. Zhang, J. Raman Spectrosc., 2011, 42, 831–838 CrossRef CAS.
- C. M. Burba, J. M. Palmer and B. S. Holinsworth, J. Raman Spectrosc., 2009, 40, 225–228 CrossRef CAS.
- B. C. Burba and R. Frech, J. Electrochem. Soc., 2004, 151, A1032–A1038 CrossRef.
- J. Wu, G. K. P. Dathar, C. W. Sun, M. G. Theivanayagam, D. Applestone, A. G. Dylla, A. Manthiram, G. Henkelman, J. B. Goodenough and K. J. Stevenson, Nanotechnology, 2013, 24, 424009 CrossRef PubMed.
- D. Gouveia, V. Lemos, J. De Paiva, A. Souza Filho, J. Mendes Filho, S. Lala, L. Montoro and J. Rosolen, Phys. Rev. B: Condens. Matter Mater. Phys., 2005, 72, 024105 CrossRef.
- K. Xu, S. Zhang and T. R. Jow, Electrochem. Solid-State Lett., 2003, 6, A117–A120 CrossRef CAS.
- S. C. Nagpure, B. Bhushan and S. S. Babu, J. Power Sources, 2011, 196, 1508–1512 CrossRef CAS.
- S. Y. Luchkin, H. Y. Amanieu, D. Rosato and A. L. Kholkin, J. Power Sources, 2014, 268, 887–894 CrossRef CAS.
- K. Amine, J. Liu and I. Belharouak, Electrochem. Commun., 2005, 7, 669–673 CrossRef CAS.
- J. Shim, R. Kostecki, T. Richardson, X. Song and K. A. Striebel, J. Power Sources, 2002, 112(1), 222–230 CrossRef CAS.
- G. Nagasubramanian, J. Power Sources, 2000, 87, 226–229 CrossRef CAS.
- Y. D. Liu and J. Xie, J. Electrochem. Soc., 2015, 162, 2208–2217 CrossRef.
- M. Dubarry and B. Y. Liaw, J. Power Sources, 2009, 194, 541–549 CrossRef CAS.
- P. Verma, P. Maire and P. Novak, Electrochim. Acta, 2010, 55, 6332–6341 CrossRef CAS.
- L. P. Zheng, H. Zhang, P. F. Cheng, Q. Ma, J. J. Liu, J. Nie, W. F. Feng and Z. B. Zhou, Electrochim. Acta, 2016, 196, 169–188 CrossRef CAS.
- X. Zhu, X. Y. Song, X. L. Ma and G. Q. Ning, ACS Appl. Mater. Interfaces, 2014, 6, 7189–7197 CAS.
- Y. Huang, Z. X. Lin, M. B. Zheng, T. H. Wang, J. Z. Yang, F. S. Yuan, X. Y. Lu, L. Liu and D. P. Sun, J. Power Sources, 2016, 307, 649–656 CrossRef CAS.
- T. Fujii, F. De Groot, G. Sawatzky, F. Voogt, T. Hibma and K. Okada, Phys. Rev. B: Condens. Matter Mater. Phys., 2001, 59, 3195–3202 CrossRef.
- H. S. Song, Z. Cao, X. Chen, H. Lu, M. Jia, Z. A. Zhang, Y. Q. Lai, J. Li and Y. X. Liu, J. Solid State Electrochem., 2013, 17, 599–605 CrossRef CAS.
- R. Saito, T. Takeya and T. Kimura, Phys. Rev. B: Condens. Matter Mater. Phys., 1998, 57, 4145–4153 CrossRef CAS.
- V. A. Sethuraman, L. J. Hardwick, V. Srinivasan and R. Kostecki, J. Power Sources, 2010, 195, 3655–3660 CrossRef CAS.
- W. Y. Yang, M. Z. Zou, G. Y. Zhao, Z. S. Hong, Q. Feng, J. X. Li, Y. B. Lin and Z. G. Huang, Solid State Ionics, 2016, 292, 103–109 CrossRef CAS.
- K. Tasaki, A. Goldberg, J. J. Lian, M. Walker, A. Timmons and S. J. Harris, J. Electrochem. Soc., 2009, 156(12), A1019–A1027 CrossRef CAS.
- L. Castro, R. Deryvère, J. B. Ledeuil, J. Bréger, C. Tessier and D. Gonbeau, J. Electrochem. Soc., 2012, 159(4), A357–A363 CrossRef CAS.
| This journal is © The Royal Society of Chemistry 2017 |

