 Open Access Article
Research progress of Mn doped phosphors
Yamin Li,
Shuai Qi,
Panlai Li * and
Zhijun Wang
 *
*
College of Physics Science & Technology, Hebei Key Lab of Optic-Electronic Information and Materials, Hebei University, Baoding 071002, China. E-mail: li_panlai@126.com; wangzj1998@126.com
First published on 3rd August 2017
Abstract
In this review article, Mn applications have been divided into three parts. We provide an overview of recent progress in developing Mn4+ doped red phosphors for promising application in warm white light-emitting diodes. In addition, we summarize reports on Mn2+ co-doped Eu2+ or Ce3+ phosphors that can produce white light with outstanding color rendering index (CRI) and color coordinates via energy transfer processes, and report the application of Mn2+ in green to NIR phosphors.
1 Introduction
The valence electron configuration of transition metal elements is (n − 1)d1–8ns1–2, with the common characteristic that the d orbitals are not full. Since the energy of the (n − 1)d orbital is similar to that of the ns orbital, and the d electrons can completely or partially participate, there are no significant changes in the chemical properties from left to right in the same cycle. In addition, the transition metal elements can lose s electrons as well as d electrons; hence, the same element has a variety of valence states. Mn2+ and Mn4+ ions are commonly used as light-emitting centers. Nowadays, phosphor-converted white light emitting diodes (pc-WLEDs) based solid-state lighting has received much attention, due to the characteristics of high efficiency, high power efficiency, low applied voltage, reliability, long operation life and environmental friendliness, compared to other traditional lighting technologies, such as incandescent, halogen, xenon and fluorescent lamps.1–5 In order to obtain highly efficient WLED devices, several aspects should be taken into account and optimized, including semiconducting components, phosphors and packaging technologies. Phosphors are indispensable components of pc-WLED devices, which can decide the color rendering index, correlated color temperature, rated average life and luminous flux. One method for obtaining these materials is to combine yellow-emitting phosphors with highly efficient (Ga,In)N blue LEDS. For blue chips, Y3Al5O12:Ce3+ (YAG:Ce) is the commonly used phosphor; however, due to the lack of the red component of YAG:Ce phosphor, this approach has a poor color rendering index and a high correlated color temperature, which cannot fulfill the requirements for general illumination.6–9 According to Blasse, Mn4+ absorbs in the entire ultraviolet region and subsequently emits phosphorescence in the deep red (620–680 nm) region, due to transitions from 2E → 4A2,10 which indicates that the phosphor doped Mn4+ can be a good candidate for red fluorescent powder. It has been observed that multi-phase phosphor converted systems commonly lead to the strong reabsorption of the blue light by the red and green phosphors. Moreover, such a device is very complicated and expensive, and it is difficult to control the color balance. To solve the abovementioned problems, single-emitting component phosphors with UV LEDs chips, which have excellent color rendering indexes and high luminous efficiencies, have been researched. One of the way to generate white light from single-composition phosphors is by co-doping the sensitizer and activator into a crystalline matrix, with the principle of energy transfer from sensitizer to activator, such as Eu2+/Mn2+, Ce3+/Mn2+. Various white light based single-composition phosphors have obtained, such as CaAl2Si2O8:Eu2+,Mn2+,11 Ba3MgSi2O8:Eu2+,Mn2+,12 KMg4(PO4)3:Eu2+,Mn2+,13 BaSi3O4N2:Eu2+,Mn2+,14 Ca2Gd8(SiO4)6O2:Ce3+/Mn2+,15 and Ca9La(GeO4)0.75(PO4)6:Ce3+,Mn2+.16 Mn2+ is influenced by the crystal field, and hence it can easily change luminescence from green to deep red and even near-infrared (NIR). Because the near infrared light has the advantages of large penetration depth, less interference, etc., it has become an important topic in the field of optical fiber communication, solid state lasers, light emitting markers and fluorescence immunoassays. The applications of Mn ion doped phosphors are shown in Fig. 1.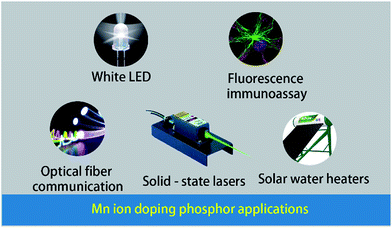 | ||
| Fig. 1 Applications of Mn ion doped phosphors.11,17,50 | ||
2 Application of Mn4+
2.1 Introduction to red phosphors
To date, the most practical phosphor is the blue LED chip excited YAG:Ce3+. In order to get white-light emission and a high CRI, improvements must be made by adding a high efficiency red emitting phosphor to the system to solve the problem of the lack of a red component; hence, several red phosphors have been developed. Red fluorescent powder can be divided into three categories: linear emission red phosphor excited by rare earth ions, broadband emission red phosphor excited by rare earth ions, and red phosphor excited by transition metals. With their own characteristics, excellent red phosphors can be obtained by a combination of these.Linear-emission phosphors excited by the rare ions Eu3+ and Sm3+ have pure color and high luminous efficiency; however, there is no wide excitation spectrum in the blue and UV regions, which results in a lower luminous efficiency. It is feasible to broaden the excitation spectrum and improve the luminous efficiency, although the effect is not ideal, but this limits the practical application of linear phosphors. Therefore, the application of red emitting Sm3+ or Eu3+ ions doped phosphors is limited in the present W-LEDs, due to their sharp absorption peaks in the blue and UV region.
In order to create a warm WLED, the development of efficient red phosphors is necessary. The new phosphors are mainly based on rare earth-doped schemes, such as Eu2+-doped nitrides, aluminates, oxynitrides and aluminosilicates. Among them, oxynitrides and nitrides have been the subject of maximal studies, due to their excellent performances, e.g., chemical stability and high thermostability; however, these materials must be synthesized at high temperatures and pressures. The strict preparation conditions and high price of raw materials lead to this phosphor being quite expensive. In addition, the reabsorption of the coexistent green emission of WLEDS is not avoided for Eu2+-doped red phosphors with blue absorption.18
2.2 Luminescence properties of transition metal ions
Transition metal ions have unfilled d orbitals, with the electronic configuration of 3dn (0 < n < 10). The Hamilton operator is as follows:| H = H0 + HCF + HC + HSO | (1) |
The 3d electron is in the outer layer, which is sensitive to the crystal environment; hence the HCF and the Coulomb energy between electrons (HC) can be compared. The crystal-field spectral term usually has two types of energy representations with weak crystal field and strong crystal field. We always apply the strong crystal field to deal with problems. The first consideration is how the d orbital is affected by the tetrahedral and octahedral crystal fields. The crystal field causes the five degenerate d orbitals to split into the doubly degenerate eg and triply degenerate t2g. The distance between eg and t2g is denoted as 10Dq, and Dq is a parameter to characterize the field strength of the octahedral.
With the single electron orbital wave function of eg and t2g as basic functions, considering the impact of Hc, a new intrinsic function is characterized by 2S+1Γ, where S is the total spin, and there is an irreducible representation of the octahedral group of the intrinsic state. The 2S+1Γ spectral term is similar to that used in the study of the free ion 2S+1L spectra of rare earth elements. The spin orbit interaction HS in transition metal ions is weaker than that of rare earth ions, which is usually treated by the perturbation theory and the deviation of the crystal field in the octahedral symmetry. These interactions cause 2S+1Γ to split into multiple states. The complete theoretical treatment of the transition metal ions eigenstate was given by S. Sugano and Y. Tanabe.19 Direct coulombic interactions (HC)dir between electrons are characterized by Racah parameters A, B, C
 | (2) |
 | (3) |
For the ll′ configuration, the k in F(k) is an even number from 2 to min (2l, 2l′). For transition metal ions with 3d electrons, the values can be 0, 2, 4. The relationship between Racah parameters and F(k) is as follows:
 | (4) |
 | (5) |
 | (6) |
Since the A parameter only affects the energy levels, we only consider B and C. The ratio of B/C for the all the transition metal ions is almost equal to 4.5, which can be seen as approximately constant. The distance between different spectra of each ion depends on the two parameters, Dq and B. In the work of S. Sugano and Y. Tanabe, the Tanabe–Sugano (T–S) (Fig. 2)19 diagram shows the relationship between the energy levels of metal ions E/B and crystal field strength Dq/B of the d2–d8 configurations in the crystal field. From the T–S graph, we can identify each excitation peak corresponding to energy levels in the excitation spectra.
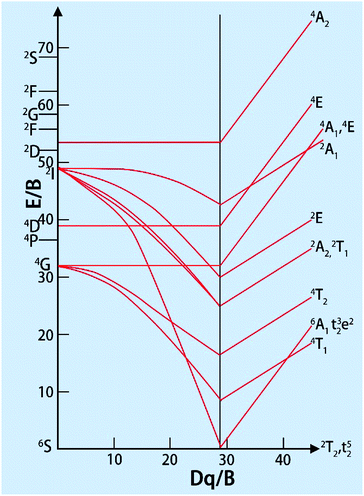 | ||
| Fig. 2 Tanabe–Sugano diagram for the d5 electron configuration.19 | ||
2.3 The transition of Mn4+ in the host20
Mn4+ doped materials, such as oxides and fluorides, are commonly used as red emitting phosphors. It was discovered that the Mn4+ ion can only be stabilized in an octahedral lattice site where it commonly shows strong and broad adsorptions ranging from 300 to 480 nm and emits red light between 600 and 700 nm with 5 sharp peaks. As the lowest energy state 2E(t23) hardly changes in different crystal fields, the luminescence properties are very similar from host to host, but intensely depend on the covalence of the Mn4+-ligand bonding.18 Moreover, Mn is magnetic and will produce local magnetic ions when introduced into luminescent materials; therefore, Mn may have huge potential application value.Doped in a solid, the Mn4+ ion has a strong crystal field, due to its highly effective positive charge. Consequently, the spin-forbidden 2Eg → 4A2g transition (sharp line) always controls the emission spectrum of Mn4+, while two broad bands corresponding to the 4A2g → 4T1g(4F) and 4A2g → 4T2g spin-allowed transitions are observed in the excitation spectra. The third spin-allowed transition (4A2g → 4T1g(4P)) frequently remains under cover by the host lattice absorption and the charge transfer. The 2Eg → 4A2g transition has a wide variation, which is due to the energy of the 2Eg state in the d3 electronic configuration being independent of crystal field (Fig. 3).21
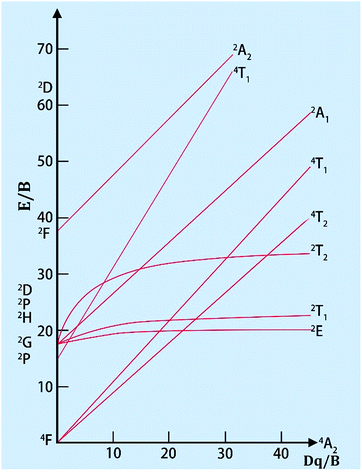 | ||
| Fig. 3 Tanabe–Sugano diagram for the d3 electron configuration in an octahedral crystal field.21 | ||
2.4 Spectroscopic parameters of Mn4+ in different hosts21
The positions of zero-phonon lines in the 2Eg → 4A2g spin-forbidden transition of the Mn4+ ion, ‘host cation ligand’ bond distance and Racah parameter B have been summarized numerous crystals. On an average, the distance from Mn4+ to ligand in the fluoride crystals (about 1.67–1.86 Å) is the shortest and the following trends (Fig. 4) are formulated from the graphical representations of the data gathered in Table 1, which is suitable for most compounds. The B values are greater in fluorides and thus, the emission lines of 2Eg–4A2g are significantly increased in oxides and in materials with the garnet structure (up to 2.11 Å), as shown in Table 1. The energy difference among the 4A2 → 4T2 and the 4A2 → 4T1 transitions and the Racah parameter B can be derived from the expression22–24
 | (7) |
 | (8) |
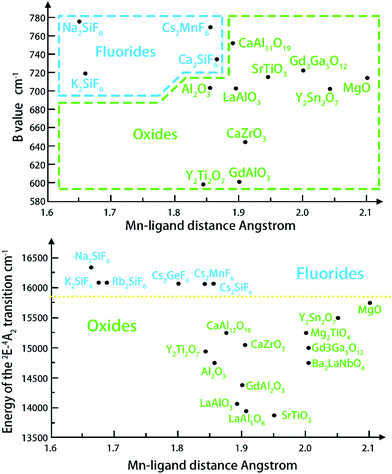 | ||
| Fig. 4 Relationship between the Mn4+ ligand21 bond distance and the Racah parameter B (top), and the position of the 2Eg level (bottom).21 | ||
| Host | Cation–ligand distance, Å | Racah parameter B, cm−1 | Position of the 2Eg level, cm−1 |
|---|---|---|---|
| Na2SiF6 | 1.674 | 775 | 16![[thin space (1/6-em)]](https://www.rsc.org/images/entities/char_2009.gif) 207 207 |
| K2SiF6 | 1.6829 | 719 | 16![[thin space (1/6-em)]](https://www.rsc.org/images/entities/char_2009.gif) 109 109 |
| Rb2SiF6 | 1.689 | 625 | 16![[thin space (1/6-em)]](https://www.rsc.org/images/entities/char_2009.gif) 082 082 |
| Cs2GeF6 | 1.798 | 16![[thin space (1/6-em)]](https://www.rsc.org/images/entities/char_2009.gif) 038 038 |
|
| Cs2SiF6 | 1.867 | 722 | 16![[thin space (1/6-em)]](https://www.rsc.org/images/entities/char_2009.gif) 033 033 |
| Cs2MnF6 | 1.857 | 775 | 16![[thin space (1/6-em)]](https://www.rsc.org/images/entities/char_2009.gif) 031 031 |
| Mg2TiO4 | 1.948 | 700 | 15![[thin space (1/6-em)]](https://www.rsc.org/images/entities/char_2009.gif) 253 253 |
| CaZrO3 | 1.9137 | 650 | 15![[thin space (1/6-em)]](https://www.rsc.org/images/entities/char_2009.gif) 054 054 |
| Gd3Ga5O12 | 2.005 | 722 | 14![[thin space (1/6-em)]](https://www.rsc.org/images/entities/char_2009.gif) 980 980 |
| Al2O3 | 1.858 | 700 | 14![[thin space (1/6-em)]](https://www.rsc.org/images/entities/char_2009.gif) 786 786 |
| GdAlO3 | 1.903 | 600 | 14![[thin space (1/6-em)]](https://www.rsc.org/images/entities/char_2009.gif) 347 347 |
| LaAlO3 | 1.895 | 700 | 14![[thin space (1/6-em)]](https://www.rsc.org/images/entities/char_2009.gif) 045 045 |
| LiAl5O8 | 1.900 | 13![[thin space (1/6-em)]](https://www.rsc.org/images/entities/char_2009.gif) 966 966 |
|
| SrTiO3 | 1.952 | 719 | 13![[thin space (1/6-em)]](https://www.rsc.org/images/entities/char_2009.gif) 827 827 |
| Y2Ti2O7 | 1.844 | 600 | 14![[thin space (1/6-em)]](https://www.rsc.org/images/entities/char_2009.gif) 956 956 |
| Y2Sn2O7 | 2.048 | 700 | 15![[thin space (1/6-em)]](https://www.rsc.org/images/entities/char_2009.gif) 563 563 |
| GaAl12O19 | 1.8791 | 750 | 15![[thin space (1/6-em)]](https://www.rsc.org/images/entities/char_2009.gif) 241 241 |
| MgO | 2.1135 | 722 | 15![[thin space (1/6-em)]](https://www.rsc.org/images/entities/char_2009.gif) 809 809 |
| Ba2LaNbO6 | 1.9975 | 670 | 14![[thin space (1/6-em)]](https://www.rsc.org/images/entities/char_2009.gif) 680 680 |
The Racah parameter C can be evaluated by the following expression, according to the peak energy of 2Eg → 4A2g obtained from the emission spectrum.
 | (9) |
The local crystal-field strength Dq is determined by the mean peak energy of the 2A2 → 4T2 transition according to the following expression:
 | (10) |
The 2Eg level is always lower for oxides; however, the value of B is also close to that of fluorides in some special cases (Fig. 4). What causes the condition is that the position of the 2Eg level also depends on the value of the second Racah parameter C.25–27
Such a distinct and explicit separation of fluorides and oxides with respect to the energy position of the 2Eg level indicates the potential role of the Mn4+ ion as a reliable indicator of covalency/ionicity of a particular host. On the other hand, Mn4+ luminescence exhibits sharp emission lines and broad excitation bands in the ultraviolet–blue region, which makes it suitable for excitation by UV and decreases the re-absorption effect when mixing with other yellow and green phosphors. With so many unique features, Mn4+ can meet the requirement of an ideal red phosphor for warm LEDS. Moreover, the easy to obtain and cheap manganese raw materials are able to reduce the red phosphors. As a consequence, many researchers have focused on developing the Mn4+ activated red phosphors (Table 2).
| Chemical composition | λex (nm) | λem (nm) | Incorporated site | Ref. |
|---|---|---|---|---|
| BaTiF6:Mn4+ | 367, 468 | 634 | Ti4+ | 35 |
| Na2SiF6:Mn4+ | 360, 460 | 600–650 | Si4+ | 36 |
| Na3GaF6:Mn4+ | 460 | 630 | Ga3+ | 37 |
| Sr2MgAl22O36:Mn4+ | 312 | 658 | Al3+ | 38 |
| CaAl12O19:Mn4+ | 325, 457 | 600–700 | Al3+ | 39 |
| Li2MgGeO4:Mn4+ | 323 | 671 | Ge4+ | 40 |
| (K,Rb)2Ge4O9:Mn4+ | 295, 460 | 620–727 | Ge4+ | 41 |
2.5 Examples of Mn4+ doped red phosphors
Numerous researchers have focused on the oxide host, due to their outstanding performance such as high stability. Peng et al. have synthesized an efficient red oxide phosphor Sr4Al14O25:Mn4+,28 which is prepared by a traditional solid-state reaction in much milder conditions. The red emission intensity of Sr4Al14O25:Mn4+ is greater than that of the reported commercial phosphors, such as (K,Rb)2Ge4O9:Mn4+ (ref. 29) and CaAl12O19:Mn4+.30A series of novel red emitting Mg3Ga2GeO8 under near-UV excitation was successfully synthesized by Ding et al. with the traditional high-temperature solid-state reaction.31 In this Mg3Ga2GeO8 system, there is one tetrahedral site, which is occupied by Ge4+/Ga3+, and an octahedral site, occupied by Mg2+/Ga3+. According to radius analysis and luminescence properties of Mg3Ga2GeO8:x%Mn4+, we can conclude that Mn4+ reliably occupies the Mg2+/Ga3+ site in this system. When using MnCO3 as the raw material, the intensity of the emission is relatively weak, compared to the sample of MnO2 as the raw material and the peak shape does not change. In the MnCO3, the same Mn2+ can just be oxidized to Mn3+, rather than Mn4+, as shown in Fig. 5. The emission properties of Mg3Ga2GeO8:x%Mn4+ are also shown in Fig. 5. It can be easily seen that the emission intensities reach a maximum at x = 0.5% and the calculated full-width at half-maximum (FWHM) of the Mn4+ emission spectrum is 24 nm, which indicates that the Mg3Ga2GeO8:x%Mn4+ phosphor possesses high color purity. Furthermore, Mg3Ga2GeO8:0.5%Mn4+ exhibits outstanding quantum efficiency (64.7%).
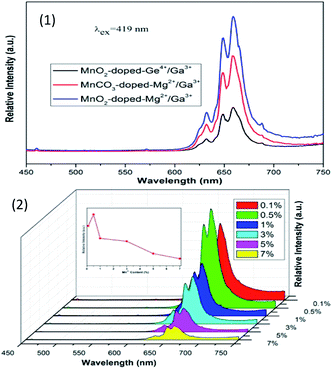 | ||
| Fig. 5 (1) PL properties of samples with different Mn sources and doped sites. (2) PL under 419 nm excitation of the Mg3Ga2GeO8:x%Mn4+ series phosphors.31 | ||
The oxide matrix with strong covalent, low thermal vibration and weak polarizability is favourable for red light emission. The Mn4+ doped Y3Al5O12 phosphor was prepared by a high temperature solid state reaction method. Huang et al. synthesized the Y3Al5O12:Mn4+ red phosphor and explored its luminescence properties. At 467 nm, this phosphor emits red light.31 The main emission peaks are at 643 and 670 nm, all from the 5E → 4A2 transition of Mn4+ in Y3Al5O12:0.01Mn4+. The CIE of the Y3Al5O12:0.01Mn4+ phosphor is (0.701, 0.299) located in the red area. The excitation spectrum of the emission peak at 670 nm is composed of 400, 450, 468, 474, 482 and 494 nm wide excitation bands.
Novel red-emitting phosphors K2BaGe8O18:Mn4+ were synthesized via the high temperature solid-state reaction method.32 The excitation spectrum of K2BaGe8O18:Mn4+ monitored at 666 nm shows a wide band with two evident peaks at 319 and 468 nm. Upon 468 nm excitation, the emission spectrum presents a narrow band from 600 to 700 nm (red region) with the maximum emission at around 666 nm, which originates from the 2Eg–4A2 transition of Mn4+ in the GeO6 octahedral environment, as shown in Fig. 6; the CIE coordinates of the phosphors are (0.702, 0.298) and the QY is 32.9% upon 365 nm excitation. The results indicate that this kind of phosphor can be a supplement of red-components in UV and blue light excited w-LEDs.
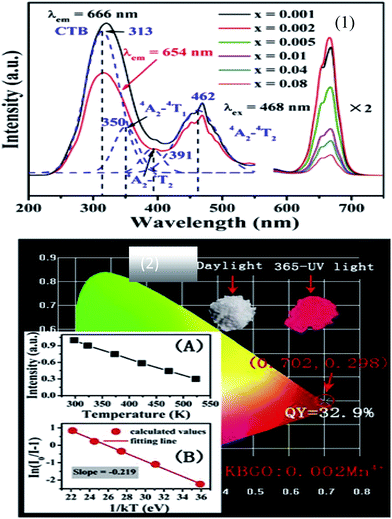 | ||
| Fig. 6 (1) PL spectra of K2BaGe8O18:Mn4+ with different concentrations, and PL excitation spectra of the K2BaGe8O18:0.002Mn4+ sample monitored at 666 nm and 654 nm. (2) Chromatic CIE coordinates, quantum yields and variation of emission intensity depending on the temperature of the representative K2BaGe8O18:Mn4+.32 | ||
In the oxide matrix, Mn4+ ions replace cations such as Al3+, Si4+, Zr4+, Ti4+, Ge4+, and occupy the center of the octahedron. When Mn4+ replaces ions with different valences, charge compensation is required. Therefore, the emission intensity of the phosphor can be enhanced by performing charge compensation. Mg2+ has been very extensively researched as a highly efficient charge compensator. The substitution of the Mg4+–Mg2+ ion pair to replace the Al3+–Al3+ ion pair was made under the condition that no additional charge compensation and oxygen atoms are required. Ge4+, Ca2+, Li+, Na+, K+, Cl− can also be used as charge compensators to enhance the luminescence properties of red phosphors.33,34 Different charge compensators have different effects on the red luminescence properties of Mn4+.
The chemical stability of fluorides is appropriate, and the phonon energy is relatively low, so fluorides can be used as the host material for various luminescent rare earth ions. Na2SiF6:Mn4+ red fluoride phosphors have been synthesized by the exothermic reduction reaction method, as shown in Fig. 7.36 The phosphors have intense blue-light absorption and strong narrow-band red emission. When the Na2SiF6:Mn4+ red phosphor was fabricated, a prominent improvement in the CRI of white LEDs was observed. The Na2SiF6:Mn4+ phosphors have efficient red luminescence excited by blue light, which is a potential candidate for improving the color reproducibility of white LEDs with simple post-processing, a short reaction time and high yield.
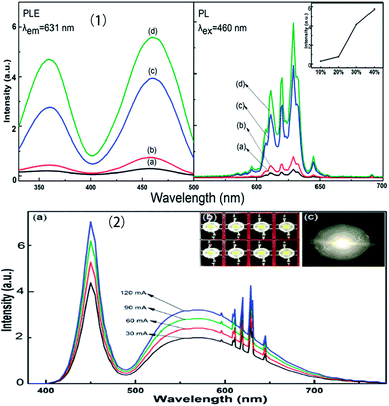 | ||
| Fig. 7 (1) Excitation and emission spectra of the Na2SiF6:Mn4+ phosphor with HF concentrations of (a) 10, (b) 20, (c) 30, and (d) 40 wt%. (2) Luminescence spectra based on the Na2SiF6:Mn4+ phosphor under various drive currents.36 | ||
Mn4+-activated fluoride phosphors, such as A2BF6 (A = Na, K, Rb, Cs; A2 = Ba, Zn; B = Si, Ge, Ti, Zr, Sn), have attracted considerable attention as highly promising red phosphors for warm white light emitting diodes (w-LEDs). These fluoride phosphors have been synthesized via traditional chemical routes with HF-solution. In addition to the possible dangers of hypertoxic HF, the uncontrolled precipitation of fluorides and the extensive processing steps produce large morphological variations, limiting its application. Recently, Song made a prototype w-LED with K3AlF6:Mn4+ as the red light component, via an efficient and water-processable cation-exchange green route.42 Combined with YAG:Ce3+, the prototype of the sample shows an efficient luminous efficacy beyond 190 lm W−1, along with an excellent color rendering index (CRI, Ra = 84) and a lower correlated color temperature (CCT = 3665 K), as shown in Fig. 8.
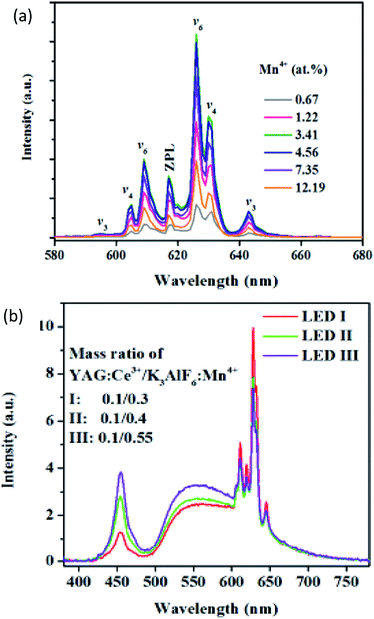 | ||
| Fig. 8 (a) Concentration dependent emission spectra of K3AlF6:Mn4+. (b) Electroluminescence spectra of prototype LEDs, employing K3AlF6:Mn4+ as the red converter component, commercial yellow YAG:Ce3+ and a blue InGaN chip at a 40 mA drive current.42 | ||
Thus far, Mn4+ as an activator doped oxide/fluoride red phosphor has attracted significant attention, due to its special advantages such as relatively simple synthesis methods and low cost. The spectral positions produced by the 2Eg → 4A2g transition can be modified, and the excitation region of the phosphor is located in the ultraviolet and blue band. Therefore, the Mn4+ doped red phosphor can be used as a substitute for rare earth doped red phosphors, and has a bright future in the field of warm white LEDs.
Although a large number of Mn4+ doped red phosphors have been fully studied, there are still some questions worthy of further exploration. For the Mn4+ doped oxide host phosphor, it is desirable to achieve a blue shift of emission from deep red to orange/red and enhanced absorption in the blue wavelength region. One possible solution is doping to increase the absorption in the blue wavelength region for Sr4Al14O25:Mn4+ doped Mg2+; because the neighboring Mn4+–Mn4+ is replaced by Mn4+–Mg2+, the non-radiative decay rate of the 2Eg state decreases and the luminous intensity of the phosphor is enhanced. For fluoride phosphors, how to improve their thermal stability and resistance to humidity needs further study. Surface treatment by external coating can improve the thermal stability and moisture resistance. Finally, the quantum efficiency of materials can be further improved by optimizing synthesis methods and reducing the lattice defects of materials.
3 Application of Mn2+
3.1 Application of Mn2+ in green to NIR phosphors
Most phosphors applied in white LEDs are oxides, sulfides or nitrides doped with rare-earth ions, which play a significant role in controlling the color of the light. Most of these rare-earth ions are very expensive and some chloride and oxide doped rare-earth elements are toxic and harmful, which limit their development. Consequently, the search for a cheap and nontoxic phosphor has become an important research area and Mn2+ doped oxides and nitrides have become hot research topics. With the d electrons within the 3d shell, Mn2+ emission can be affected by the crystal field, which results in the emission changing from green to red. When Mn2+ is located in the tetrahedral crystal field, it can emit green light. In other words, through changing the crystal field conditions, the spin-forbidden Mn2+ forbidden d–d transition (4T1 → 6A1) can emit green light.Rare earth ions (Eu2+, Eu3+, or Pr3+) or transition metal elements (Cr3+ or Mn2+) can serve as luminescence centers in NIR phosphors. However, for biological applications, these hygroscopic sulphides of Eu2+ show a succession of problems in metal-activated oxide compounds, such as Cr3+ or Mn2+-doped phosphors, which have outstanding chemical stability and suitable chemical instability. Lately the focus has shifted to the transition-emission range in the optical window (from 650 to 1300 nm) and long-lasting persistent luminescence. With the advantages of high signal to noise ratio, deep tissue penetration, and maximum transparency for silicon-based optical fibers and so on, near infrared (NIR) emitting materials have distinct potential for medical diagnostics, laser systems, and optoelectronic devices.43–45 On the basis of coordination and the T–S diagram, due to weaker crystal symmetry (angular constraints) and stronger ligand field strength (interionic distance) than that of the four/six-coordinated environments, it is feasible to speculate that the five/seven-coordinated environments of the Mn2+ ion are good for NIR emission generation.46–49 There is a complete list of known green to NIR persistent phosphors activated by Mn2+ in Table 3.
| Host material | Incorporated site | Emission region (nm) | Ref. |
|---|---|---|---|
| CdSiO3 | Cd2+(VI) | 550–720 | 50 |
| MgGeO3 | Mg2+(VI) | 600–720 | 51 |
| Li2ZnGe3O8 | Zn2+(VI) | 700–900 | 52 |
| Ga3(PO4)2 | Ca2+(VI) | 600–750 | 53 |
| Ga9Ln(PO4)7 | Ca2+(VI) | 600–750 | 54 |
| (Mg1−xZnx)2.97(PO4)2 | Mg2+/Zn2+(VI) | 630–800 | 55 |
| KMgBO3 | Mg(VI) | 600–700 | 56 |
| MgAl2O4 | Mg(IV) | 500–560 | 57 |
| Na2MgGeO4 | Mg(IV) | 500–550 | 58 |
| KAlSi2O6 | Al/Si(IV) | 500–540 | 59 |
| Zn2GeO | Zn(II) | 500–570 | 60 |
The rare-earth-free narrow-band green-emitting KAlSi2O6:Mn2+ phosphor has been synthesized by Ding et al. The excitation and emission spectra are shown in Fig. 9. The five distinct peaks of PL excitation are in good agreement with the Mn2+ absorption transitions; specifically, it can match blue GaN chips, which make its application in white LEDs possible. Moreover, a green light emission peak at 513 nm with full-width at half-maximum of 30 nm can be seen from Fig. 9, which is attributed to the spin forbidden d–d transition (4T1 → 6A1) of Mn2+. The electrons could be relaxed from these excited states to the 4T1(G) state by a non-radiative relaxation process and then be transferred back to the ground state 6A1(S), emitting the characteristic green (513 nm) light. The CIE color coordinates of the KAlSi2O6:Mn2+ phosphor were calculated to be x = 0.27 and y = 0.64, which are much closer to the standard green coordinates (0.21, 0.71). The integrated emission intensity of KAS:3%Mn2+ decreased to 67.6% (250 °C) of the initial value (25 °C). The chromaticity coordinates of the fabricated white LED are (0.35, 0.36) with CCT of 4775 K. It is demonstrated that the KAlSi2O6:Mn2+ phosphor could be simulated to blue-LED for producing efficient white-light.
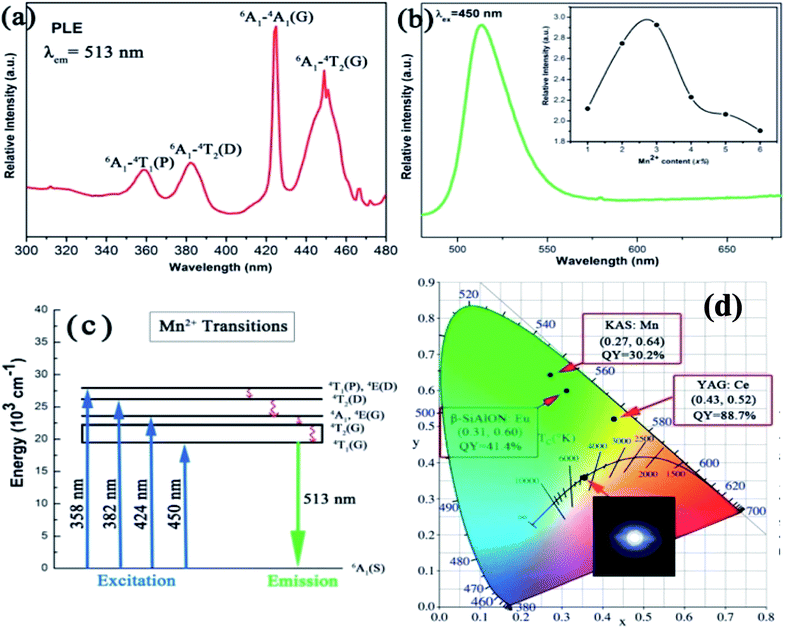 | ||
| Fig. 9 (a) Photoluminescence excitation of KAlSi2O6:Mn2+; (b) photoluminescence emission spectra of KAlSi2O6 phosphors, inset: dependence of the emission intensity of KAlSi2O6:Mn2+ phosphors on Mn2+ content; (c) the excitation and emission transitions of Mn2+ ions; (d) the CIE chromaticity coordinates and their respective quantum yields. The inset shows the phosphor simulated white light using blue (455 nm) LED.59 | ||
Moreover, good performance Mn2+ doped Na2MgGeO4 phosphors have been reported. Under UV or electron beams, the samples show bright green emission, which is ascribed to the 4T1(4G)–6A1(6S) transition of the Mn2+ ions. Based on this transition, the following phosphors were developed: Na2Mg1−xSiO4:xMn2+ green phosphors, with CIE coordinates of (0.163, 0.631) and CTT value of 8643 K,61 NaAl11O17:Mn2+ green phosphors, with CIE chromaticity coordinates of (0.0725, 0.6468), and quantum efficiency of 67.84%, with excitation of 424 nm,62 Zn2SiO4:Mn2+ green phosphors, which exhibit widely tunable CCTs ranging from 3200 to 7000 K and color rendering indices up to 85%, depending on the mixture ratio.63 Those phosphors with good performance indicators can be candidates for high power pcWLED applications. In addition, MgAl2O4:Mn2+,57 Zn2SiO4:Mn2+,64,65 green phosphors have also been reported.
Song et al. have reported the realization of single-band NIR UC emission in a Mn2+-doped KZnF3 nanostructure by a heavy doping strategy.66 Fig. 10 shows the emission spectra of KZn1−xMnxF3 upon 396 nm light excitation. There is a single visible emission located at 585 nm when Mn2+ concentration is less than x = 0.10, corresponding to the 4T1g(G) → 6A1g(S). An anomalous NIR emission band located at 770 nm appears when x = 0.10, while at x = 0.30, there is a sharp decrease due to the concentration quenching effect, where visible and NIR emission bands are featured from two different emission centers. The luminescence decay curves (Fig. 10(c) and (d)) were studied in order to obtain more insight into the active centers. The visible emission exhibited single exponential decay at a low concentration (x = 0.01 and 0.05), and the decay lifetime was estimated by the following equation:
I(t) = I0 + A![[thin space (1/6-em)]](https://www.rsc.org/images/entities/char_2009.gif) exp(−t/τ) exp(−t/τ)
| (11) |
 | (12) |
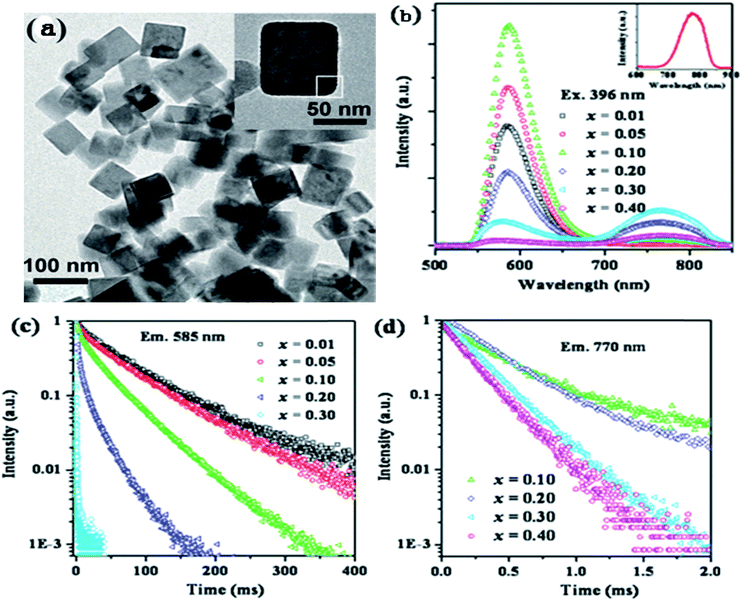 | ||
| Fig. 10 (a) TEM image of KZn0.80Mn0.20F3 nanocrystals and a typical nanocrystal (inset). (b) Emission spectra and (c) luminescence decay curves at 585 nm and (d) 770 nm for KZn1−xMnxF3 (x = 0.01–0.40). The inset in (b) shows the emission spectrum of KMnF3. The emission spectra and luminescence decay curves were obtained upon excitation with 396 nm light.66 | ||
To study the reason for the observed unusual NIR emission in KZn1−xMnxF3, the crystal structure of KZnF3 and the activation process of Mn2+ were further analyzed. KZnF3 has a typical cubic perovskite structure with a Pm![[3 with combining macron]](https://www.rsc.org/images/entities/char_0033_0304.gif) m space group with its lattice constant a = 0.405 nm, as shown in Fig. 10(a). Zn2+ is substituted by the incorporated Mn2+ ions, leading to the formation of Mn2+(Zn2+)–Mn2+(Zn2+) dimmers, especially at a high doping concentration. The ground state (6A1, S = 5/2) and the first excited state (4T1, S = 3/2) are split due to the exchange interaction between Mn2+ and Mn2+ ions, which are mainly governed by the linear combination of two spin states, Si and Sj (i.e., (Si + Sj), …, (Si − Sj)).67 Therefore, the spin state is S = 5, 4, 3, 2, 1, and 0 for the ground state (6A1g(S)6A1g(S)) and S = 4, 3, 2, and 1 for the first excited state (6A1g(S)4T1g(G)). The Mn2+–Mn2+ dimmers can also serve as the chromophoric centers, and the observed NIR luminescence is most likely related to the radiative transition from the excited state (S = 1) to the ground state with various spin components. There could be a shift in the emission peak caused by the changes in the spin components. The reason for decay lifetime shortening may be that the spin selection rule has changed from spin forbidden (S = 5/2 → S = 3/2) to spin allowed (S = 1 → S = 1), hence, it is reasonable to suggest that the NIR emission in KZn1−xMnxF3 originates from the 6A1g(S)4T1g(G) → 6A1g(S)6A1g(S) transitions of coupled Mn2+–Mn2+ dimmers.
m space group with its lattice constant a = 0.405 nm, as shown in Fig. 10(a). Zn2+ is substituted by the incorporated Mn2+ ions, leading to the formation of Mn2+(Zn2+)–Mn2+(Zn2+) dimmers, especially at a high doping concentration. The ground state (6A1, S = 5/2) and the first excited state (4T1, S = 3/2) are split due to the exchange interaction between Mn2+ and Mn2+ ions, which are mainly governed by the linear combination of two spin states, Si and Sj (i.e., (Si + Sj), …, (Si − Sj)).67 Therefore, the spin state is S = 5, 4, 3, 2, 1, and 0 for the ground state (6A1g(S)6A1g(S)) and S = 4, 3, 2, and 1 for the first excited state (6A1g(S)4T1g(G)). The Mn2+–Mn2+ dimmers can also serve as the chromophoric centers, and the observed NIR luminescence is most likely related to the radiative transition from the excited state (S = 1) to the ground state with various spin components. There could be a shift in the emission peak caused by the changes in the spin components. The reason for decay lifetime shortening may be that the spin selection rule has changed from spin forbidden (S = 5/2 → S = 3/2) to spin allowed (S = 1 → S = 1), hence, it is reasonable to suggest that the NIR emission in KZn1−xMnxF3 originates from the 6A1g(S)4T1g(G) → 6A1g(S)6A1g(S) transitions of coupled Mn2+–Mn2+ dimmers.
Near-infrared (NIR) emitting Li2ZnGe3O8 (LZG):xMn2+ has been synthesized by a conventional solid state reaction.52 The excitation spectrum (PLE) and emission spectrum (PL) of the LZG:xMn2+ (x = 0.005, 0.01, 0.03, 0.05, 0.07, 0.10, 0.15, 0.20) phosphors are presented in Fig. 11(a) and (b), respectively. The emission spectrum shows a broad emission band from 650 to 900 nm, with the main peak at 832 nm. The luminescence properties can be strongly affected by the crystal field within the 3d shell with an increase in Mn2+ concentration. The PL (λem = 832 nm) intensity rapidly increases, while above this maximum intensity (0.03), a concentration quenching phenomenon occurs, as shown in Fig. 11(d). Essentially, quenching impurities cause concentration quenching, a decline in the emission intensity, as shown in Fig. 11. Non-radiative energy transfer, which include exchange interactions, radiation reabsorption and multipolar interactions between Mn2+ ions within a certain distance, lead to concentration quenching. According to calculations, the concentration quenching of Mn2+ ions originates from quadrupole–quadrupole interactions. Besides, the phosphor has a good thermal stability, which expands the scope of its application.
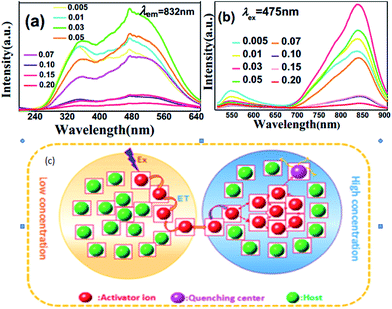 | ||
| Fig. 11 (a) PLE and (b) PL spectra of the LZG:xMn2+ samples (0 < x < 0.2). (c) A diagram of the concentration quenching process.52 | ||
Energy transfer between ions is a rather common and very important physical phenomenon, mainly through physical processes such as collision, energy exchange, and re-absorption of radiation and radiationless transition processes, which cause the ion energy transfer to other ions. Due to the relatively rich energy levels of transition metal ions, especially in the crystals, the energy splitting is affected by the influence of the crystal field, thus becoming more intensive. At this point, there may be the possibility of energy differences between the two levels of the transition metal ions, equal to the difference between other ions. In order to achieve the energy transfer between ions, radiative or radiationless transition processes occur very easily under the action of multipole moments.
Radiationless transitions play a significant role in photophysics, photobiology and photochemistry, and include internal conversion (IC) (spin-allowed process) and intersystem crossing (ISC) (spin-forbidden process). A simplified Jablonski diagram is presented in Fig. 12, which describes the elementary processes of molecular luminescence.68
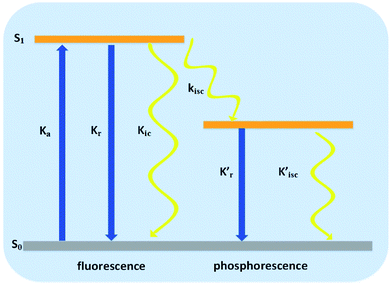 | ||
| Fig. 12 Elementary photophysical processes of molecular luminescence.68 | ||
Absorption
 | (13) |
Fluorescence
 | (14) |
Internal conversion
 | (15) |
Intersystem crossing
 | (16) |
Phosphorescence
 | (17) |
Intersystem crossing
 | (18) |
These elementary processes determine whether a molecule can be a good candidate for a dye molecule for organic solar cells or LED. Besides, there are two other significant elementary processes described in the following:
Phonon-induced electron transfer
 | (19) |
Phonon-induced energy transfer
 | (20) |
All the processes involve two electronic states, i.e., they are non-adiabatic in nature. Vibrational relaxation (VR) exists in molecular luminescence as a non-radiative process, which can happen in either the ground or excited electronic states. The radiative transfer process is also called resonant transmission, if there is a near field force interaction between the two centers and if the energy of light radiation transfer can be one atom to 10 nm, without the help of other nearest neighbor atoms. Dexter first introduced the transfer mechanism to the energy transfer process between the centers of the luminous material, and derived a formula for the probability of resonance energy transfer between the centers. There is an assumption that emission from the ion overlaps another ion, absorbing light, so the light emitting radiation energy is absorbed by another ion, and energy transfer occurs. The former is called the energy sensitizer and the latter is called the activator. Overlap between the emission spectra of the sensitizer and the excitation spectra of the activator is a prerequisite for the occurrence of resonant transmission. Resonant transmission is a quite significant means of energy transfer in the material activated by rare earth or transition metal elements and organic crystals. In this way, there are two centers S and A, where the center initial state is S* + A, i.e., the S center is in the excited state, the A center is in the ground state. The final state is S + A, i.e., the S center is back to the ground state, and the A center is in the excited state. Taking S and A as the dipoles, the transition probability from the initial state to the final state is the S, A resonance energy transfer probability PSA:
 | (21) |
 is the measured lifetime of S* state, and the R0 is defined as:
 | (22) |
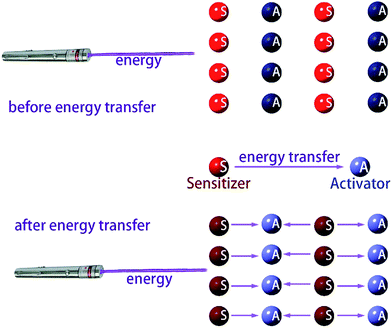 | ||
| Fig. 13 Schematic diagram of the energy transfer, the dark and light colors indicate the level of energy. | ||
3.2 The basic properties of Mn2+
In the last few years, non-rare earth-based eco-friendly phosphors prepared under milder conditions have received increasing interest.69 The outer electronic structure of Mn2+ is 3d54s2.70,71 On the basis of the Mn2+ Tanabe–Sugano diagram, the emission of Mn2+ can be easily changed from green to deep red by transforming the crystal field strength. Because the transition is 4T1 → 6A1, Mn2+ has broad band emission in the visible range, depending on the crystal field. Octahedral coordinated Mn2+ shows an orange to red emission, while tetrahedral coordinated Mn2+ shows green emission. The luminescence spectrum of Mn2+ consists of a structureless band at peak wavelengths of 490–750 nm, with the half width of 1000–2500 cm−1. In general, the crystal field at a tetrahedral site is weaker than that of an octahedral site. When Mn2+ is in a weak crystal field, the splitting of the excited energy in orbitals is small, resulting in a higher energy of Mn2+ emission, but its energy is low. Generally, when Mn2+ is substituted for alkaline-earth metals (Ga2+, Sr2+, Ba2+), the larger lattice distortion is not conducive to the direct excitation of Mn2+, which makes it difficult to achieve direct luminescence. Therefore, Mn2+ is not suitable for individually serving as an activator with low luminescence efficiency.Though Mn2+ ions emit red light from d → d transitions, the 4T1(4G) → 6A1(6S) emission in the 3d electron configuration is weak because it is forbidden, which leads to weak absorption in the ultraviolet region and disparate fluorescence properties in different hosts. However, on introducing Eu2+ or Ce3+ as co-activators, the excitation of Mn2+ is covered by the emission of Eu2+ or Ce3+, which creates the necessary conditions for vibrational transmission, i.e., there is overlap between the emission of the activator and the excitation of the sensitizer. Meanwhile, there may be energy transfer between the sensitizer and activator. On the basis of the resonance energy transfer mechanism, the excitation energy of the sensitizer can induce the activator to emit fluorescence, while the fluorescence intensity decays. White light can be obtained by co-doping Ce3+/Mn2+ or Eu2+/Mn2+ under effective resonance-type energy transfer; a schematic diagram of energy transfer is shown in Fig. 14.72–74
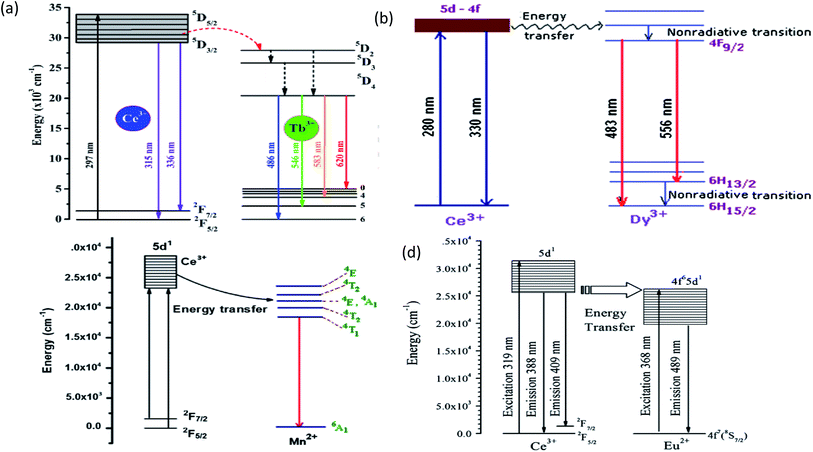 | ||
| Fig. 14 (a) The schematic energy level diagram for the energy transfer process in the BaMgF4:Cex3+,Tby3+ phosphors.75 (b) Energy level diagram of KNaSO4:Ce,Dy.79 (c) Energy transfer diagram of Ce3+ → Mn2+.82 (d) Schematic energy-level diagram of Ce3+ and Eu2+.85 | ||
3.3 The co-doping of Ce3+/Mn2+
The outer electronic structure of Mn2+ is 3d5, which presents typical d–d transitions when excited. Its photoluminescence range changes from 500 to 700 nm, which depends on the crystal field environment; however the d–d transition of Mn2+ is forbidden by the selection rules, and the luminescence is very weak since it can only be indirectly excited using sensitized ions or the substrate itself for energy transfer. A large number of studies have been conducted on the mechanism of energy transfer, e.g., Ce3+ → Tb3+, Ce3+ → Mn2+, Ce3+ → Dy3+ Ce3+ → Eu2+, etc., as shown in Table 4, which indicates that the Ce3+ ion is a highly efficient ion. The energy level diagram of the energy transfer about Ce is shown in Fig. 14.| Host | Energy transfer | λex (nm) | λem (nm) | Ref. |
|---|---|---|---|---|
| BaMgF4 | Ce3+ → Tb3+ | 297 | 488, 545, 584 | 75 |
| Ca10(PO4)6S | Ce3+ → Tb3+ | 280, 430, 545 | 410, 550 | 76 |
| Sr2MgSi2O7 | Ce3+ → Tb3+ | 228 | 542 | 77 |
| Sr3Gd2(Si3O9)2 | Ce3+ → Tb3+ | 348 | 540, 550 | 78 |
| KNaSO4 | Ce3+ → Dy3+ | 280 | 330, 483, 556 | 79 |
| (Dy0.03CexY0.97−x)3Al5O12 | Ce3+ → Dy3+ | 327, 367 | 496, 582 | 80 |
| Mg3Ca3(PO4)4 | Ce3+ → Mn2+ | 362, 410, 418 | 352, 645 | 81 |
| K2AEP2O7 (AE = Ca, Sr) | Ce3+ → Mn2+ | 320 | 534, 539 | 82 |
| Ca4(PO4)2O | Ce3+ → Eu2+ | 350 | 460, 630 | 83 |
| Ca4Y6O(SiO4)6 | Ce3+ → Eu2+ | 356, 280 | 426, 527 | 84 |
| Na3Ca6(PO4)5 | Ce3+ → Eu2+ | 319 | 391, 487 | 85 |
The outermost electron configuration of Ce3+ is 4f1, which can change to a lower energy level of 5d when absorbing energy. The 5d electronic excited state is different from the 4f electronic state, which is easily shielded by 5s25p6, resulting in the crystal field having a great influence on it, so the 4f–5d transition of Ce3+ in the 200–400 nm spectral region often exhibits strong absorption and excitation spectra.
Ca2Gd8(SiO4)6O2:Ce3+,Mn2+ has been prepared by Li et al.,86 and the emission spectra are shown in Fig. 15 for different concentrations of Ce3+ and Mn2+. The phosphors emit blue to white light, and with the increased Mn2+ concentration, there was complete conversion to yellow light when excited by UV irradiation, due to the 5d–4f transition of Ce3+ and the 4T1 → 6A1 transition of Mn2+, respectively. It is noteworthy that the emission peaks of Mn2+ have a slightly red shift from 564 nm to 570 nm. The Ce3+ ion simultaneously occupies the 4f and 6h sites in the Ca2Gd8(SiO4)6O2 host, and gives different blue emission under different UV excitation. Energy transfer from Ce3+ → Mn2+ also exists in the phosphor, hence, via precise control of the contents of Mn2+ and Ce3+, a wide-range white emission can be obtained. On the other hand, changing excitation sources is another way to obtain the color-tunable emission in a signal phase host. PLE and PL spectra of the LEDs (light emitting diodes) and FEDs (field emission displays) of the Ce3+, Mn2+ co-doped phosphors, NaCaBO3:Ce3+,Mn2+ were also studied, which have potential applications in the field of white EDS. It has been shown that for the crystal structure of NaCaBO3, the relative PL intensity of blue to yellow emission increases with the increase of the excitation wavelength from 287 to 330 nm. Moreover, Ca2Gd8(SiO4)6O2:Ce3+,Mn2+, has a good CL coefficient (K/S) relation, which was used to calculate the measured reflectance (R) for NaCaBO3, to probe the absorption of the host lattice.87
 | (23) |
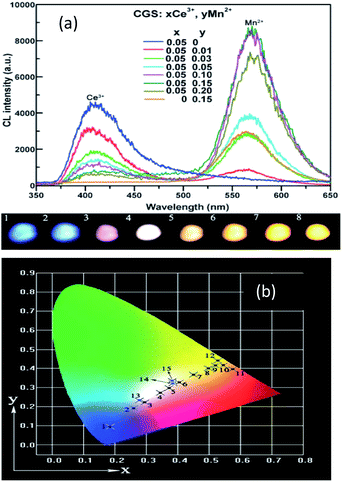 | ||
| Fig. 15 (a) Emission spectra and luminescence properties of CGS:xCe3+,yMn2+ samples. (b) The CIE chromaticity diagram for Ca2Gd8(SiO4)6O2:0.05Ce3+,yMn2+ samples under 287 nm UV excitation.86 | ||
From Fig. 16(1) and (2), it is seen that there exists a spectral overlap between the PL spectrum of NaCa0.99BO3:0.01Ce3+ and the PLE spectrum of NaCa0.96BO3:0.03Mn2+, indicating that a resonance-type energy transfer from the Ce3+ to Mn2+ ions is expected in the co-doped sample. Due to the energy transfer between the sensitizer Ce3+ and the activator Mn2+, the emission color is adjustable, which can be turned from blue to white and then to orange light. With the increase in Mn2+ concentration from 0.005 to 0.10, the emission peak of the Mn2+ ions shift toward the long wavelength range from 595 to 610 nm, which can be put down to the change in crystal field strength, as shown in Fig. 16. The relevant optical transitions and energy transfer processes are also demonstrated according to the schematic energy level diagram. The optical properties of a well-packaged WLED lamp by combining the selected NaCa0.96BO3:0.01Ce3+,0.03Mn2+ sample, gave a CCT value of 4046 K, CRI value of 90.7, and CIE chromaticity coordinates of (0.326, 0.274), which is superior to those ((0.292, 0.325), Ra = 75, TC = 7756) of an InGaN-based WLED relying on a blue LED chip coated with YAG:Ce.89
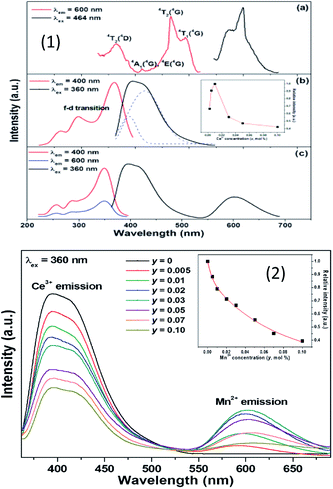 | ||
| Fig. 16 (1) Emission spectrum of NaCa0.992−yBO3:0.01Ce3+,yMn2+, and the function between the emission intensity of Ce3+ and Mn2+ concentration. (2) The emission spectra of NaCa0.992−yBO3:0.01Ce3+,yMn2+ phosphors.89 | ||
3.4 The co-doping of Eu2+/Mn2+
Generally speaking, Eu2+ presents yellow and blue light, which causes the obtained white light to lack red component, leading to the lower CRI. To increase the CRI of the material, the emission intensity of red light must be improved. Since Mn2+ can emit red light, co-doping Eu2+ and Mn2+ was attempted. For another reason, the emission color of Eu2+ singly-doped phosphors can be varied from blue to red in different hosts, nevertheless, the emission color is commonly unchangeable or slightly changeable in certain systems. In order to obtain tuned emission colors and substantial colors, the energy properties from Eu2+ to Mn2+ are frequently exploited in phosphors.It has been proved that there is energy transfer between Eu2+ and Mn2+, where Eu2+ acts as a sensitizer transferring part of its excitation energy into neighboring Mn2+ ions. There are many Eu2+/Mn2+ co-doped phosphors, such as Sr2MgSiO5:Eu2+,Mn2+,90 Sr3La(PO4)3,91 NaScSi2O6,92 and NaCaBO3 (ref. 93) all of which have the properties of spectral adjustment, due to the energy transfer between Eu2+ and Mn2+.
Taking Ca9Mg(PO4)6F2:Eu2+,Mn2+ as an example, the excitation and emission spectra of Ca9Mg(PO4)6F2:0.18Eu2+ and Ca9Mg(PO4)6F2:0.18Mn2+ samples are shown in Fig. 15, respectively. It was observed that there is an overlap of Mn2+ excitation and Eu2+ emission in Fig. 17, which proves the possibility for resonance type energy transfer from Eu2+ to Mn2+ in the host. Except for the intensity in the Ca9Mg(PO4)6F2:0.18Eu2+,0.18Mn2+ phosphor from Fig. 17, it can be further demonstrated by the similar excitation spectra monitored at 454 and 565 nm. Due to the emission spectrum covering the emission band of Eu2+ and Mn2+, the tunable color can be gained via adjusting the Mn2+ concentration. Moreover, the lifetime of Eu2+ decreases with increasing Mn2+, which provides further confirmation of energy transfer from Eu2+ to Mn2+ ions. Fig. 17 shows the tunable emission color via changing the ratio of Eu2+ and Mn2+ doping concentration. The variation of the CIE chromaticity coordinates from blue to yellow with increasing Mn2+ doping concentration from 0 to 0.38 is shown in Fig. 17. Eu2+,Mn2+-activated CMPF phosphors can be potentially applied in UV-pumped white LEDs with outstanding properties.94
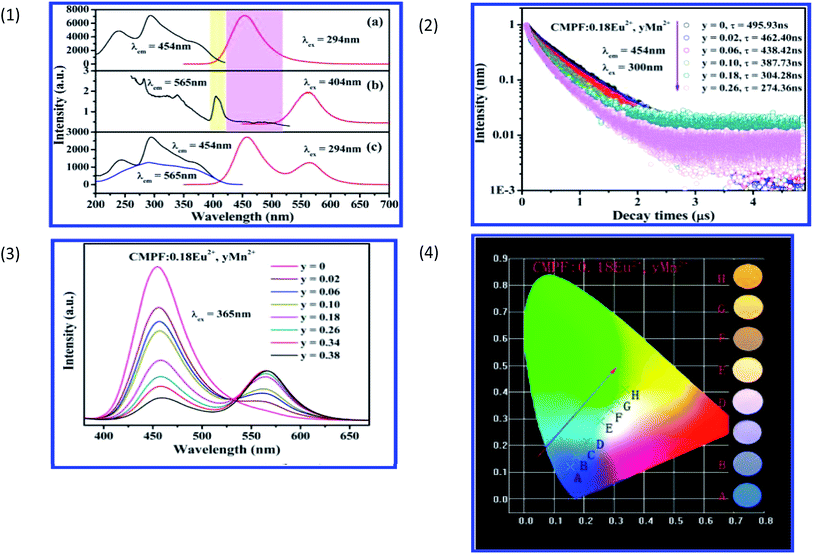 | ||
| Fig. 17 (1) Excitation and emission spectra of CMPF:0.18Eu2+ (a), CMPF:0.18Mn2+ (b), and CMPF:0.18Eu2+,0.18Mn2+ (c) phosphors. The corresponding spectral overlap is also presented in the colored area. (2) Decay curves and lifetimes of Eu2+ in representative samples of CMPF:0.18Eu2+,yMn2+ (monitored at 454 nm and excited at 300 nm). (3) Variation of emission intensity for CMPF:0.18Eu2+,yMn2+ (y = 0–0.38) phosphors on Mn2+ doping content excited at 365 nm. (4) CIE chromaticity coordinates of CMPF:0.18Eu2+,yMn2+ samples (A–H corresponds to y = 0, 0.02, 0.06, 0.10, 0.18, 0.26, 0.34, respectively). The luminescence photographs of corresponding phosphors excited under a 365 nm UV lamp are shown on the right of the picture.94 | ||
Liu et al. have synthesized single-phase white light-emitting KCaY(PO4)2:Eu2+,Mn2+ for light-emitting diode (LED) applications. The absolute quantum efficiency of photoconversion was calculated using the following equation:
 | (24) |
 | (25) |
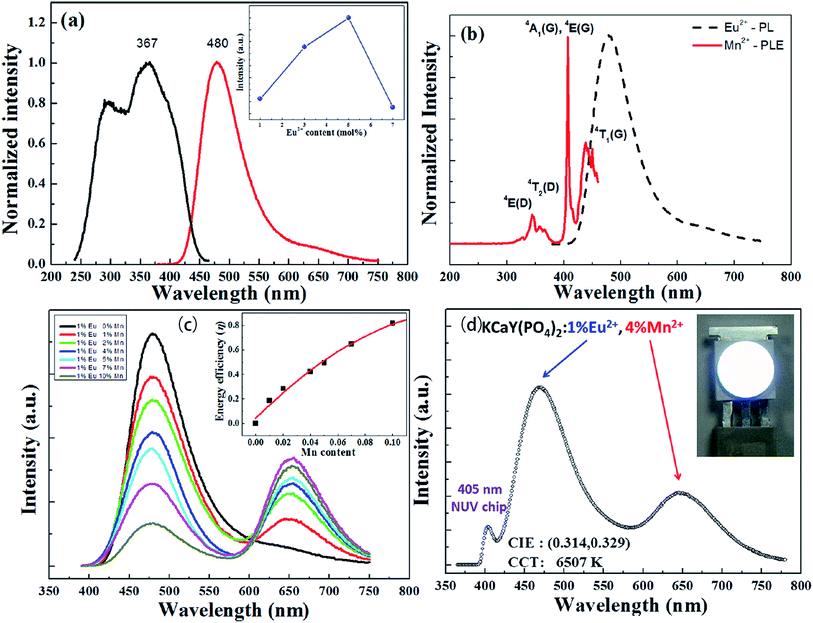 | ||
| Fig. 18 (a) Photoluminescence excitation/photoluminescence (PLE/PL) spectra of the as-synthesized KCaY(PO4)2:1%Eu2+ phosphor. The inset shows the PL intensity of KCaY(PO4)2:Eu2+ phosphors as a function of Eu2+ concentration. (b) PLE spectrum of KCaY(PO4)2:1%Mn2+ and PL spectrum of KCaY(PO4)2:1%Eu2+. (c) PL spectra of a series of KCaY(PO4)2:1%Eu2+,x%Mn2+ phosphors with different Mn2+ concentrations (x = 0, 1, 2, 4, 5, 7, and 10 mol%), excited at 365 nm. Inset shows the energy transfer efficiency from Eu2+ to Mn2+, as a function of Mn2+ content. (d) Electroluminescence spectra of white LED lamps fabricated using a NUV 405 nm chip combined with a white-emitting KCaY(PO4)2:1%Eu2+,4%Mn2+ phosphor driven by a current of 350 mA. Inset shows a photo of the LED package.95 | ||
4 Summary and outlook
Due to the characteristics of the transition metal electronic orbitals, Mn has many valence states, with Mn2+ and Mn4+ being the most common. As activated ions, they have a wide range of applications. Mn4+ doped materials can work as a complement to the commercial phosphor powder “blue chips + Y3Al5O12:Ce3+ (YAG:Ce)” to make up for the lack of red component, in order to improve the color rendering indexes and the correlated color temperature. They have the advantages of a simple preparation route and low-cost. Mn4+ activated oxide and fluoride red phosphors have attracted more and more attention, but low resistance to moisture and unclear structure-related luminescence mechanisms limit their rapid progress in scientific investigation and application of WLED lighting.Ce3+/Mn2+,Eu2+/Mn2+ co-doped materials can produce color tunable phosphors in order to achieve UV excitable single mechanism phosphors to produce white light. In recent years, a single host material emitting white light has made significant progress. In order to further improve its performance, some more studies need to be conducted. Double-doped materials have some deficiencies in the spectral distribution; for example, Eu2+/Mn2+ or Ce3+/Mn2+ doped systems in the green emission region are relatively weak, which is certain to affect the luminescence. Further research is being conducted on how to improve the spectral distribution of dual-doping systems, and how to meet the needs of different white phosphors.
In addition, due to the splitting of the Mn2+ energy level, the emission spectrum can be red shifted to produce deep red and near infrared light. It has been widely used in the fields of optical fiber communication, solid state lasers, light emitting markers and fluorescence immunoassays.
Acknowledgements
This study is supported by the National Natural Science Foundation of China (No. 51672066, 50902042), the Funds for Distinguished Young Scientists of Hebei Province, China (No. A2015201129) and the personnel training project of Hebei Province, China (No. A2016002013).References
- H. M. Zhang, H. R. Zhang, Y. L. Liu, J. K. Deng, B. F. Lei, L. h. Liu, H. Y. Luo and X. Bai, J. Alloys Compd., 2016, 688, 1225–1232 CrossRef CAS.
- K. C. Mondal and J. Manam, J. Mol. Struct., 2016, 1125, 503–513 CrossRef CAS.
- S. X. Li, L. Wang, Q. Q. Zhu, D. M. Tang, X. J. Liu, G. F. Cheng, L. Lu, T. Takeda, N. Hirosaki, Z. R. Huanga and R. J. Xie, J. Mater. Chem. C, 2016, 4, 11219–11230 RSC.
- B. Yuan, Y. H. Song, Y. Sheng, K. Y. Zheng, X. Q. Zhou, P. C. Ma, X. C. Xu and H. F. Zou, J. Solid State Chem., 2016, 47(2), 169–177 Search PubMed.
- D. C. Huang, Y. F. Zhou, W. T. Xu, K. Wang, Z. G. Liu and M. C. Hong, J. Alloys Compd., 2015, 653, 148–155 CrossRef CAS.
- D. Q. Chen, W. D. Xiang, X. J. Liang, J. S. Zhong, H. Yu, M. Y. Ding, H. W. Lu and Z. G. Ji, J. Eur. Ceram. Soc., 2015, 35, 859–869 CrossRef CAS.
- W. G. Xiao, X. Zhang, Z. D. Hao, G. H. Pan, Y. S. Luo, L. G. Zhang and J. H. Zhang, Inorg. Chem., 2015, 54(7), 3189–31195 CrossRef CAS PubMed.
- L. L. Wei, C. C. Lin, M. H. Fang, M. G. Brik, S. F. Hu, H. Jiao and R. S. Liu, J. Mater. Chem. C, 2015, 3, 1655–1660 RSC.
- L. Chen, R. H. Liu, W. D. Zhuang, Y. H. Liu, Y. S. Hu, X. F. Zhou and X. L. Ma, J. Alloys Compd., 2015, 627(13), 218–221 CrossRef CAS.
- G. Blasse and B. C. Grabmaier, Luminescent Materials, Springer, Verlag, Berlin, Heidelberg, 1994, p. 113 Search PubMed.
- S. H. Kwon, B. K. Moon, B. C. Choi, J. H. Jeong and J. H. Kim, J. Korean Phys. Soc., 2016, 68(2), 363–367 CrossRef CAS.
- Z. Y. Mao, J. J. Chen, J. Li and D. J. Wang, Chem. Eng. J., 2016, 284, 1003–1007 CrossRef CAS.
- J. Chen, Y. G. Liu, L. F. Mei, Z. Y. Wang, M. H. Fang and Z. H. Huang, J. Mater. Chem. C, 2015, 3(21), 5516–5523 RSC.
- D. C. Huang, Y. F. Zhou, W. T. Xu, K. Wang, Z. G. Liu and M. C. Hong, J. Alloys Compd., 2015, 625, 148–155 CrossRef.
- K. X. Song, J. X. Zhang, Y. F. Liu, C. H. Zhang, J. Jiang, H. C. Jiang and H. B. Qin, J. Phys. Chem. C, 2015, 119(43), 24558–24563 CAS.
- W. Xu, G. Zhu, X. Zhou and Y. Wang, Dalton Trans., 2015, 44(19), 9241–9250 RSC.
- H. N. Luitel, R. Chand, T. Watari, T. Torikai and M. Yada, RSC Adv., 2015, 5(22), 17034–17040 RSC.
- M. Y. Peng, X. W. Yin, P. A. Tanner, C. Q. Liang, P. F. Li, Q. Y. Zhang and J. R. Qiu, J. Am. Ceram. Soc., 2013, 96(9), 2870–2876 CrossRef CAS.
- S. Sugano, Y. Tanabe and H. Kamimura, Multiplets of Transition Metal Ions in Crystals, New brk: Academic Press, 1970 Search PubMed.
- R. P. Cao, K. N. Sharafudeen and J. R. Qiu, Spectrochim. Acta, Part A, 2014, 117, 402–405 CrossRef CAS PubMed.
- M. G. Brik and A. M. Srivastava, J. Lumin., 2013, 133, 69–72 CrossRef CAS.
- H. M. Zhu, C. C. Lin, W. Q. Luo, S. T. Shu, Z. G. Liu, Y. S. Liu, J. T. Kong, E. Ma, Y. G. Cao, R.-S. Liu and X. Y. Chen, Nat. Commun., 2014, 5, 1–10 Search PubMed.
- D. Q. Chen, Y. Zhou, W. Xu, J. S. Zhong, Z. G. Ji and W. D. Xiang, J. Mater. Chem. C, 2016, 4, 1704–1712 RSC.
- M. G. Brik, S. J. Camardello and A. M. Srivastava, ECS J. Solid State Sci. Technol., 2015, 4, R39–R43 CrossRef CAS.
- T. Takahashi and S. Adachi, J. Electrochem. Soc., 2008, 155, 183–188 CrossRef.
- A. M. Srivastava, Opt. Mater., 2009, 31, 881–885 CrossRef CAS.
- M. G. Brik, A. M. Srivastava and N. M. Avram, J. Lumin., 2011, 131, 54–58 CrossRef CAS.
- M. Y. Peng, X. W. Yin, P. A. Tanner, M. G. Brik and P. F. Li, J. Am. Chem. Soc., 2015, 27, 2938–2945 CAS.
- P. F. Li, L. Wondraczek, M. Y. Peng and Q. Y. Zhang, J. Am. Ceram. Soc., 2016, 99(10), 3376–3381 CrossRef CAS.
- W. Li, H. R. Zhang, S. Chen, Y. L Liu, J. L Zhuang and B. F. Lei, Adv. Opt. Mater., 2016, 4(3), 427–434 CrossRef CAS.
- X. Ding, G. Zhu, W. Y. Geng, Q. Wang and Y. H. Wang, Inorg. Chem., 2016, 55(1), 154–162 CrossRef CAS PubMed.
- K. Li, D. Zhu and R. V. Deun, Dyes Pigm., 2017, 142, 69–76 CrossRef CAS.
- Y. X. Pan and G. K. Liu, J. Lumin., 2011, 131(3), 465–468 CrossRef CAS.
- M. G. Brik, Y. X. Pan and G. K. Liu, J. Alloys Compd., 2011, 509(5), 1452–1456 CrossRef CAS.
- X. L. Gao, Y. Song, G. X. Liu, X. T. Dong, J. X. Wang and W. S. Yu, Dalton Trans., 2016, 45(44), 17886–17895 RSC.
- T. C. Lang, T. Han, L. L. Peng and M. J. Tu, Mater. Chem. Front., 2017, 1, 928–932 RSC.
- T. T. Deng, E. H. Song, J. Su, L. Y. Wang, Y. Deng, S. Ye, J. Wang and Q. Zhang, J. Mater. Chem. C, 2017, 5, 2910–2918 RSC.
- R. Cao, M. Peng, E. Song and J. Qiu, ECS J. Solid State Sci. Technol., 2012, 1(4), R123–R126 CrossRef CAS.
- Z. liu, M. Yuwen, J. Liu, C. Yu, T. Xuan and H. Li, Ceram. Int., 2017, 43(7), 5674–5679 CrossRef CAS.
- R. P. Cao, D. Ceng, X. G. Yu, S. L. Guo, Y. F. Wen and G. T. Zheng, Funct. Mater. Lett., 2015, 8(5), 1550046 CrossRef CAS.
- P. F. Li, L. Wondraczek, M. Y. Peng and Q. Y. Zhang, J. Am. Ceram. Soc., 2016, 99(10), 3376–3381 CrossRef CAS.
- E. Song, J. Wang, J. Shi, T. Deng, S. Ye, M. Peng, J. Wang, L. Wondraczek and Q. Zhang, ACS Appl. Mater. Interfaces, 2017, 9(10), 8805–8812 CAS.
- A. Abdukayum, J. T. Chen, Q. Zhao and X. P. Yan, J. Am. Chem. Soc., 2013, 135(38), 14125–14133 CrossRef CAS PubMed.
- Q. H. Zhang, J. Wang, G. G. Zhang and Q. Su, J. Mater. Chem., 2009, 19, 7088–7092 RSC.
- Y. X. Zhuang, Y. Katayama, J. Ueda and S. Tanabe, Opt. Mater., 2014, 36, 1907–1912 CrossRef CAS.
- J. Yan, M. G. Brik, C. M. Liu, D. J. Hou, W. J. Zhou, B. B. Zhang, Y. Huang, Y. Tao and H. B. Liang, Opt. Mater., 2015, 43, 59–65 CrossRef CAS.
- C. J. Duan, A. C. A. Delsing and H. T. Hintzen, Chem. Mater., 2009, 21, 1010–1016 CrossRef CAS.
- S. K. Singh, RSC Adv., 2014, 4(102), 58674–58698 RSC.
- X. R. Zhong, X. P. Meng, M. Y. Li, X. Q. Wang, X. J. Wen and X. Y. Zhang, Chem. Phys. Lett., 2012, 536, 55–60 CrossRef.
- C. M. Abreu, R. S. Silva, M. E. G. Valerio and Z. S. Macedo, J. Solid State Chem., 2013, 200, 54–59 CrossRef CAS.
- Y. Katayama, J. Ueda and S. Tanabe, Opt. Mater. Express, 2014, 4, 613–623 CrossRef CAS.
- J. G. Cheng, P. L. Li, Y. S. Sun, Q. Y. Bai, Z. L. Li, M. M. Tian, C. Wang and Z. P. Yang, J. Mater. Chem. C, 2017, 5, 127–133 RSC.
- A. Bessiére, A. Lecointre, R. A. Benhamou, E. Suard, G. Wallez and B. Viana, J. Mater. Chem. C, 2013, 1(6), 1252–1259 RSC.
- A. Bessière, R. A. Benhamou, G. Wallez, A. Lecointre and B. Viana, Acta Mater., 2012, 60, 6641–6649 CrossRef.
- Y. Y. Ma, J. Q. Hu, E. H. Song, S. Ye and Q. Zhang, J. Mater. Chem. C, 2015, 3, 12443–12449 RSC.
- L. Wu, B. Wang, Y. Zhang, L. Li, H. R. Wang, H. Yi, Y. F. Kong and J. J. Xu, Dalton Trans., 2014, 43, 13845–13851 RSC.
- B. S. Choia, O. G. Jeonga, J. C. Parka, J. W. Kimb, S. J. Leeb, J. H. Ryuc, J. Leec and H. Chob, J. Ceram. Process. Res., 2016, 17(7), 778–781 Search PubMed.
- L. Hu, Q. Wang, X. Wang, Y. Li, Y. Wang and X. Peng, RSC Adv., 2015, 5, 104708–104714 RSC.
- X. Ding, G. Zhu, Q. Wang and Y. Wang, RSC Adv., 2015, 5, 30001–33004 RSC.
- Y. Pan, L. Li, J. Lu, R. Pang, L. Wan and S. Huang, Dalton Trans., 2016, 45, 9506–9512 RSC.
- X. Zhu, Y. Yao and Z. Zhou, Opt. Mater., 2016, 62, 104–109 CrossRef CAS.
- R. Cao, D. Peng, H. Xu, S. Jiang, Z. Luo, H. Ao and P. Liu, J. Lumin., 2016, 178, 388–391 CrossRef CAS.
- K. W. Park, H. S. Lim, S. W. Park, G. Deressa and J. S. Kim, Chem. Phys. Lett., 2015, 636, 141–145 CrossRef CAS.
- B. Chandra Babu, B. Vengla Rao, M. Ravi and S. Babu, J. Mol. Struct., 2017, 1127, 6–14 CrossRef CAS.
- K. Omri and L. El Mir, J. Mater. Sci.: Mater. Electron., 2016, 27(9), 9476–9482 CrossRef CAS.
- E. H. Song, S. Ding, M. Wu, S. Ye, F. Xiao, S. F. Zhou and Q. Y. Zhang, Adv. Opt. Mater., 2014, 2, 670–678 CrossRef CAS.
- C. R. Ronda and T. Amrein, J. Lumin., 1996, 69, 245–248 CrossRef CAS.
- M. S. Kwon, J. H. Jordahl, A. W. Phillips, K. Chung, S. Lee, J. Gierschner, J. Lahann and J. Kim, Chem. Sci., 2016, 7(3), 2359–2363 RSC.
- M. Y. Peng, X. W. Yin, P. A. Tanner, C. Q. Liang, P. F. Li, Q. Y. Zhang and J. R. Qiu, J. Am. Ceram. Soc., 2013, 96(9), 2870–2876 CrossRef CAS.
- J. Lü, F. Du, R. Zhu, Y. Huang and H. J. Seo, J. Mater. Chem., 2011, 21, 16398–16405 RSC.
- M. Szumera, I. Wacławska and J. Sułowska, J. Therm. Anal. Calorim., 2016, 123(2), 1083–1089 CrossRef CAS.
- C. Wang, P. L. Li, Z. J. Wang, Y. S. Sun, J. G. Cheng, Z. L. Li, M. M. Tian and Z. P. Yang, Phys. Chem. Chem. Phys., 2016, 18, 28661–28673 RSC.
- Z. Zhang and W. Tang, J. Alloys Compd., 2015, 663, 731–737 CrossRef.
- J. Zhou, T. Wang, X. Yu, D. Zhou and J. Qiu, Mater. Res. Bull., 2016, 73, 1–5 CrossRef CAS.
- B. P. Kore, S. Tamboli, N. S. Dhoble, A. K. Sinha, M. N. Singh, S. J. Dhoble and H. C. Swart, Mater. Chem. Phys., 2016, 187, 233–244 CrossRef.
- C. Liang, H. P. You, Y. B. Fu, X. M. Teng, K. Liu and J. H. He, Optik, 2017, 131, 335–342 CrossRef CAS.
- Y. Hong, J. L. Chen, Y. Pu, T. J. Zhang and S. C. Gan, J. Rare Earths, 2015, 33(4), 366–370 CrossRef.
- Y. Zhu, Y. Liang, S. Liu, K. Li, X. Wu and R. Xu, J. Rare Earths, 2017, 35(1), 41–46 CrossRef CAS.
- U. Manik, S. C. Gedamb and S. J. Dhoble, Luminescence, 2014, 30(6), 910–913 CrossRef PubMed.
- R. L. Zheng, D. W. Luo, Y. Yuan, Z. Y. Wang, Y. Zhang, W. Wei, L. B. Kong and D. Y. Tang, J. Am. Ceram. Soc., 2015, 98(10), 3231–3235 CrossRef CAS.
- J. Zhang, F. Zhang and L. L. Han, J. Rare Earths, 2015, 33(8), 820–824 CrossRef CAS.
- L. R. Hatwar, S. P. Wankhede, S. V. Moharil, P. L. Muthald and S. M. Dhopte, Luminescence, 2015, 30(6), 904–909 CrossRef CAS PubMed.
- Y. Q. Li, H. P. Ma, Y. J. Hua, Q. H. Yang, C. X. Li, D. G. Deng and S. Q. Xu, J. Rare Earths, 2016, 34(1), 7–11 CrossRef CAS.
- P. L. Li, Z. J. Wang, Q. L. Guo and Z. P. Yang, J. Am. Ceram. Soc., 2014, 98(2), 495–500 CrossRef.
- F. Zhang and W. J. Tang, Luminescence, 2014, 30(2), 216–220 CrossRef PubMed.
- G. G. Li, D. L. Geng, M. M. Shang, C. Peng, Z. Y. Cheng and J. Lin, J. Mater. Chem., 2011, 21, 13334–13344 RSC.
- Y. Kim, K. Page, A. Limarga, D. Clarke and R. Seshadri, Phys. Rev. B: Condens. Matter Mater. Phys., 2007, 76, 115204 CrossRef.
- J. F. Sun, W. L. Zhang, Y. M. Shi, D. Z. Shen and J. Y. Sun, J. Electrochem. Soc., 2012, 159, J5–J12 CrossRef CAS.
- J. F. Sun, Z. P. Lian, G. Q. Shen and D. Z. Shen, RSC Adv., 2013, 3, 18395–18405 RSC.
- Z. Chen, J. Zhang, S. Chen, M. Lin, C. He, G. Xu, M. Wang, X. Yu, J. Zou and K. Guo, J. Alloys Compd., 2015, 632, 756–759 CrossRef CAS.
- Z. J. Wang, S. Q. Lou, P. L. Li and Z. G. Lian, Opt. Mater. Express, 2017, 56(4), 1167–1172 Search PubMed.
- J. Barzowska, Z. G. Xia, D. Jankowski, D. Włodarczyk, K. Szczodrowski, C. G. Ma, M. G. Brik, Y. Zhydachevskii and A. Suchocki, RSC Adv., 2017, 7, 275–284 RSC.
- Y. M. Wang, H. B. Zhang, Q. L. Wei, C. H. Sua and D. Zhang, Ceram. Int., 2016, 42(10), 12422–12426 CrossRef CAS.
- K. Li, D. L. Geng, M. M. Shang, Y. Zhang, H. Z. Lian and J. Lin, J. Phys. Chem. C, 2014, 118, 11026–11034 CAS.
- W. R. Liu, C. H. Huang, C. W. Yeh, J. C. Tsai, Y. C. Chiu, Y. T. Yeh and R. S. Liu, Inorg. Chem., 2012, 51, 9636–9641 CrossRef CAS PubMed.
| This journal is © The Royal Society of Chemistry 2017 |
