 Open Access Article
Creative Commons Attribution 3.0 Unported Licence
Real-time monitoring of granule properties during high shear wet granulation by near-infrared spectroscopy with a chemometrics approach
F. Shikataab,
S. Kimuraa,
Y. Hattorib and
M. Otsuka *b
*b
aFormulation Research, PST CFU, Medicine Development Centre, Eisai Co., Ltd., 1 Kawashima Takehaya-machi, Kakamigahara-shi, Gifu 501-6195, Japan
bResearch Institute of Pharmaceutical Sciences, Faculty of Pharmacy, Musashino University, 1-1-20 Shin-machi Nishitokyo-shi, Tokyo 202-8585, Japan. E-mail: motsuka@musashino-u.ac.jp; Fax: +81-42-468-8658; Tel: +81-42-468-8658
First published on 3rd August 2017
Abstract
We developed an in-line near-infrared spectroscopy (NIRS) monitoring method enabling a rapid and non-invasive analysis of granule properties during the high shear wet granulation (HSWG) process. Eleven batches were manufactured and used as the calibration dataset and an additional batch was manufactured and used as the validation dataset. The HSWG process was directly monitored using an acousto-optical tunable filter (AOTF)-NIR spectrometer and the NIR spectra related to the physical and chemical changes of the granules were acquired. The particle size, tapped density, bulk density, and powder flowability of the granules were qualitatively and quantitatively evaluated by a chemometrics approach. Principal component analysis (PCA) and partial least square regression (PLSR) were applied for the qualitative and quantitative modelling of the granule properties. The PCA score plots showed a clear relationship between the granule properties and the granulation progress and provided an effective means for the endpoint determination of the manufacturing process. The PLSR models constructed for the quantitative evaluation of the granule properties were demonstrated to be predictive with high accuracy. These findings allow HSWG to be monitored in-line and controlled effectively. A better understanding of the process by NIRS with chemometrics will contribute to developing high-quality drug products using the required quality-by-design approach.
Introduction
Since the issuance of the process analytical technology (PAT) guidance by the Food and Drug Administration (FDA) in 2004, continuous efforts have been made to improve process understanding and characterization in manufacturing.1 According to this guidance, PAT is defined as “a system for designing, analyzing, and controlling manufacturing through timely measurements of critical quality and performance attributes of raw and in-process materials and processes, with the goal of ensuring final product quality”. Moreover, regulatory agencies currently encourage the adoption of the quality-by-design (QbD) approach, which is a science-based approach for assuring the quality of drug products.2 Hence, the production of quality products on the basis of the process understanding obtained from the PAT approach has been a significant challenge for the pharmaceutical industry.The pharmaceutical manufacturing process consists of several individual operations involving pre-blending, granulation, milling, blending, tableting, and coating. The granulation process is considered to be one of the most critical unit operations in the pharmaceutical manufacturing process. The high shear wet granulation (HSWG) process is a size enlargement process used to improve the powder properties of the formulation (such as the bulk density and powder flowability) for the subsequent processes and to impart desirable properties to it.3 Although it is a complex process with many variations, HSWG has been widely adopted in the pharmaceutical industry for many decades.
Granule properties, known as intermediate product qualities, are related to the end-product qualities such as the hardness, disintegration, and dissolution.3 Therefore, the estimation of these properties during the granulation process should be an efficient approach for developing safe and effective drug products. An intense research effort has been made and several techniques have been developed to enable a timely measurement of the physical properties of formulations during the HSWG process. A common method used for monitoring the HSWG process is to monitor a change in the power consumption or torque against the impeller during the manufacturing.4,5 However, the practical use of this method is hindered by the influence of the amount, viscosity, and feeding speed of the added binder solution on both the power consumption and torque signals.6 A focused beam reflectance measurement (FBRM) probe can be used to obtain a detailed understanding of the particle size changes during the HSWG process and to determine the end-point properties of formulations.7,8 Acoustic emission is another well-known approach for monitoring the HSWG process. It has been reported to be capable of monitoring changes in the physical properties of formulations during granulation.9,10 Recently, Narang et al. demonstrated the use of a drag flow force sensor to be a promising method for in-line monitoring as compared to the wet mass consistency measurement carried out using a FT4 powder rheometer® approach.11,12 While there are many methods for in-line monitoring of the HSWG process, all of them have limitations such as the ability to measure only the physical property changes occurring during the HSWG process.
Near-infrared spectroscopy (NIRS) on the other hand can be used for the rapid and non-invasive measurement of the physical and chemical properties of materials during the wet granulation process, and is therefore, one of the most useful spectroscopy techniques for implementing PAT in the pharmaceutical industry.13 In-line NIRS monitoring of fluidized bed granulation has been widely investigated to obtain a detailed process understanding including the estimation of the granulation end-point and the prediction of the physicochemical properties such as the particle size and moisture content, demonstrating the usefulness of NIRS as a PAT tool.14–17 Otsuka et al. reported that the polymorphic transformation of theophylline anhydrate to monohydrate during the HSWG process can be predicted by off-line NIRS measurements along with the chemometrics approach.18 Moreover, many researchers have studied the physicochemical properties of granules during the HSWG process using off-line NIRS measurements.19–21 Despite the considerable attention paid to the development of NIRS-based monitoring methods, there are only a few reports on the in-line NIRS monitoring of the physical properties of granules during the HSWG process. Luukkonen et al. predicted the physical properties of granules and tablets using the in-line NIRS monitoring approach.22 Mandato et al. demonstrated the usefulness of in-line NIRS monitoring for the HSWG process of durum wheat semolina to discriminate the granulation conditions.23 However, they did not mention anything regarding the prevention of probe fouling and maintaining sample homogeneity. Probe fouling and sample inhomogeneity are the major obstacles encountered during the in-line NIRS monitoring of the HSWG process.24 Therefore, the development of an effective and robust in-line NIRS monitoring method for the HSWG process is still challenging.
In the present study, in order to develop a robust in-line NIRS monitoring method, various pharmaceutical properties (particle size, bulk density, tapped density, and powder flowability) of a formulation were monitored in-line using an acousto-optical tunable filter (AOTF)-NIR spectrometer during the HSWG process at a 4.5 kg scale. Compressed air was employed to overcome the difficulties encountered during the in-line NIRS monitoring of the HSWG process. Principle component analysis (PCA) and partial least square regression (PLSR) were used to evaluate the NIR spectra acquired during the HSWG process for the qualitative and quantitative analyses of the formulation.
Experimental
Materials
The granules manufactured in this study were composed of donepezil hydrochloride as an active ingredient (in-house), lactose monohydrate (Pharmatose® 200M, DFE Pharma, Tokyo, Japan), microcrystalline cellulose (Ceolus PH-101, Asahi Kasei, Tokyo, Japan), low-substituted hydroxypropyl cellulose (LH-21, Shin-Etsu Chemical Co., Ltd., Tokyo, Japan), and hydroxypropyl cellulose (HPC-L, Nippon Soda Co., Ltd., Tokyo, Japan). Purified water (in-house) was used as the granulation fluid. Magnesium stearate (Mallinckrodt Pharmaceuticals, St. Louis, USA) was used as the lubricant for the compression of the milled granules. The physical properties of the active ingredient used in this study are given in Table 1.| a Particle size was determined by laser diffraction method. Results are expressed as the average of 5 measurements ± SD.b Results are expressed as the average of 2 measurements. | ||
|---|---|---|
| Particle sizea (μm) | D10 | 2.1 ± 0.03 |
| D50 | 5.3 ± 0.1 | |
| D90 | 28.3 ± 2.8 | |
| Bulk densityb (g mL−1) | 0.216 | |
| Tapped densityb (g mL−1) | 0.380 | |
High shear wet granulation
HSWG was conducted in a high shear wet granulator (VG-25, Powrex Co., Ltd., Hyogo, Japan) at a scale of 4.5 kg. The components, composition, and batch quantity of the model formulation are listed in Table 2. A four factors-three levels fractional factorial design was employed to achieve the granulation conditions listed in Table 3. An impeller and a cross-screw speed, a granulation fluid (purified water) amount, and wet massing time were changed in three levels, respectively and these batches were assigned to Form 1 through Form 11.| % | g per batch | |
|---|---|---|
| Donepezil hydrochloride | 2.5 | 112.5 |
| Lactose monohydrate | 81.0 | 3645.0 |
| Low-substituted hydroxypropyl cellulose | 2.0 | 90.0 |
| Microcrystalline cellulose | 10.0 | 450.0 |
| Hydroxypropyl cellulose | 4.0 | 180.0 |
| Magnesium stearate | 0.5 | 22.5 |
| Purified water | — | 600–900 |
| Total | 100.0 | 4500.0 |
| Batch | Impeller (rpm) | Cross screw (rpm) | Water amount (g) | Water addition time (min) | Wet massing time (min) |
|---|---|---|---|---|---|
| Form 1 | 190 | 2100 | 900 | 6.0 | 1.0 |
| Form 2 | 190 | 1500 | 600 | 6.0 | 1.0 |
| Form 3 | 190 | 2100 | 600 | 6.0 | 3.0 |
| Form 4 | 250 | 2100 | 900 | 6.0 | 3.0 |
| Form 5 | 190 | 1500 | 900 | 6.0 | 3.0 |
| Form 6 | 220 | 1800 | 750 | 6.0 | 2.0 |
| Form 7 | 250 | 1500 | 600 | 6.0 | 3.0 |
| Form 8 | 220 | 1800 | 750 | 6.0 | 2.0 |
| Form 9 | 220 | 1800 | 750 | 6.0 | 2.0 |
| Form 10 | 250 | 2100 | 600 | 6.0 | 1.0 |
| Form 11 | 250 | 1500 | 900 | 6.0 | 1.0 |
| Validation | 250 | 1800 | 750 | 6.0 | 3.0 |
All materials except magnesium stearate were added into the granulator and mixed for 5 min at the impeller speed of 220 rpm and the cross-screw speed of 1800 rpm. After the mixing process, the granulation fluid was added at the rates of 200 (600 g), 250 (750 g), and 300 g min−1 (900 g) for 30 s using both the impeller and cross-screw (Table 3). The wet granules were continuously agitated to maintain a homogeneous water distribution for 30 s under the same granulation conditions. This process was repeated six times until the entire granulation fluid was added. In addition, after the granulation fluid addition phase, wet massing was carried out while maintaining the same impeller and cross-screw speeds as for the granulation fluid addition phase for a duration of 1–3 min for further granulation. During the granulation fluid addition and wet massing phase, approximately 150 g of the wet granules were collected at 1 min intervals (B-1, G-1, G-2, G-3, G-4, G-5, G-6, WM-1, WM-2, and WM-3). All the wet granule samples were dried in a tray dryer (SPH-201, Ozawa Science Co., Ltd., Aichi, Japan) for more than 20 h at 60 °C. The milled granules were then obtained by milling the dried granules using a speed mill (P-04S, Showa Kagaku Kikai Co., Ltd., Osaka, Japan) with a screen having a diameter of 1.0 mm at 3000 rpm. The wet granules sampled separately after adding the entire granulation fluid were dried and milled (under the same conditions as mentioned above) and were then blended with magnesium stearate in a diffusion mixer (TM-1, Toyo Packing Co., Ltd., Gifu, Japan) at the rotation speed of 31 rpm for 17.2 min. The blended granules were compressed into 200 mg round-biconvex tablets with a diameter of 8.0 mm at a compression force of 7.8 kN using a single tablet press (Tabflex, Okada Seiko Co., Ltd., Tokyo, Japan).
Bulk and tapped density of the granules
To determine the bulk density of the granules, the granules were flown into a 30 mL cylinder and were weighed. The bulk density (Vb) was calculated according to| Bulk density (Vb, g mL−1) = Wb/Vcb |
The granules were flown into a 25 mL cylinder which was tapped 500 times in order to evaluate the tapped density of the granules (tapping density measuring instrument KYT-4000, Seishin Enterprise Co., Ltd., Tokyo, Japan). The weight and volume of the granules after tapping were recorded and the tapped density (Vt) was determined according to
| Tapped density (Vt, g mL−1) = Wt/Vg |
| Compressibility index (%) = (Vt − Vb)/Vt × 100 |
| Hausner ratio = Vt/Vb |
Particle size measurement
The particle size of the granules was evaluated using sieve analysis (electromagnetic vibration sieve unit M-100, Tsutsui Scientific Instruments Co., Ltd., Tokyo, Japan). Approximately 10 g of the milled granule samples were sieved at an attitude of 8 for 10 min using sieve sizes of 1.0, 0.5, 0.25, 0.18, 0.15, 0.106, and 0.075 mm. The remaining granules for each fraction were weighted and their particle size was calculated as 50 and 90% of the cumulative curves.In-line NIRS monitoring during the HSWG process
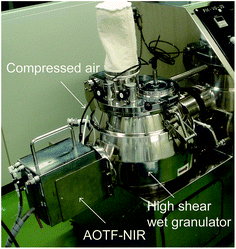
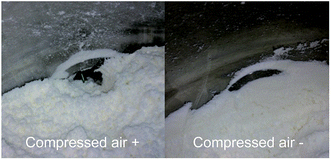
An AOTF-NIR spectrometer (Luminar 4030 NIRS, Brimrose, Sparks, MD, USA) was attached to a discharge port of the granulator in order to acquire the NIR spectra of the samples during the HSWG process (Fig. 1). The NIR spectra were continuously obtained during the HSWG process at a rate of 130 scans per 5 s in the 1100–2150 nm range with a resolution of 2 nm. An average of 32 scans generated one spectrum, which took approximately 1.25 s for each acquisition. In order to collect corresponding spectra to the sample for calibration, just before each sampling point of time, three averaged spectra were used to prepare PLSR models of granule properties. During the acquisition of the NIR spectra, compressed air was used intermittently to prevent probe fouling and to maintain the sample homogeneity.Multivariate data analysis
PCA and PLSR were used for the qualitative and quantitative modelling of the granule properties using the Unscrambler X software package (version 10.2, CAMO software AS, Oslo, Norway).Since the NIR spectra were acquired continuously during the HSWG process, several combinations of pre-treatment methods for the spectra such as the standard normal variance (SNV), Savitzky–Golay first-order derivative with SNV, and second-order derivative with SNV methods were evaluated to neglect the effects of the physical properties of the granules such as their particle size on the NIR spectra.25,26 No significant differences were observed in the model performance obtained with the different pre-treatment methods used. Therefore, all the NIR spectra described here were transformed with SNV prior to the multivariate data analysis. An internal validation using the leave-one-out cross-validation was applied to create the PLS calibration models using the three spectra (total 222 spectra for particle size (D50) and 297 spectra for other properties) at each sampling point of 11 test batches. Additionally, an external validation was conducted to predict the unknown granule properties and to reveal the robustness of the constructed PLS calibration models. The individual models were evaluated using the root mean square error of cross-validation (RMSECV), root mean square error of prediction (RMSEP), and the coefficient of determination (R2). RMSECV and RMSEP are defined as
 and yi correspond to the reference and predicted values for the sample (n), respectively.
Results and discussion
Change in granule properties during the HSWG process
The granule properties of 11 test batches including the particle size, density (bulk and tapped), and powder flowability characteristics such as the compressibility index and Hausner ratio were evaluated during the HSWG process. The results as a function of the granulation time are shown in Fig. 2. All the samples showed an increase in the particle size and bulk density with the progress of the HSWG (Fig. 2a–c). Remarkable particle size changes were observed for Form 1, Form 4, Form 5, and Form 11 manufactured using the highest water amounts. A sufficiently strong interparticle binding interaction (for granule growth) could not be generated during the early stage of granulation because of the small amount of added water. As a result, more than 50% of the granules had particle sizes lesser than the sieve size of 0.075 mm. Laser diffraction experiments showed a large variation in the particle size (data not shown). Thus, the particle size (D50) of some samples could not be obtained and these data are not included for the following multivariate data analysis of the particle size (D50). In contrast, the tapped density, compressibility index, and Hausner ratio (expressed as the indices of powder flowability) decreased with the progression of the HSWG process, as shown in Fig. 2d–f.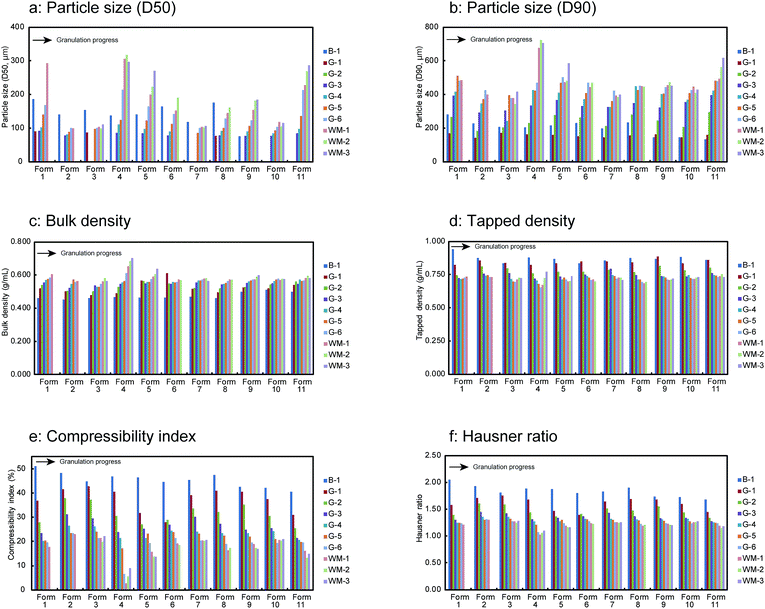 | ||
| Fig. 2 Changes in granule properties of 11 test batches in the HSWG process B-1: end of mixing process, G-1 to G-6: water addition phase, WM-1 to WM-3: wet massing phase. | ||
The regression coefficient of PLSR was used to determine which variables/process parameters affected the tablet properties. From the results shown in Fig. 3, it is clear that the particle size (D90) of the granules (affected the most by the amount of water) was the most important variable affecting the tablet qualities such as the hardness, disintegration, and dissolution rate (at 15 min). As shown in Fig. 4, these properties varied with a change in the particle size (D90). The disintegration time and dissolution rate of the tablets decreased with an increase in the particle size (D90). This is attributed to the hardness of the tablets. The reason behind the high hardness of the tablets was the enhanced contact surface area of the granules resulting from the plasticising effect of the granules at high water amounts. The enhanced plasticising effect of the granules reduced the particle residence to tableting and increased the particle deformation so that the contact surface area and tablet hardness also increased.27
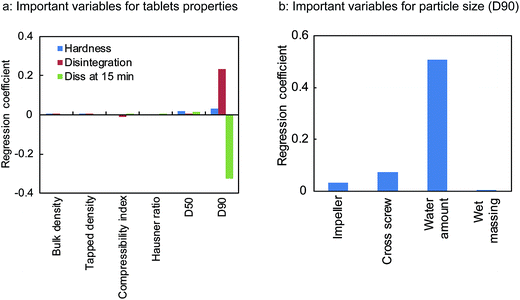 | ||
| Fig. 3 Important granules properties and process parameters affecting tablets qualities (a) and particle size (D90) of the milled granules (b). | ||
 | ||
| Fig. 4 Relashonships of particle size (D90) to tablet hardness (a), disintegration (b), and dissolution rate at 15 min (c). | ||
Change in NIR spectra during the HSWG process
The NIR spectra of Form 3, which were obtained by averaging the final three spectra acquired during the HSWG process at each sampling point, are shown in Fig. 5. The NIR spectra for the other batches were similar to these spectra. Remarkable changes in the NIR absorption peaks were observed for the water bands at around 1450 and 1940 nm, corresponding to the first overtone of the O–H bond stretching and to the combination between the fundamental stretching and deformation vibrations of the O–H bonds in the mid-infrared region, respectively.28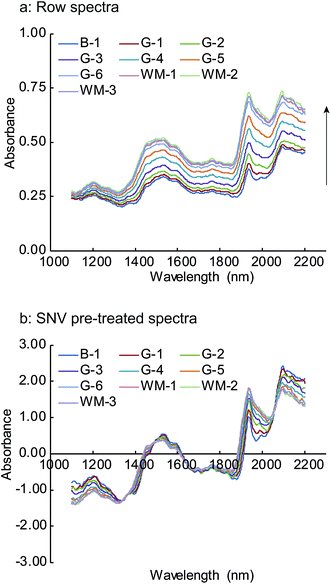 | ||
| Fig. 5 Changes in NIR row (a) and SNV pre-treated spectra (b) of Form 3 in the HSWG process B-1: end of mixing process, G-1 to G-6: water addition phase, WM-1 to WM-3: wet massing phase. | ||
The upward shift in the spectra baseline demonstrates that the particle size increased with the progress of the HSWG process. This baseline change accounts for the light scattering of the NIR spectra, as elucidated by the Kubelka–Munk scattering theory.29,30 When the NIR radiation penetrates deeper into the granules with the increasing particle size, back reflected light decreases and an apparent increase is observed in the absorbance. Thus, the baseline changes occur with the progress of the HSWG process because of the increased path length. The obtained results show that the NIR spectra acquired during the HSWG process in real time captured the changes in the granule properties during the HSWG process.
Qualitative data analysis by PCA
The analysis of the qualitative information in the NIR spectra was useful for the subsequent PLS calibration model construction as well as for understanding the process.31 Therefore, prior to the development of the PLS calibration model for the quantitative prediction of unknown granule properties, the PCA qualitative analytical method was applied to the NIR spectra pre-treated with SNV to elucidate the qualitative relationship between the spectra and the granule properties.Fig. 6a and b illustrate the score plot for the first two principal components (PCs), PC-1 and PC-2, and their loadings, respectively. The two PCs covered approximately 98% of the experimental variation. PC-1 explained 97% of the experimental variation, while PC-2 explained 1% of it. The PC-1 versus PC-2 score plot (Fig. 6a) shows a clear dependence on the granulation progress. The scores on the lower left in the figure correspond to the later stages of the mixing process, which was the starting point of the water addition phase. PC-2 became positive as the granulation fluid was added into the granulator, while PC-1 changed only slightly. While PC-2 was maintained at constant values, the PC-1 values varied from negative to positive with an increase in the granulation fluid volume. For the wet massing phase, PC-2 was on the lower right of the figure. The results suggest that PC-1 could explain the changes in the physical properties exception the particle size (D50). This is because of the high correlation between PC-1 and these properties. On the other hand, PC-2 was responsible for the changes in the particle size (D50) (data not shown).
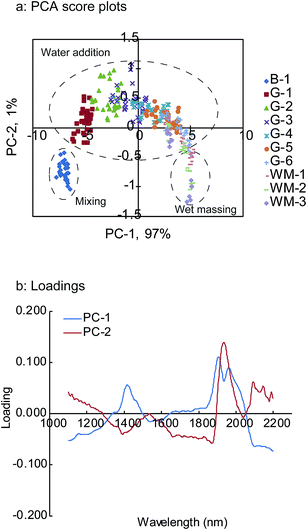 | ||
| Fig. 6 PCA score plot changes in the HSWG process (a) and loading plot (b) of first two PCs B-1: end of mixing process, G-1 to G-6: water addition phase, WM-1 to WM-3: wet massing phase. | ||
As is evident from the obtained results, the scores calculated by PCA indicate the changes in the granule properties during the HSWG process.32 In the case of the loading plots, PC-1 showed positive peaks at around 1430, 1910, and 1960 nm, while PC-2 showed a negative peak at around 1400 nm and a positive peak at around 1940 nm. These findings strongly correlated with the changes in the NIR spectra during the HSWG process and suggest that the peaks observed in the loading plots are the wavelengths that should be used for further analysis.
Quantitative data analysis by PLS
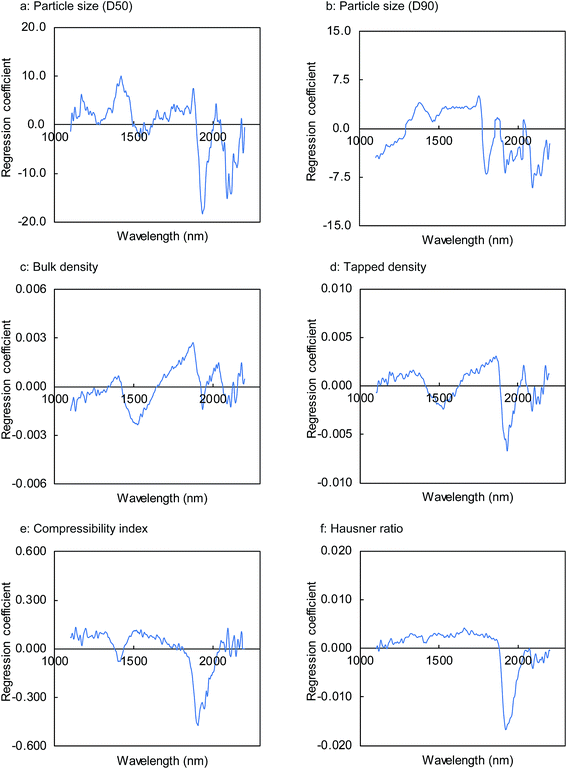 | ||
| Fig. 7 Regression coefficient of the PLS calibration models for physical properties of milled granules. | ||
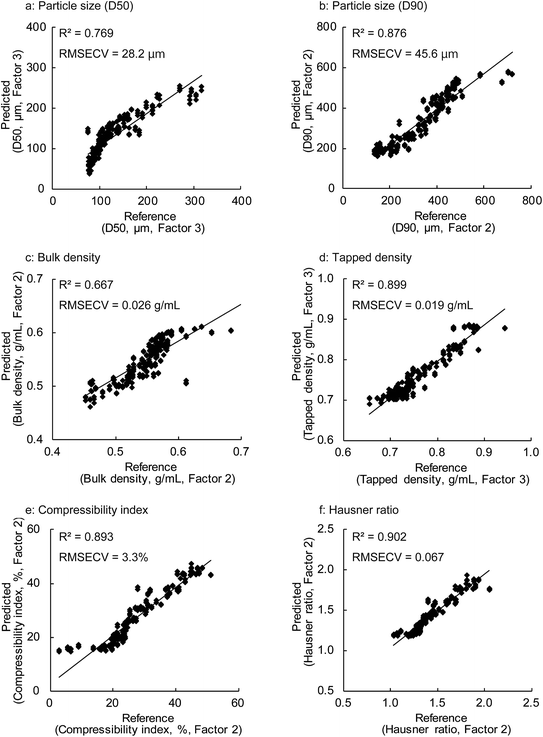
Fig. 8 shows the results obtained for the calibration models of the granule properties constructed by PLSR using the first two or three factors. With the exception of bulk density and particle size (D50), the coefficient of determination (R2) between the reference values and predicted values for the granule properties calculated by the leave-one-out cross validation was approximately 0.9, demonstrating a high correlation between both the values. The R2 values for the particle size (D90), tapped density, compressibility index, and Hausner ratio were 0.876, 0.899, 0.893, and 0.902, respectively. The RMSECV values were 45.6 μm, 0.019 g mL−1, 3.3%, and 0.067 for the particle size (D90), tapped density, compressibility index, and Hausner ratio, respectively. On the other hand, somewhat lower correlations were found for the bulk density and particle size (D50), with R2 values of 0.769 and 0.667, respectively. The RMSECV values for the particle size (D50) and tapped density were 28.2 μm and 0.026 g mL−1, respectively.
The high correlation and low cross-validation errors of the PLS calibration models using two or three factors suggest that these models possessed a good predictive potential. We found that no significant improvement in the accuracy was obtained by PLSR using a higher number of factors and different pre-treatment methods such as the first and second derivatives for the NIR spectra. However, further analyses focusing on the bulk density and particle size (D50) may be beneficial for improving the calibration accuracy.
| Sample no. | B-1 | G-1 | G-2 | G-3 | G-4 | G-5 | G-6 | WM-1 | WM-2 | WM-3 |
|---|---|---|---|---|---|---|---|---|---|---|
| Bulk density (g mL−1) | 0.540 | 0.562 | 0.564 | 0.575 | 0.587 | 0.606 | 0.581 | 0.591 | 0.591 | 0.611 |
| Tapped density (g mL−1) | 0.856 | 0.829 | 0.769 | 0.739 | 0.734 | 0.738 | 0.713 | 0.712 | 0.719 | 0.723 |
| Compressibility index (%) | 37 | 32 | 27 | 22 | 20 | 18 | 19 | 17 | 18 | 16 |
| Hausner ratio | 1.59 | 1.48 | 1.36 | 1.29 | 1.25 | 1.22 | 1.23 | 1.20 | 1.22 | 1.18 |
| Particle size, D50 (μm) | 187.2 | 79.3 | — | 78.2 | 88.3 | 94.9 | 128.3 | 141.5 | 162.8 | 194.6 |
| Particle size, D90 (μm) | 236.8 | 149.7 | 243.1 | 362.9 | 392.3 | 429.4 | 451.2 | 442.6 | 434.8 | 474.7 |
Fig. 9 shows the in-line monitoring results for the granule properties of the validation batch that was not used for the construction of the PLS calibration models. The best fits, which are the fits that gave the smallest RMSEP between the reference and predicted values of the validation batch, were those with three PLS factors for the particle size (D50) and tapped density and two PLS factors for the other properties. The coefficient of determination (R2) values for the PLS prediction models were greater than 0.7, confirming the close relationship between the predicted and the experimentally observed values. The PLS prediction models showed R2 values of 0.700, 0.909, 0.862, 0.971, 0.966, and 0.966 for the particle size (D50), particle size (D90), bulk density, tapped density, compressibility index, and Hausner ratio, respectively. The RMSEP value is a measure of the difference between the reference and predicted values and is important for the evaluation of the model prediction performance. The PLS prediction models gave RMSEP values of 33.9 μm, 45.3 μm, 0.04 g mL−1, 0.02 g mL−1, 6.6%, and 0.2 for the particle size (D50), particle size (D90), bulk density, tapped density, compressibility index, and Hausner ratio, respectively.
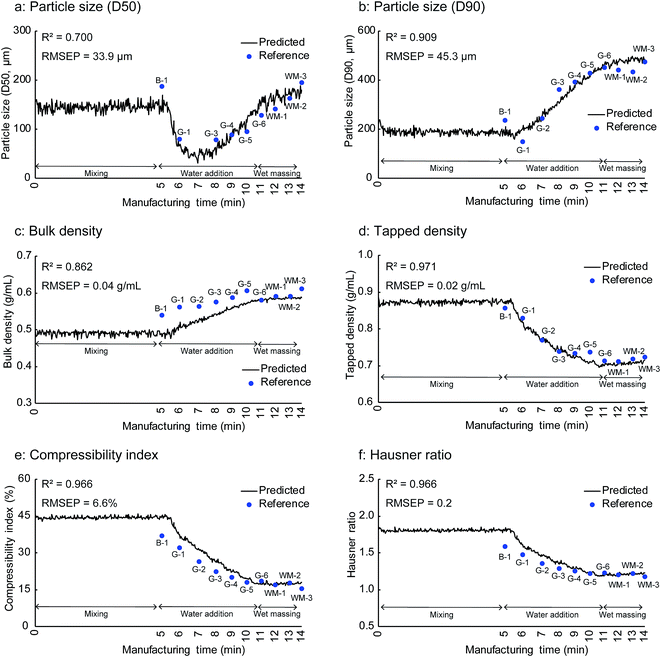 | ||
| Fig. 9 In-line monitoring results for physical properties of milled granules of the validation batch B-1: end of mixing process, G-1 to G-6: water addition phase, WM-1 to WM-3: wet massing phase. | ||
The amount of added water is associated with the granule properties changes during the HSWG process.33–36 An increase in the amount of water added enhanced the granule coalescence because the higher water saturation allowed the deformation of the granules, which resulted in an increase in the amount of water available at the their surface. This resulted in the growth of the granules growth and their densification during the HSWG process. Consequently, the granule properties such as the particle size, density and flowability changed with the amount of water added during the HSWG process. Moreover, as shown in Fig. 3, 6b, and 7, the amount of water added was the most important variable for determining the granule properties. These findings enable the prediction of the granule properties by the NIR spectra acquired during the HSWG process.
Rantanen et al. performed in-line NIR monitoring for the HSWG process to rotate a glass for preventing the adhesion of the powder.37 They found that the in-line NIRS monitoring including the prediction of the particle size of the granules in the HSWG process was challenging, necessitating the use of a time-resolved spectroscopic approach in combination with other process measurement tools such as the power consumption and torque with NIRS and enough datasets for building models. The PLS prediction models constructed in this study showed a good predictive ability for not only the particle size but also the other granule properties with a significantly higher accuracy of the predicted properties than that found in the previous research. The improved model performance achieved in this study is attributed to the use of a sufficiently large dataset for constructing the PLS calibration models and to the elimination of properly adhered granules from the glass surface using compressed air during the HSWG process (Fig. 10). Luukkonen et al. reported that it is challenging to use in-line NIRS monitoring at high impeller speeds. This implies that the prevention of probe fouling during manufacturing is a key element for the in-line NIRS monitoring of the HSWG process.22 Other PAT tools such as the FBRM probe with a scraping mechanism were developed to prevent probe fouling during manufacturing, and their usefulness has been reported.7 However, only a few methods have been developed to prevent the probe fouling during the HSWG process for the NIRS measurements. Thus, the in-line NIRS monitoring method used here was considered to be promising for practical use in the pharmaceutical industry because of the proper prevention of the adhesion of the granules on the glass surface and its non-invasive nature.
Conclusions
Since the introduction of the QbD approach, there has been a great interest in the development of rapid and non-invasive analytical methods for in-line monitoring of granule properties during the HSWG process. Here, the in-line monitoring of granule properties (particle size, density, and powder flowability) was conducted during the HSWG process using NIRS with a chemometrics approach as a rapid and non-invasive analytical method. The monitoring was done in the presence of compressed air for properly obtaining the NIR spectra during the HSWG process.The PCA score plot of the acquired NIR spectra pre-treated with SNV demonstrated clear changes with the granulation progress, implying that the application of the PCA score plot allows an effective end-point determination for the HSWG process with the understanding of the granulation process. The PLS models developed in this study provide an example of the valuable in-line NIRS monitoring method for predicting important granule properties affecting the final drug product quality obtained during the HSWG process. High coefficient of determination and low RMSECV and RMSEP values were achieved for the investigated granule properties with somewhat lower calibration accuracy for the particle size (D50) and bulk density. Further investigations are necessary to improve the calibration accuracy for both the properties.
Overall, the proposed in-line NIRS monitoring method employing compressed air was successfully used for the rapid and non-invasive analysis of granule properties during the HSWG process. The method proposed here allows the in-line monitoring and effective control of the HSWG process. Moreover, despite the complexity of the HSWG process, this method can facilitate the enhancement of the quality of drug products based on the QbD approach.
Conflict of interest
There are no conflicts to declare.References
- U.S. Department of Health and Human Services, Food and Drug Administration, Centre for Drug Evaluation and Research. 2004. Guidance for industry, PAT-a framework for innovative pharmaceutical development, manufacturing, and quality assurance, http://www.fda.gov/downloads/Drugs/GuidanceComplianceRegulatoryInformation/Guidances/ucm070305.pdf.
- International Conference on Harmonization of Technical Requirements for Registration of Pharmaceuticals for Human Use. ICH harmonized tripartite guideline, Pharmaceutical development Q8(R2), 2009.
- P. Pandey and S. Badawy, Drug Dev. Ind. Pharm., 2016, 42(2), 175 CrossRef CAS PubMed.
- T. M. Chitu, D. Oulahna and M. Hemati, Powder Technol., 2011, 208(2), 441 CrossRef CAS.
- A. Faure, P. York and R. C. Rowe, Eur. J. Pharm. Biopharm., 2001, 52(3), 269 CrossRef CAS PubMed.
- H. Leuenberge, Eur. J. Pharm. Biopharm., 2001, 52(3), 279 CrossRef.
- J. Huang, G. Kaul, J. Utz, P. Hernandez, V. Wong, D. Bradley, A. Nagi and D. O'grady, J. Pharm. Sci., 2010, 99(7), 3205 CrossRef CAS PubMed.
- Z. Arp, B. Smith, E. Dycus and D. O'grady, J. Pharm. Sci., 2011, 100(8), 3431 CrossRef CAS PubMed.
- J. F. Gamble, A. B. Dennis and M. Tobyn, Pharm. Dev. Technol., 2009, 14(3), 299 CrossRef CAS PubMed.
- M. Whitaker, G. R. Baker, J. Westrup, P. A. Goulding, D. R. Rudd, R. M. Belchamber and M. P. Collins, Int. J. Pharm., 2000, 205(1–2), 79 CrossRef CAS PubMed.
- A. S. Narang, V. Sheverev, V. Stepaniuk, S. Bawdy, T. Stevens, K. Macias, A. Wolf, P. Pandey, D. Bindra and S. Varia, J. Pharm. Sci., 2015, 104(3), 1019 CrossRef CAS PubMed.
- A. S. Narang, V. Sheverev, T. Freeman, D. Both, V. Stepaniuk, M. Delancy, D. Millington-Smith, K. Macias and G. Subramanian, J. Pharm. Sci., 2016, 105(1), 182 CrossRef CAS PubMed.
- M. Jamrógiewicz, J. Pharm. Biomed. Anal., 2012, 66, 1 CrossRef PubMed.
- R. Kona, H. Qu, R. Mattes, B. Jancsik, R. M. Fahmy and S. W. Hoag, Int. J. Pharm., 2013, 452(1–2), 63 CrossRef CAS PubMed.
- M. Alcala, M. Blanco, M. Bautista and J. M. Gonzárez, J. Pharm. Sci., 2010, 99(1), 336 CrossRef CAS PubMed.
- A. Burggraeve, F. T. Silva Ana, T. Van Den Kerkhof, M. Hellings, C. Vervaet, J. P. Remon, Y. V. Heyden and T. De Beer, Talanta, 2012, 100(15), 293 CrossRef CAS PubMed.
- M. Otsuka, A. Koyama and Y. Hattori, RSC Adv., 2014, 34, 17461 RSC.
- M. Otsuka, Y. Kanai and Y. Hattori, J. Pharm. Sci., 2014, 103(9), 2924 CrossRef CAS PubMed.
- M. Blanco, R. Cueva-Mestanza and A. Peguero, J. Pharm. Biomed. Anal., 2010, 51, 797 CrossRef CAS PubMed.
- A. C. Jørgensen, P. Luukkonen, J. Rantanen, T. Schæfer, A. M. Juppo and J. Yliruusi, J. Pharm. Sci., 2004, 93(9), 2232 CrossRef PubMed.
- S. Wu, S. S. Panikar, R. Singh, J. Zhang, B. Glasser and R. Ramachandran, Adv. Powder Technol., 2016, 27, 1115 CrossRef.
- P. Luukkonen, M. Fransson, I. N. Björn, J. Hautala, B. Lagerholm and S. Folestad, J. Pharm. Sci., 2008, 97(2), 950 CrossRef CAS PubMed.
- S. Mandato, C. C. Taliani, A. Aït-Kaddour, T. Ruiz and B. Cuq, J. Food Eng., 2013, 119, 533 CrossRef CAS.
- G. M. Troup and C. Georgakis, Comput. Chem. Eng., 2013, 51(5), 157 CrossRef CAS.
- A. Candolfi, R. De Maesschalck, D. Jouan-Rimbaud, P. A. Hailey and D. L. Massart, J. Pharm. Biomed. Anal., 1999, 21(1), 115 CrossRef CAS PubMed.
- M. G. Ierapetritou and R. Ramachandran, Process simulation and data modeling in solid oral drug development and manufacture, Springer Science + Business Media, New York, 2016 Search PubMed.
- A. Nokhodchi, Pharm. Technol., 2005, 29, 46 Search PubMed.
- M. B. Simpson, Near-infrared spectroscopy for process analytical chemistry: theory, technology and implementation in Process analytical technology, ed. K. A. Bakeev, Blackwell Publishing Ltd, UK, 2005, ch. 3, pp. 39–90 Search PubMed.
- M. Otsuka, Chemom. Intell. Lab. Syst., 2006, 82(1–2), 109 CrossRef CAS.
- C. R. Bull, Analyst, 1991, 116, 781 RSC.
- A. S. Tatavarti, R. Fahmy, H. Wu, A. S. Hussain, W. Marnane, D. Bensley, G. Hollenbeck and S. W. Hoag, AAPS PharmSciTech, 2005, 6(1), E91 CrossRef PubMed.
- M. Alcalà, M. Blanco, M. Bautista and J. M. González, J. Pharm. Sci., 2010, 99(1), 336 CrossRef PubMed.
- A. M. Bouwman, M. J. Henstra, D. Westerman, J. T. Chung, Z. Zhang, A. Ingram, J. P. K. Seville and H. W. Frijlink, Int. J. Pharm., 2005, 290(1–2), 129 CrossRef CAS PubMed.
- P. Pandey, J. Tao, A. Chaudhury, R. Ramachandran, J. Z. Gao and D. S. Bindra, Pharm. Dev. Technol., 2013, 18(1), 210 CrossRef CAS PubMed.
- S. F. Badawy, M. M. Menning, M. A. Gorko and D. L. Gilbert, Int. J. Pharm., 2000, 198(1), 51 CrossRef CAS PubMed.
- S. F. Badawy, A. S. Narang, K. LaMarche, G. Subramanian and S. A. Varia, Int. J. Pharm., 2012, 439(1–2), 324 CrossRef CAS PubMed.
- J. Rantanen, H. Wikström, R. Turner and L. S. Taylor, Anal. Chem., 2005, 77, 556 CrossRef CAS PubMed.
| This journal is © The Royal Society of Chemistry 2017 |

