 Open Access Article
Creative Commons Attribution 3.0 Unported Licence
Design and optimization of an ultra-sensitive hairpin DNA aptasensor for Salmonella detection†
Jayeon Lee ab,
Juyeon Jungab,
Chang Soo Lee*ab and
Tai Hwan Ha*ab
aDepartment of Nanobiotechnology, KRIBB School of Biotechnology, Korea University of Science & Technology, Daejeon 34141, Republic of Korea. E-mail: cslee@kribb.re.kr; taihwan@kribb.re.kr
bHazards Monitoring BNT Research Center, Korea Research Institute of Bioscience and Biotechnology (KRIBB), Daejeon 34141, Republic of Korea
First published on 12th July 2017
Abstract
A simple scheme using a hairpin DNA aptasensor was established to detect Salmonella Typhimurium (S. Typhimurium). The hairpin DNA aptasensor was a single-stranded oligonucleotide including both a target-binding sequence and a reporting DNAzyme called horseradish peroxidase-mimicking G-quadruplex. Four hairpin DNA aptasensors were investigated to optimize the sequence with two enzymatic substrates for different signaling modes. Covalent conjugation of hemin on an aptasensor strand was preliminarily executed in colorimetric assays and then conducted with p-coumaric acid in chemiluminescence assays, to lower the background signal arisen from free hemin. A limit of detection (LOD) of this detection scheme was 100 CFU mL−1 in colorimetric assays and was even further improved to 2 CFU mL−1 in chemiluminescent assays. The present detection scheme is expected to have application as a simple, rapid method for detection of various types of hazardous targets.
1. Introduction
Salmonellosis is a frequent foodborne disease caused by Salmonella; more than a million illnesses related to this disease are diagnosed each year in the United States of America (USA).1,2 There are two types of Salmonella infections: typhoidal and nontyphoidal infections. Typhoidal infections last a few days but do not necessarily require hospitalization, whereas nontyphoidal salmonellosis is a leading cause of hospitalization and death among foodborne illnesses in the USA. Nontyphoidal infections are particularly fatal in the elderly, infants, and patients with depressed immune systems. Therefore, many approaches for detection of Salmonella in foods have been established to prevent product recalls or bioterrorism.2–4A standard method for the detection of Salmonella is a conventional cultivation, which requires 4–7 days and trained technicians. Such time-consuming and labor-intensive procedures are not useful in urgent situations; thus, researchers have attempted to develop rapid detection methods such as PCR-based detection techniques5 and immunodiagnostic methods.2,6 Although the PCR procedure itself takes very short time, most of the PCR-based methods require pre-enrichment and DNA extraction steps.7 On the other hand, antibody-based detection methods such as ELISA (Enzyme-linked Immunosorbent Assay) can be directly performed without pre-enrichment steps and can use intact bacterium as a target. However, antibodies also have some limitations, mostly related to batch-to-batch variations in antibody production. To overcome these drawbacks, aptamers have emerged as an alternative to antibodies. Aptamers are single-stranded oligonucleotides that can interact with target molecules in a sensitive and specific manner. It is easy to chemically synthesize and modify aptamers without batch-to-batch variation.8 Accordingly, various types of aptamers have been developed and shown to be successful for target detection. Salmonella-specific aptamers have been used as ligands in several studies; however, non-DNA materials, such as nanoparticles, quantum dots, carbon nanotubes, or antibody conjugates, are also essential to signal transduction when Salmonella-specific aptamers are utilized.9–11 The use of multiple materials makes optimization of the experimental environment more complicated. In contrast, hairpin DNA aptasensors do not require non-DNA materials for signal transduction. Moreover, assays using hairpin aptasensors are rapid and exhibit sufficient sensitivity without sophisticated equipment.
Hairpin DNA aptasensors are generally composed of three DNA parts: a horseradish peroxidase (HRP)-mimicking G-quadruplex (a reporting DNAzyme), target-specific aptamer (the probe), and a blocking tail. The blocking tail is a complementary sequence encompassing some parts of the DNAzyme and the probe sequence, thereby inducing the formation of a hairpin structure that inhibits the nonspecific or premature activation of the DNAzyme. Since hairpin DNA aptasensors are composed of DNA, they are easy to use and provide the advantages of aptamers. Moreover, owing to the structural simplicity of such materials, the hairpin aptasensor scheme can be applied to diverse targets, and the adaptability of the system has been already demonstrated in many assays for small molecules such as ATP,12 ochratoxin A,13 and an oncogenic DNA sequence.14
Accordingly, in this study, we established a hairpin DNA aptasensor-based detection scheme for Salmonella enterica subsp. enterica serovar Typhimurium (S. Typhimurium), one of the major salmonellosis-causative serotypes.15 As schematically shown in Fig. 1, the stem of the Salmonella hairpin DNA aptasensor (SHD) was loosened in response to the target (S. Typhimurium), and the G-quadruplex, in collaboration with the cofactor (hemin), then catalyzed HRP substrates. Four strands of SHDs were introduced to optimize the sensitivity to S. Typhimurium, and the Gibbs free energy of the hairpin aptasensor system was evaluated.
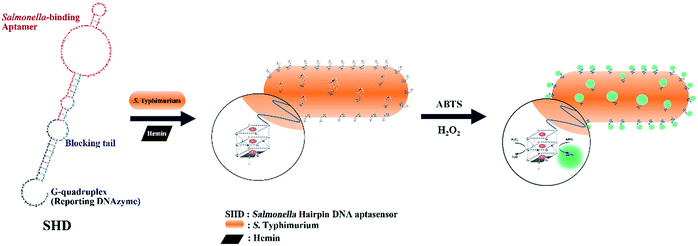 | ||
| Fig. 1 Schematic cartoon for detection of S. Typhimurium, using a Salmonella hairpin DNA aptasensor (SHD). | ||
2. Experimental
2.1 Materials
Oligonucleotides were purchased from Bioneer Inc. (Daejeon, Korea) and used as received. Nutrient broth for bacterial cultivation was purchased from BD Difco (San Diego, CA, USA). Hydrogen peroxide (30% [w/w] in H2O, H2O2) was purchased from Daejung Chemicals & Metals Co. (Daejeon, Korea), and 2,2′-azino-bis(3-ethylbenzothiazoline-6-sulfonic acid) (ABTS), hemin, and all other chemicals were purchased from Sigma-Aldrich (St. Louis, MO, USA).2.2 Bacterial strains and culture medium
S. Typhimurium ATCC 14028 and all other bacteria strains (Escherichia coli, ATCC 25922; Listeria monocytogenes, ATCC 19111; Vibrio parahaemolyticus, ATCC 27969) were obtained from the American Type Culture Collection (ATCC; Manassas, VA, USA). The bacteria were grown under ATCC-recommended liquid-medium culture conditions. Before incubation with SHDs, bacteria were washed twice with binding buffer (50 mM Tris–HCl, pH 7.4, 100 mM NaCl, 5 mM KCl, and 1 mM MgCl2).2.3 Gibbs free energy calculation of SHDs
Each SHD had a different blocking tail (Table 1). The hairpin formation energy of each SHD was calculated based on an OligoAnalyzer (Integrated DNA Technology (IDT; http://www.eu.idtdna.com). The G-quadruplex (EAD2) formation energy
  was experimentally estimated (see ESI†), and the dissociation constant between S. Typhimurium and the aptamer was described in a previous report16
| Name | Sequence (5′ to 3′) |
|---|---|
| a Blocking tails are underlined. | |
| SHD1 | CTGGGAGGGAGGGAGGGAAAAAGTAATGCCCGGTAGTTATTCAAAGATGAGTAGGAAAAGAGGCATTACTAAATCCCTCCCTC |
| SHD2 | CTGGGAGGGAGGGAGGGAAAAAGTAATGCCCGGTAGTTATTCAAAGATGAGTAGGAAAAGAGGCATAACTAAATCCCTCCC |
| SHD3 | CTGGGAGGGAGGGAGGGAAAAAGTAATGCCCGGTAGTTATTCAAAGATGAGTAGGAAAAGAGGCTAAACTAAATCCCTCCC |
| SHD4 | CTGGGAGGGAGGGAGGGAAAAAGTAATGCCCGGTAGTTATTCAAAGATGAGTAGGAAAAGACCCTCCCa |
2.4 Colorimetric assays using ABTS
The enzymatic kinetics of all SHDs were investigated by recording time-dependent absorbance changes in the peroxidase substrate, ABTS, at 420 nm. A UV-Vis spectrophotometer (DU800; Beckman Coulter Inc., USA) was used to assess changes in absorbance. Prior to all experiments, oligonucleotides were heated to 90 °C and allowed to cool to 25 °C. Each SHD was mixed with a certain amount of S. Typhimurium and incubated at room temperature for 30 min. Next, 3 × hemin (3-fold excess based on the SHD concentration) was added to the mixture and further incubated for 5 min. Finally, a mixture of 2.5 mM ABTS and H2O2 was then added to the SHD mixtures at a volume ratio of 3![[thin space (1/6-em)]](https://www.rsc.org/images/entities/char_2009.gif) :
:![[thin space (1/6-em)]](https://www.rsc.org/images/entities/char_2009.gif) 1. The final DNA concentration was 200 nM. Changes in the absorbance of ABTS were recorded during the initial 2 min reaction with 15 s intervals. The observed blank absorbance was subtracted from the measured absorbance for each sample, and the blank absorbance was set as zero.
1. The final DNA concentration was 200 nM. Changes in the absorbance of ABTS were recorded during the initial 2 min reaction with 15 s intervals. The observed blank absorbance was subtracted from the measured absorbance for each sample, and the blank absorbance was set as zero.
2.5 Hemin conjugation
Hemin (NHS)2 was conjugated with 5′-amino-SHD2. Next, 200 μM 5′-amino-SHD2 in 100 mM N,N-diisopropylethylamine (DIPEA) was reacted with 120 mM hemin (NHS)2 for 12 h. Excessive hemin was removed by phenol/chloroform/isoamyl alcohol DNA extraction and ethanol DNA precipitation. The final concentration of hemin-conjugated SHD2 (hem-SHD2) was 100 nM, and this conjugate was used for colorimetric assays, as described above.2.6 Chemiluminescent (CL) assays using luminol
The enzymatic kinetics of all SHDs were investigated by recording the accumulated CL intensity of the reaction for the initial 100 s. A CL imaging system (ChemiDoc MP; Bio-Rad, Hercules, CA, USA) was used for measurement of the CL intensity. A substrate mixture (2 mM luminol, H2O2, and 0.5 mM p-coumaric acid) was freshly prepared for each experiment. SHDs were mixed with 5 × hemin and a certain amount of S. Typhimurium and then incubated at room temperature for 30 min. A substrate mixture was then added to the SHD mixture at a volume ratio of 4![[thin space (1/6-em)]](https://www.rsc.org/images/entities/char_2009.gif) :
:![[thin space (1/6-em)]](https://www.rsc.org/images/entities/char_2009.gif) 1, and the initial CL intensity was measured immediately. The final concentration of SHDs was 200 nM.
1, and the initial CL intensity was measured immediately. The final concentration of SHDs was 200 nM.
3. Results and discussion
Four different hairpin DNA aptasensors (SHD1 to SHD4) were proposed to determine the optimal sequence for rapid detection of living S. Typhimurium. A reporting DNAzyme sequence (EAD2) and S. Typhimurium-specific aptamer (ST2) were shared, but the blocking tail on the 3′-end varied for all SHDs (Table 1). was determined based on the number of base pairs between the blocking tail and the counter sequence (a part of the shared sequence). To prevent premature enzymatic activation, the free energy change from the hairpin state to the G-quadruplex must be thermodynamically unfavorable:
  . The target-binding energy of ST2
  was calculated to be −10.6 kcal mol−1 in a previous report of whole-bacterium SELEX (a binding component is yet unknown),16 and
  was experimentally determined to be −9.5 kcal mol−1. Thus,
  should be between −20.1 kcal mol−1
  and −9.5 kcal mol−1
  to prevent nonspecific activation of EAD2. The theoretical
  values of SHD1 to SHD4 were calculated to be −18.5, −11.9, −8.4, and −5.8 kcal mol−1, respectively. All four hairpins were thermodynamically susceptible to loosening when S. Typhimurium was present, but SHD3 and SHD4 could be partially loosened without S. Typhimurium. Thus, according to thermodynamic calculations, SHD1 or SHD2 was expected to be the most suitable sequence for detection, whereas SHD3 and SHD4 were expected to have rather a high background signal.
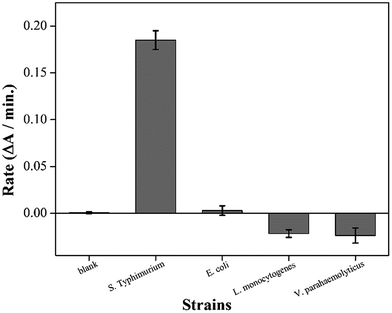
In a SELEX procedure, an optimum aptamer sequence is elaborately trimmed in a base-by-base manner because the binding affinity can vary with a single-base difference.17 In our scheme, two functional groups (EAD2 and ST2) were continuously linked in a short DNA strand; therefore, we first examined whether these groups retained their functionality. We incubated SHD2 with S. Typhimurium or three different bacterial strains for the crossreaction test. Each bacterial strain was incubated with SHD2 for 30 min, added to 3 × hemin, and incubated for an additional 5 min. The mixture was then added to the HRP substrate mixture (ABTS and H2O2), and the initial 2 min reaction rate was measured for each sample. The reaction rate of the blank was set to zero, since free hemin can induce the reduction of H2O2 and generate ABTS radicals. As shown in Fig. 2, SHD2 was enzymatically activated in the presence of S. Typhimurium, but did not properly respond to other strains. For nontarget strains (i.e., E. coli, Listeria, or Vibrio), the SHD2 did not interact or even suppressed the naturally occurring enzymatic reaction of EAD2. These suppressed reactions suggested that G-quadruplex formation was hindered by nonspecific interactions between the SHD2 and the cell surface of nontarget strains. In contrast, SHD2 was prone to interact with S. Typhimurium and simultaneously activate the G-quadruplex, indicating that SHD2 retained both ST2 and EAD2 functions.
The infectious dose of Salmonella is generally known to be more than 105 cells; however, this can be reduced to dozens of cells in some extreme cases.18 Therefore, high sensitivity is critical for preventive Salmonella screening in foods or drinking water. The sensitivities of all SHDs were evaluated by colorimetric assays, using ABTS and H2O2 as HRP substrates; the initial absorbance change was monitored for 2 min. The blank signal for each SHD was proportional to the hairpin formation energy (data not shown), and this value was subtracted from the measured absorbance to adjust the blank to zero. As shown in Fig. 3, all four SHDs were activated by S. Typhimurium, and their sensitivities were proportional to the hairpin formation energy; higher hairpin formation energies  were associated with higher signal intensities. SHD4 (or SHD3), compared with SHD1 or SHD2, had better sensitivity to S. Typhimurium. These observations were contradictory to our initial expectations based on the ΔG° calculation because we assumed that SHD3 and SHD4 would fail to respond to gradual concentration increases in S. Typhimurium due to premature loosening of the hairpin.
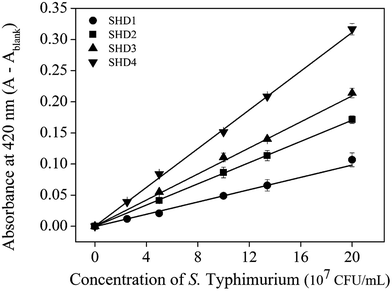 | ||
| Fig. 3 Absorbance changes of four SHDs with a confidence level of 2σ. [SHDs] = 100 nM, [hemin] = 300 nM. | ||
The entire assay was completed within 1 hour; however, the background signal (or signal from the blank) was too high, and the limit of detection (LOD) was measured to be 107 CFU mL−1 for SHD4. Thus, because only 105 cells can cause infection, the assay sensitivity was insufficient. Three-fold excess hemin was required for the stable G-quadruplex formation of SHD, and this excess hemin itself functioned as a weak peroxidase and caused substantial background signal. In order to tackle this problem, hemin was covalently conjugated to the 5′-end of the SHD strand, as in our previous study, which enhanced the stability of G-quadruplex formation without requiring an excessive dose of hemin.19 Since the hemin conjugation lowers  ,
,  should be further lower relative to
  to prevent the premature loosening of the hairpin. Therefore, SHD2
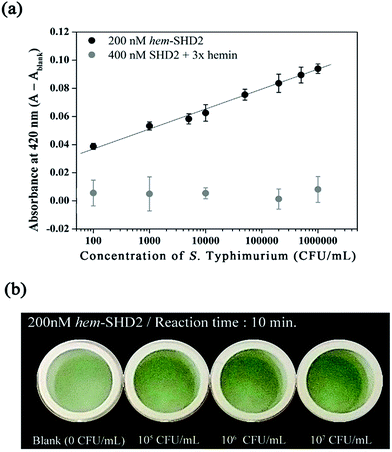
  was chosen as a model strand for the hemin conjugation test by satisfying the condition above (detailed procedures for hemin conjugation are described in our previous report19). Compared to the blank signal of free hemin-SHD2, that of hemin-conjugated SHD2 was reduced, and this value was subtracted from the measured absorbance to set the blank to zero. As shown in Fig. 4(a), hemin conjugation dramatically enhanced the sensitivity of the system; the LOD was reduced from 107 CFU mL−1 to 100 CFU mL−1 by hemin modification on the 5′-end of SHD2. In contrast, SHD2 with free hemin could not detect S. Typhimurium in less than 107 CFU mL−1 owing to the high background signal from excess hemin. Furthermore, elimination of the noise from free hemin reaction allowed naked-eye detection of S. Typhimurium, as shown in Fig. 4(b).
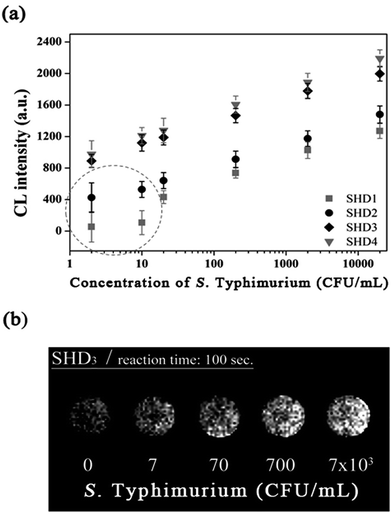
Although colorimetric assays are a convenient method and do not require sophisticated equipment, the measurement can be easily disrupted by the colour of an opaque specimen. In contrast, CL assays are not complicated by noise from the specimen and only recognize the signal derived from the enzymatic luminescent reaction. In this regard, we demonstrated that CL assays using luminol resulted in a greater decrease in the LOD down to a single-digit CFU. In this assay, hemin conjugation was omitted because p-coumaric acid was added to the luminol–H2O2 mixture to eliminate the noise from free hemin. In the presence of H2O2, free hemin reacts to produce a dimeric Fe(III)-porphyrin π-cation radical, a hemin intermediate. This hemin intermediate causes the oxidation of luminol, which is the first step in luminol-induced light emission. However, in the presence of p-coumaric acid, a known antioxidant (an antiradical agent), it competes with luminol for the hemin intermediate, and the production of oxidized luminol is therefore interrupted until p-coumaric acid is completely consumed.20 Therefore CL intensity of both hemin-EAD2 complex and free hemin was expected to be decreased by p-coumaric acid. Interestingly, in this study, we observed that the CL intensity of EAD2-hemin complex was decreased but signal (derived from DNAzyme-hemin complex)-to-noise (derived from free hemin) ratio was rather increased. Competitive oxidation of p-coumaric acid was more critical to catalytic activity of free hemin (see ESI†). This phenomenon can be explained by the studies reporting the catalytic activity of hemin with or without DNAzyme sequences. According to previous reports, free hemin reacts with H2O2 and forms the dimeric intermediate, which is responsible for catalysis of two equivalents of luminol.20,21 On the other hand, in the presence of DNAzyme strands, one hemin molecule interact with DNAzyme and forms reactive hemin intermediate to catalyse two equivalents of luminol.22 Since these two hemin species are different, enzymatic activity of each species might differ. In CL assays, the magnitudes of the CL intensity from the blank and from the reaction between SHD and S. Typhimurium were in the order of the hairpin formation energy  . The CL intensity from the blank of each SHD was subtracted from all the measured intensities; thus, the blank intensity of all SHDs was adjusted to zero. As shown in Fig. 5(a), the slope of each SHD indicated that all SHDs had similar reactivity to S. Typhimurium concentration changes, except SHD1 and SHD2, which failed to activate EAD2 at low S. Typhimurium concentrations of less than 10 CFU mL−1 [dotted circle in Fig. 5(a)]. Both SHD3 and SHD4 showed concentration-dependent CL intensities over the whole concentration range, enabling quantification at concentrations under 5 CFU mL−1. As shown in Fig. 5(b), the graphical CL images of SHD3 aptasensors that were obtained by 100 s intensity accumulation clearly showed the enhanced sensitivity of the CL assays, demonstrating more luminescence with increasing concentration; the measured LOD of SHD3 was 2 CFU mL−1, which is comparable with LOD of PCR techniques (Fig. 6).7
Furthermore, we have also applied this scheme to real samples inoculated with S. Typhimurium, such as milk and chicken eggs. To ensure fast detection time, Salmonella was simply diluted to measure the CL intensity change dependent on target concentration without separating from the sample. We observed that uninoculated real sample can interfere the CL intensity derived from hemin-EAD2 complex; the change in CL intensity was suppressed in the undiluted samples, but not suppressed in the samples with more than 100-fold dilution. Therefore, instead of using pure samples, we chose 100-fold diluted samples to perform our scheme to quantify S. Typhimurium in pure samples (see ESI†). LOD of SHD3 in eggs was calculated to be 105 CFU mL−1, which is an inevitable drawback due to the dilution requirement. Further studies are under invenstigation to improve the LOD of SHDs in a real sample.
As described above, SHD1 or SHD2 was expected to be the optimal aptasensor sequence, but SHD3 (or SHD4) was more sensitive to S. Typhimurium detection in both colorimetric and CL assays. Based on the thermodynamics of the reaction, we expected that a significant portion of SHD3 (or SHD4) would spontaneously loosen its hairpin structure in the presence of hemin, thereby weakening the dependence of the structure on Salmonella exposure. In fact, the hairpin formation energies of SHD3 ( , −8.4 kcal mol−1) and SHD4 (
 , −5.8 kcal mol−1) were smaller than the formation energy of G-quadruplex (
 , −9.5 kcal mol−1), indicating that spontaneous formation of G-quadruplex was favorable without the target. For example, the free energy change of SHD4 from its hairpin state
  to hemin binding state
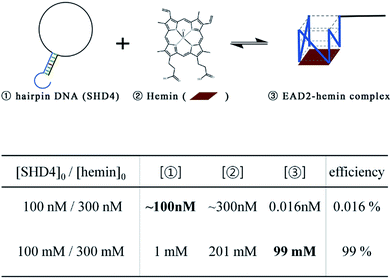
  was estimated to be −3.7 kcal mol−1. This negative free energy change seemed to suggest that the majority of SHD4 was present in the form of a G-quadruplex, even without S. Typhimurium, and that the target sensing ability was deteriorated accordingly. However, actual calculation of the ratio of the hemin binding state revealed that most SHD4 maintained the hairpin state (see Fig. 5 and ESI†). These counterintuitive results were caused by the extremely diluted experimental concentration (100 nM SHD4 and 300 nM hemin) and the nature of the bimolecular reaction for the binding of SHD4 with hemin; the standard free energy change of a reaction involves participating components at a concentration of 1 M. At concentrations lower than the submicromolar level, SHD3 and SHD4 could maintain the hairpin state before the addition S. Typhimurium and thus were endowed with the capacity to unfold more quickly in response to the target than other more tightly bound hairpins (SHD1 and SHD2; see ESI Table S1†).
4. Conclusions
Four hairpin DNA aptasensors, designated SHDx, were proposed for the rapid and label-free detection of S. Typhimurium. Each SHD was composed of two common sequences (EAD2 and ST2) and a blocking tail sequence, which enabled SHDs to form unique stem-loop hairpin structures to inhibit nonspecific enzymatic reactions; SHD1 had the highest hairpin formation energy (−18.5 kcal mol−1), whereas SHD4 has the lowest hairpin formation energy (−5.8 kcal mol−1). Both in colorimetric and CL assays, SHD4 showed the most prominent performance among the four SHDs, demonstrating highest sensitivity in the concentration-dependent measurements. In those assays, however, excessive hemin was a problem, causing high background signals and poor LODs. To tackle this problem, we conjugated hemin to the 5′-end of the SHD strand; this lowered the LOD in colorimetric assays to 102 CFU mL−1, which was 105-fold lower than the LOD from the SHD with free hemin. In CL assays, p-coumaric acid (a CL enhancer) could play a similar role in lowering the background signal by scavenging radicals from the reactive hemin intermediate. In the CL assay, SHD3 and SHD4 were therefore able to detect highly diluted concentrations as low as 2 CFU mL−1. Since the LOD was ultimately determined by the sensitivity of ST2 (the target-specific aptamer), the LOD may be improved by using more sensitive aptamers. Additionally, G-quadruplex formation was favorable compared with hairpin formation for SHD4 , premature loosening of the hairpin was expected. However, SHD4 showed the most prominent activity and sensitivity toward S. Typhimurium in actual experiments. According to Gibbs free energy calculations, when used at nanomolar concentrations, the hairpin DNA aptasensor required a larger free energy change than the hairpin DNA aptasensor above millimolar concentrations. We therefore recommend Gibbs free energy calculations for determining the experimental concentrations of aptamers and hemin before applying them to the desired detection platform.
Acknowledgements
We would like to acknowledge the financial support from the KRIBB Initiative Research Program and the R&D Convergence Program (CAP-14-3-KRISS) of NST (National Research Council of Science & Technology) of Republic of Korea.References
- S. Elaine, M. H. Robert, J. A. Frederick, V. T. Robert, W. Marc-Alain, L. R. Sharon, L. J. Jeffery and M. G. Patricia, Emerging Infect. Dis., 2011, 17, 7 CrossRef PubMed.
- K.-M. Lee, M. Runyon, T. J. Herrman, R. Phillips and J. Hsieh, Food Control, 2015, 47, 264–276 CrossRef.
- M. McClelland, K. E. Sanderson, J. Spieth, S. W. Clifton, P. Latreille, L. Courtney, S. Porwollik, J. Ali, M. Dante, F. Du, S. Hou, D. Layman, S. Leonard, C. Nguyen, K. Scott, A. Holmes, N. Grewal, E. Mulvaney, E. Ryan, H. Sun, L. Florea, W. Miller, T. Stoneking, M. Nhan, R. Waterston and R. K. Wilson, Nature, 2001, 413, 852–856 CrossRef CAS PubMed.
- O. S. Kolovskaya, A. G. Savitskaya, T. N. Zamay, I. T. Reshetneva, G. S. Zamay, E. N. Erkaev, X. Wang, M. Wehbe, A. B. Salmina, O. V. Perianova, O. A. Zubkova, E. A. Spivak, V. S. Mezko, Y. E. Glazyrin, N. M. Titova, M. V. Berezovski and A. S. Zamay, J. Med. Chem., 2013, 56, 1564–1572 CrossRef CAS PubMed.
- B. C. Strachan, H. S. Sloane, E. Houpt, J. C. Lee, D. C. Miranian, J. Li, D. A. Nelson and J. P. Landers, Analyst, 2016, 141, 947–955 RSC.
- I. Pereiro, A. Bendali, S. Tabnaoui, L. Alexandre, J. Srbova, Z. Bilkova, S. Deegan, L. Joshi, J.-L. Viovy, L. Malaquin, B. Dupuy and S. Descroix, Chem. Sci., 2017, 8, 1329–1336 RSC.
- J.-Y. Hyeon and X. Deng, Food Microbiol., 2017, 63, 111–116 CrossRef CAS PubMed.
- S. D. Jayasena, Clin. Chem., 1999, 45, 1628–1650 CAS.
- W. Wu, J. Li, D. Pan, J. Li, S. Song, M. Rong, Z. Li, J. Gao and J. Lu, ACS Appl. Mater. Interfaces, 2014, 6, 16974–16981 CAS.
- M. Yang, Z. Peng, Y. Ning, Y. Chen, Q. Zhou and L. Deng, Sensors, 2013, 13, 6865–6881 CrossRef CAS PubMed.
- N. Duan, S. Wu, Y. Yu, X. Ma, Y. Xia, X. Chen, Y. Huang and Z. Wang, Anal. Chim. Acta, 2013, 804, 151–158 CrossRef CAS PubMed.
- W. Chen, Y. Hu, J. Li, Y. Li, J. Bai, J. Zheng and R. Yang, Anal. Methods, 2014, 6, 3219–3222 RSC.
- C. Yang, V. Lates, B. Prieto-Simón, J.-L. Marty and X. Yang, Biosens. Bioelectron., 2012, 32, 208–212 CrossRef CAS PubMed.
- S. Shimron, F. Wang, R. Orbach and I. Willner, Anal. Chem., 2012, 84, 1042–1048 CrossRef CAS PubMed.
- CDC, Journal, 2014, DOI: http://www.cdc.gov/foodnet/PDFs/2012_annual_report_508c.pdf.
- N. Duan, S. Wu, X. Chen, Y. Huang, Y. Xia, X. Ma and Z. Wang, J. Agric. Food Chem., 2013, 61, 3229–3234 CrossRef CAS PubMed.
- J. A. Cruz-Aguado and G. Penner, J. Agric. Food Chem., 2008, 56, 10456–10461 CrossRef CAS PubMed.
- M. J. L. James, M. Jay, and D. A. Golden, Modern Food Microbiology Modern Food Microbiology, Springer Science, New York, NY, 7th edn, 2005 Search PubMed.
- J. Lee, C. H. Jeon, S. J. Ahn and T. H. Ha, Analyst, 2014, 139, 1622–1627 RSC.
- E. L. Bastos, P. Romoff, C. R. Eckert and W. J. Baader, J. Agric. Food Chem., 2003, 51, 7481–7488 CrossRef CAS PubMed.
- P. Jones and N. R. Scowen, Photochem. Photobiol., 1987, 45, 283–289 CrossRef CAS.
- L. Stefan, F. Denat and D. Monchaud, Nucleic Acids Res., 2012, 40, 8759–8772 CrossRef CAS PubMed.
Footnote |
| † Electronic supplementary information (ESI) available. See DOI: 10.1039/c7ra06000a |
| This journal is © The Royal Society of Chemistry 2017 |

