 Open Access Article
Creative Commons Attribution 3.0 Unported Licence
Platinum–copper doped poly(sulfonyldiphenol/cyclophosphazene/benzidine)–graphene oxide composite as an electrode material for single stack direct alcohol alkaline fuel cells
Prasanna Dakshinamoorthy and
Selvaraj Vaithilingam *
*
Nanotech Research Lab, Department of Chemistry, University College of Engineering Villupuram, (A Constituent College of Anna University, Chennai), Kakuppam, Villupuram-605 103, Tamilnadu, India. E-mail: vaithilingamselvaraj@gmail.com; vselva@aucev.edu.in; rajselva_77@yahoo.co.in; Fax: +91-4146-224500
First published on 12th July 2017
Abstract
The present work has attempted to prepare platinum–copper (Pt–Cu) and platinum (Pt) nanoparticle-deposited poly(sulfonyldiphenol/cyclophosphazene/benzidine)–graphene oxide catalysts for the electrochemical oxidation of alcohols and single stack direct alkaline alcohol fuel cells. Electrochemical performance of methanol and ethylene glycol is measured using Pt–Cu/poly(SDP/CP/BZ)–GO and Pt/poly(SDP/CP/BZ)–GO catalysts as the working electrode in KOH solution using cyclic voltammetry analysis. Platinum–copper and platinum nanoparticles embedded with the poly(SDP/CP/BZ)–GO composite show enhanced electrooxidation current, lower onset potential and good CO tolerance compared to that of Pt/GO and Pt/poly(SDP/CP/BZ) catalysts. Further, the Pt–Cu/poly(SDP/CP/BZ)–GO catalyst exhibits enhanced catalytic activity with respect to lower onset potential and higher oxidation current than that of the Pt/poly(SDP/CP/BZ) catalyst. Hence, single stack direct alcohol alkaline fuel cells are constructed using the Pt–Cu/poly(SDP/CP/BZ)–GO catalyst as an electrode material. The optimum power densities of 112.24 and 140.67 mW cm−2 are observed for methanol and ethylene glycol in single direct alkaline alcohol fuel cells.
1. Introduction
The direct alkaline alcohol fuel cell (DAAFC) is a potent and attractive electrochemical device, which generates electricity from liquid alcohol fuel due to its promising energy conversion, lower corrosion, high energy density, high energy conversion efficiency, low operating temperature and environmental friendliness. The significant advantages of direct alcohol fuel cells (DAFC) such as, easy to handle, store, transport and refuel, make the DAFC an attractive substitute to batteries and combustion engines. Recent reports state that the alcohol oxidation in alkaline medium is kinetically faster than in acidic media.1–5 Moreover, the cost of proton conducting polymer membranes like Nafion used in direct acid alcohol fuel cells is higher than that of anion exchange membranes used in direct alkaline alcohol fuel cell applications. Further, the poisoning issue of the electrode material and alcohol crossover limits the performance of proton exchange membranes. In addition, the direction of the electro-osmotic drag is from the anode to the cathode in acid medium, which reduces the cell performance. The reaction kinetics and catalytic activities of the anodic oxidation of fuel and the cathodic reduction of O2 in alkaline media are significantly higher than those in acidic media. The development of novel electrode materials operated at low temperature is essential for the diverse applications. A potential advantage of the direct alkaline alcohol fuel cell is that the alcohol in alkaline medium is less structure sensitive of the catalyst than in acid media. Hence, the structure of the catalyst will not be changed during the electrooxidation of alcohol in alkaline medium.Graphene oxide (GO) is a good catalyst support due to its high electron in-plane transport rate, simple preparation method and low cost carbon in comparison with CNT. Graphene oxide based nanocomposites are paying more attention as a new material because of their extraordinary physical and chemical properties for various applications. Graphene oxide based nanocomposites were applied for the fabrication of electronic devices, batteries, super capacitor, solar cells, fuel cells and electrocatalytic applications.6–9 Further, the recent reports state that the GO supported platinum nanoparticles composite exhibits superior electrocatalytic activities and high poison tolerance for alcohol oxidation when compared to that of other carbon supported platinum nanoparticles.10–13
Furthermore, to enhance the stability, activity and dispersibility of metal nanoparticles, the GO are coupled with conductive polymers like poly(aniline), poly(pyrrole), poly(thiophene), etc., to a form conductive polymer/GO composites.14–16 Such, composite materials show strong interaction with metal nanoparticles, which exhibits better electrocatalytic activity and stability. Hence, a new type of conductive polymer is attempted to coat over the graphene oxide surface to get covalent bonded conductive polymer–graphene oxide composite along with π–π stack interaction. The designing of new composite materials with a hexachlorocyclotriphosphazene group as a linker for multiple monomers as well as with graphene oxide have attracted more attention because of their special desired coupling to get a new type of linkage between graphene oxide and monomers during the polymerization process. The composite covalent bond along with non-covalent bond formation such as π–π stack interaction, the van der Waals force of attraction and hydrogen bonding are expected to show good thermal stability, catalytic properties, electrical conductivity, and stable under aggressive condition.17
With this view in mind, the present work is projected to prepare poly(sulfonyldiphenol/cyclophosphazene/benzidine) polymer–graphene oxide composite as a supporting material for platinum (Pt) and platinum–copper (Pt–Cu) nanoparticles. Pt–Cu/poly(SDP/CP/BZ)–GO catalyst is fabricated and subjected to electrooxidation of alcohol oxidation in alkaline medium. Further, the electrooxidation of alcohol oxidation on Pt/poly(SDP/CP/BZ)–GO, Pt/poly(SDP/CP/BZ) and Pt/GO were also investigated in order to confirm the efficiency of poly(SDP/CP/BZ)–GO composite as supporting material. The electrochemical performance investigation concludes that the poly(SDP/CP/BZ)–GO composite is a good supporting material for the deposition of metal nanoparticles with uniform distribution and shows improved electrocatalytic oxidation of methanol and ethylene glycol for fuel cell applications. Further, the best performed catalyst Pt–Cu/poly(SDP/CP/BZ)–GO was used to fabricate single stack direct alcohol alkaline fuel cell and their performance were checked under different experimental condition to optimize the single stack test fuel cell.
2. Experimental methods
2.1. Materials
Hexachlorocyclotriphosphazene (HCCP) and benzidine (BZ) were purchased from Sigma Aldrich, India. Reagent grade 4,4′-sulfonyldiphenol, potassium permanganate (KMnO4), concentrated sulfuric acid (H2SO4), sodium nitrate (NaNO3), formaldehyde (HCHO), graphite powder, ethylene glycol, methanol, ethanol, hexachloroplatinic acid hexahydrate (H2PtCl6·6H2O) and copper chloride (CuCl2) were purchased from SRL, India.2.2. Preparation of graphene oxide
Graphene oxide was prepared from the natural flake graphite according to the modified Hummers method.18,19 In this method, 2.0 g of graphite powder and 4.0 g of NaNO3 were added to 80 mL of cold (0 °C) concentrated H2SO4 in an ice bath. Then, KMnO4 (8.0 g) was added gradually under stirring and care was taken to maintain the reaction temperature below 10 °C. The reaction mixture was continuously stirred for another 4 h during which the reaction temperature is maintained below 10 °C. Next, the reaction mixture was stirred at 35 °C for further 4 h and then diluted with 200 mL of deionized (DI) water. The addition of water in concentrated sulfuric acid medium releases a large amount of heat and thus the addition of water was performed under an ice bath environment to keep the temperature below 100 °C. After adding DI water, the mixture was stirred for another 1 h. Finally, 15 mL of 30% H2O2 solution was added to the above reaction mixture in order to terminate the reaction. The solid product was separated by centrifugation process and washed three times with 5% HCl solution. The resulting solid was re-dispersed in DI water and dialyzed for three days to remove the residual salts and acids. The solid suspension was filtered and dried in a vacuum oven at 45 °C for 48 h to obtain graphite oxide for further use.2.3. Preparation of poly(sulfonyldiphenol/cyclophosphazene/benzidine)–graphene oxide (poly(SDP/CP/BZ)–GO) composite
For the preparation of poly(SDP/CP/BZ)–GO composite, 10 mg of graphene oxide was dispersed in 80 mL of DMSO solution. 20 mg of hexachlorocyclotriphosphazene (CP), 29 mg of benzidine, 29 mg of 4,4′-sulfonyldiphenol (SDP) and 4 mL of triethylamine (TEA) were added to the above reaction mixture. The polycondensation reaction was carried out in an ultrasonic bath (100 W, 40 kHz) at room temperature for 12 h. After completion of the reaction, the poly(SDP/CP/BZ)–GO composite was filtered and its impurities were removed by washing repeatedly with distilled water and then dried at 60 °C in an oven for 24 h.2.4. Synthesis of platinum and platinum–copper nanoparticles deposited poly(SDP/CP/BZ)–GO composite
For the Pt/poly(SDP/CP/BZ)–GO catalyst preparation, 30 mg of poly(SDP/CP/BZ)–GO composite was suspended in 5 mL distilled water and stirred under ultrasonic treatment for 20 min. 54 mg of H2PtCl6·6H2O dissolved in 20 mL of distilled water is added to the above reaction mixture and the pH of the reaction mixture was adjusted to 11 with 2.5 M NaOH. 1.0 mL of formaldehyde (37%) was added to the above solution at 85 °C in order to initiate the reduction process to deposit the platinum on poly(SDP/CP/BZ)–GO composite. The reaction was continued for another 5 h in order to complete the reduction of platinum salts to Pt nanoparticles. The resultant solid was filtered, washed with distilled water and then dried at 60 °C for 8 hours. The Pt–Cu nanoparticles were deposited on 60 mg of poly(SDP/CP/BZ)–GO composite by following similar experimental procedure with 54 mg of H2PtCl6·6H2O, 14 mg of CuCl2 and 2 mL of HCHO to get Pt–Cu/poly(SDP/CP/BZ)–GO catalyst. For comparative studies, the platinum nanoparticles were also deposited on graphene oxide and poly(SDP/CP/BZ) by utilizing similar experimental conditions.2.5. Physicochemical and electrochemical characterizations
The physicochemical characterizations were done by using FTIR, HRTEM and EDX analysis. The prepared graphene oxide and poly(SDP/CP/BZ) materials have been examined by Fourier transform infrared (FTIR, Thermo Nicolet Model: 6700) spectroscopy. The Raman spectra of graphite powder and graphene oxide are recorded using 1064 nm line of Nd:YAG laser as the excitation wavelength in the region 500–2500 cm−1 on a Thermo Electron corporation model Nexus 670 spectrophotometer. X-ray diffraction patterns were measured at 25 °C temperature by examining the diffraction angle 2θ from 0 to 10° as the standard on a Rich Seifert (Model 3000) X-ray powder diffractometer. The surface morphology, size of platinum and platinum–copper nanoparticles deposited on poly(SDP/CP/BZ)–GO composite are analyzed by high resolution transmission electron microscope (HR-TEM, JEOL) with an accelerating voltage of 120 kV. Energy dispersive X-ray analysis (EDX, INCA200) substantiates the presence of platinum and platinum–copper nanoparticles on poly(SDP/CP/BZ)–GO composite.2.6. Electrochemical characterizations
Multichannel electrochemical workstation with inbuilt FRA system (Biologic SAS, Model VSP2) was used for electrochemical characterizations with a standard three-electrode glass cell equipped with novel modified graphite electrodes as working, saturated calomel electrode as reference and a platinum wire as counter electrodes. Further, the electrocatalytic activity of alcohol (methanol and ethylene glycol) oxidation has been investigated in 0.5 M KOH and 0.5 M alcohol solution with a potential range of −1.0 to 0.3 V at a scan rate of 20, 50 and 100 mV s−1. Chronoamperometric analysis was also done in 0.5 M KOH and 0.5 M alcohol solution at its maximum peak current potential. The CO stripping testing was carried out by holding the working electrode in the carbon monoxide saturated KOH solution (0.5 M) for 500 s, and then the working electrode is placed in the nitrogen gas purged 0.5 M KOH solution to record the CO stripping profiles. The intermediate products formed upon electrooxidation of ethylene glycol were determined by using high-performance liquid chromatography (Dionex system P680 HPLC). It works with an isocratic elution and mainly includes an autosampler (ASI 100 Automated Sample Injector), a sample loop (20 μL), and an ion-exclusion column (Aminex HPX-87H), which are operated at room temperature. The analytes were separated with diluted KOH (3.3 mmol L−1, Merck 96%) used as a eluent with 0.6 mL min−1 run rate. The chromatograph was equipped with an UV-Vis detector (λ = 210 nm) followed by a refractive index detector (IOTA2).2.7. Procedure for the construction of single stack test fuel cell
Direct alcohol alkaline fuel cell was prepared by utilizing anion exchange membrane (AEM) (thickness: 28 μm, IEC: 1.9 mmol g−1, Tokuyama Co.). 5 mg of electrode catalyst was dispersed in a mixture 1![[thin space (1/6-em)]](https://www.rsc.org/images/entities/char_2009.gif) :
:![[thin space (1/6-em)]](https://www.rsc.org/images/entities/char_2009.gif) 1 (v/v) ratio of 2-ethoxyethanol and anion exchange ionomer (Tokuyama Co.), and then stirred to form homogeneous slurry. Catalyst (2.5 mg) was coated on carbon paper by brush coating method. The sandwiched layer like structure of the anode and cathode on both the sides of anion exchange membrane was obtained by hot-pressing (120 °C, 2 MPa for 10 min) method. The prepared sandwich type of anode and cathode layers were placed between two copper meshes as current collector. The alcohols (methanol and ethylene glycol) were purged in the inlet at anode side. The fuel diffused into the anode catalyst layer from the tank through the anode current collectors, while oxygen transferred into the cathode catalyst layer from the surrounding air through the cathode current collectors by natural convection. The I–V curve measurements were performed with a galvanostat (Hokuto Denko, HA-501G). Each measurement was started after the fuel was poured in the cell for 30 min. The cell voltage was recorded after setting up the current for 3 min to stabilize the voltage. The single direct alcohol alkaline fuel cell operated at different concentration and temperature for the optimization process.
1 (v/v) ratio of 2-ethoxyethanol and anion exchange ionomer (Tokuyama Co.), and then stirred to form homogeneous slurry. Catalyst (2.5 mg) was coated on carbon paper by brush coating method. The sandwiched layer like structure of the anode and cathode on both the sides of anion exchange membrane was obtained by hot-pressing (120 °C, 2 MPa for 10 min) method. The prepared sandwich type of anode and cathode layers were placed between two copper meshes as current collector. The alcohols (methanol and ethylene glycol) were purged in the inlet at anode side. The fuel diffused into the anode catalyst layer from the tank through the anode current collectors, while oxygen transferred into the cathode catalyst layer from the surrounding air through the cathode current collectors by natural convection. The I–V curve measurements were performed with a galvanostat (Hokuto Denko, HA-501G). Each measurement was started after the fuel was poured in the cell for 30 min. The cell voltage was recorded after setting up the current for 3 min to stabilize the voltage. The single direct alcohol alkaline fuel cell operated at different concentration and temperature for the optimization process.
3. Results and discussions
3.1. FT-IR and FT-Raman spectroscopy
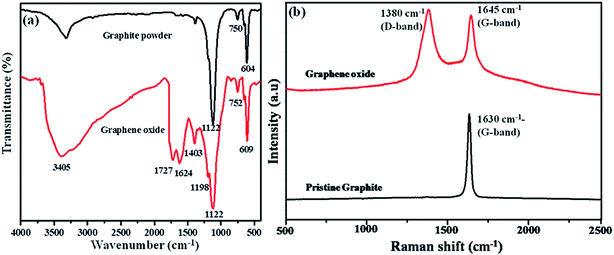
Graphite and graphene oxide materials were characterized by FTIR and Raman analyses to confirm their respective structures. Fig. 1(a) displays the FTIR spectra of graphite and graphene oxide materials. The peaks appeared at 3405 and 1403 cm−1 are corresponding to the O–H stretching and bending vibration present in graphene oxide. The C![[double bond, length as m-dash]](https://www.rsc.org/images/entities/char_e001.gif) O stretching vibration of –COOH groups present in the graphene oxide sheets is observed at 1727 cm−1 (ref. 20) and the C
O stretching vibration of –COOH groups present in the graphene oxide sheets is observed at 1727 cm−1 (ref. 20) and the C![[double bond, length as m-dash]](https://www.rsc.org/images/entities/char_e001.gif) O stretching of hydrogen bonded carboxylic group has appeared at 1624 cm−1. The characteristic peaks corresponding to the functional groups of graphene oxide were absent in the case of graphite powder, which infers the conversion of graphite powder into graphene oxide material.
O stretching of hydrogen bonded carboxylic group has appeared at 1624 cm−1. The characteristic peaks corresponding to the functional groups of graphene oxide were absent in the case of graphite powder, which infers the conversion of graphite powder into graphene oxide material.
Raman spectroscopy is an effective, non-destructive and well know tool to find the structural characteristics and quality of graphene based materials. So, the Raman spectra were carried out for graphite and graphene oxide materials (Fig. 1(b)). The Raman spectrum of graphite powder shows a single sharp G band at 1630 cm−1, which is corresponding to the vibration of sp2 carbon. The graphene oxide shows two peaks at 1645 and 1380 cm−1 are known as the G band (growth band) and D band (disordered band), respectively. The broad and intense D-band appeared at 1380 cm−1 is corresponding to sp3 hybridized carbon atoms, which are confirming the graphene oxide conversion from graphite material. Further, the shift in the G band (growth band) is observed for graphene oxide, which might be due to the reduction in size and in-plane sp2 domains due to extensive oxidation. This indicates the defects within the graphitic sheets and edges.21,22 The G band arises due to the hexagonal lattice vibrations of GO, which is the characteristic of graphene “honeycomb” structure of GO.
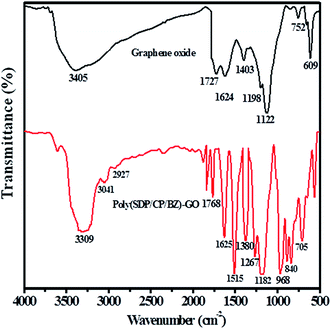
Fig. 2 shows the FTIR spectra of graphene oxide and poly(SDP/CP/BZ)–GO composite. The FTIR spectrum of poly(SDP/CP/BZ)–GO has the characteristic bands at 3309 and 840 cm−1 for –N–H stretching and wagging vibrations, respectively. The peak corresponding to C![[double bond, length as m-dash]](https://www.rsc.org/images/entities/char_e001.gif) O stretching of carboxylic group is observed at 1768 cm−1.
O stretching of carboxylic group is observed at 1768 cm−1.
The shift in the peak position from 1727 to 1768 cm−1 for C![[double bond, length as m-dash]](https://www.rsc.org/images/entities/char_e001.gif) O stretching of carboxylic group as in the case of poly(SDP/CP/BZ)–GO composite when compared to GO material indicates the chemical interaction between the polymer and GO material. The stretching and bending vibrations of O–H in GO spectrum at 3405 and 1403 cm−1 were disappeared as in the case of poly(SDP/CP/BZ)–GO composite, which confirms the chemical bonding between the polymer and GO material. The O
O stretching of carboxylic group as in the case of poly(SDP/CP/BZ)–GO composite when compared to GO material indicates the chemical interaction between the polymer and GO material. The stretching and bending vibrations of O–H in GO spectrum at 3405 and 1403 cm−1 were disappeared as in the case of poly(SDP/CP/BZ)–GO composite, which confirms the chemical bonding between the polymer and GO material. The O![[double bond, length as m-dash]](https://www.rsc.org/images/entities/char_e001.gif) S
S![[double bond, length as m-dash]](https://www.rsc.org/images/entities/char_e001.gif) O stretching vibration was appeared at 1380 cm−1 indicates the presence of sulfonyldiphenol on poly(SDP/CP/BZ)–GO material. The characteristic peaks observed at 1268 and 968 cm−1 confirm the presence of P–O–C and P–N–C bond in poly(SDP/CP/BZ)–GO material. Further, the aromatic –C–H stretching vibration was observed at 3043 cm−1. Thus, the above discussions confirm that the poly(SDP/CP/BZ)–GO is composed of 4,4′-sulfonyldiphenol (SDP), cyclophosphazene (CP), benzidine and GO materials.
O stretching vibration was appeared at 1380 cm−1 indicates the presence of sulfonyldiphenol on poly(SDP/CP/BZ)–GO material. The characteristic peaks observed at 1268 and 968 cm−1 confirm the presence of P–O–C and P–N–C bond in poly(SDP/CP/BZ)–GO material. Further, the aromatic –C–H stretching vibration was observed at 3043 cm−1. Thus, the above discussions confirm that the poly(SDP/CP/BZ)–GO is composed of 4,4′-sulfonyldiphenol (SDP), cyclophosphazene (CP), benzidine and GO materials.
3.2. High resolution transmission electron microscope and energy dispersive X-ray analysis
The size distribution, shape and surface morphology of the platinum and platinum–copper nanoparticles present on poly(SDP/CP/BZ)–GO composite was analyzed by HRTEM measurements. Fig. 3(a and b) shows the TEM photos of Pt/poly(SDP/CP/BZ)–GO and Pt–Cu/poly(SDP/CP/BZ)–GO catalysts. The TEM photos (Fig. 3(a and b)) confirm the uniform deposited of platinum and platinum–copper nanoparticles on the surface of the poly(SDP/CP/BZ)–GO. The uniform size and homogeneous distribution of metal nanoparticles on poly(SDP/CP/BZ)–GO composite surface might be due to the presence of multiple functional groups such as –NH, P![[double bond, length as m-dash]](https://www.rsc.org/images/entities/char_e001.gif) N–, –C
N–, –C![[double bond, length as m-dash]](https://www.rsc.org/images/entities/char_e001.gif) O and S
O and S![[double bond, length as m-dash]](https://www.rsc.org/images/entities/char_e001.gif) O on poly(SDP/CP/BZ)–GO surface, which are acting as a good anchoring site for metal nanoparticles deposition. In addition to that the poly(SDP/CP/BZ)–GO composite will favor good dispersion of Pt and Pt–Cu nanoparticles with an average particle size of 2.8 and 2.2 nm, respectively.
O on poly(SDP/CP/BZ)–GO surface, which are acting as a good anchoring site for metal nanoparticles deposition. In addition to that the poly(SDP/CP/BZ)–GO composite will favor good dispersion of Pt and Pt–Cu nanoparticles with an average particle size of 2.8 and 2.2 nm, respectively.
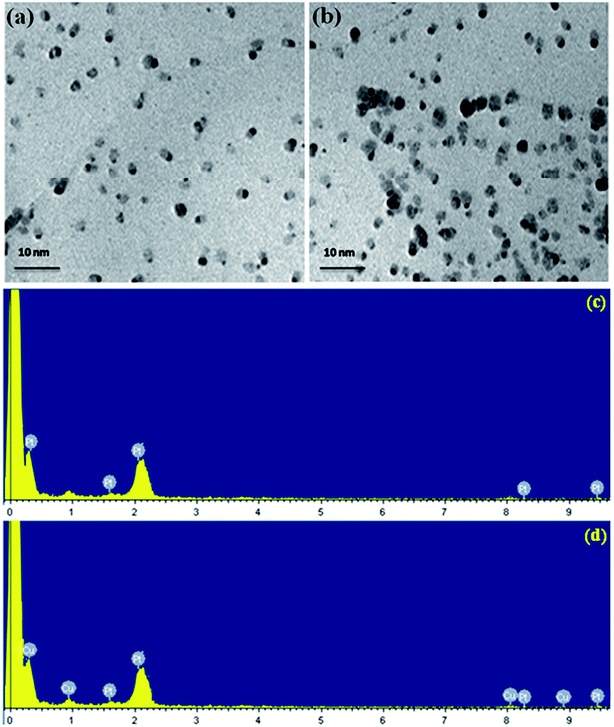 | ||
| Fig. 3 HRTEM pictures of (a) Pt (b) Pt–Cu decorated poly(SDP/CP/BZ)–GO and EDX spectra of (c) Pt (d) Pt–Cu decorated poly(SDP/CP/BZ)–GO catalysts. | ||
Further, the EDX spectra of Pt/poly(SDP/CP/BZ)–GO and Pt–Cu/poly(SDP/CP/BZ)–GO catalysts confirm the presence of platinum and platinum–copper nanoparticles on the poly(SDP/CP/BZ)–GO composite (Fig. 3(c and d) and Table 1). The EDX spectra result also confirms that the composition of Pt and Cu are nearly 1![[thin space (1/6-em)]](https://www.rsc.org/images/entities/char_2009.gif) :
:![[thin space (1/6-em)]](https://www.rsc.org/images/entities/char_2009.gif) 1 ratio, which is good agreement with the calculated theoretical values.
1 ratio, which is good agreement with the calculated theoretical values.
| Catalysts | Weight composition% | Atomic composition% |
|---|---|---|
| Pt100 | 100 | 100 |
| Pt50–Cu50 | 51![[thin space (1/6-em)]](https://www.rsc.org/images/entities/char_2009.gif) : :![[thin space (1/6-em)]](https://www.rsc.org/images/entities/char_2009.gif) 49 49 |
50![[thin space (1/6-em)]](https://www.rsc.org/images/entities/char_2009.gif) : :![[thin space (1/6-em)]](https://www.rsc.org/images/entities/char_2009.gif) 50 50 |
3.3. Cyclic voltammetry analysis
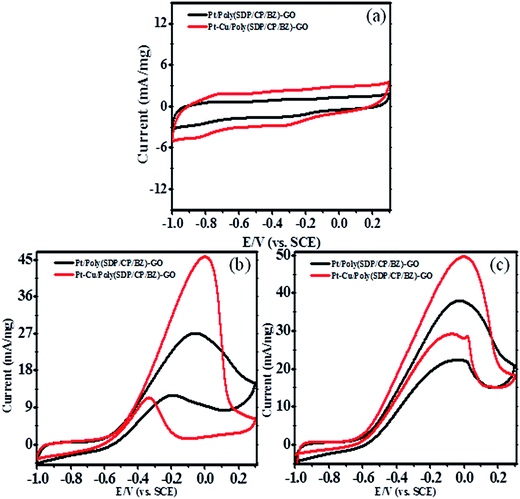 | ||
| Fig. 4 Cyclic voltammograms of Pt and Pt–Cu decorated poly(SDP/CP/BZ)–GO electrode in (a) 0.5 M KOH (b) 0.5 M KOH + 0.5 M methanol and (c) 0.5 M KOH + 0.5 M ethylene glycol at scan rate 50 mV s−1. | ||
| Catalyst | Current (mA mg−1) | |
|---|---|---|
| Methanol | Ethylene glycol | |
| Pt/GO | 10.50 | 12.83 |
| Pt/poly(SDP/CP/BZ) | 13.21 | 16.49 |
| Pt/poly(SDP/CP/BZ)–GO | 27.24 | 37.99 |
| Pt–Cu/poly(SDP/CP/BZ)–GO | 45.03 | 49.60 |
The enhanced electrocatalytic performance of Pt/poly(SDP/CP/BZ)–GO catalyst might be due to (i) the introduction of poly(SDP/CP/BZ) polymer on graphene oxide with multi functional groups such as –OH, –NH and S![[double bond, length as m-dash]](https://www.rsc.org/images/entities/char_e001.gif) O groups, which are helping to get the uniform size distribution of nanoparticles with reduced aggregations. Their results generate more active sites for adsorption of alcohols (methanol and ethylene glycol) towards electrochemical oxidation, (ii) poly(SDP/CP/BZ) present in Pt/poly(SDP/CP/BZ)–GO can prevent the agglomeration of graphene oxide as well as metal nanoparticles, which bring homogeneous coexistence between the nanoparticles and (iii) the electron transfer efficiency through an interfacial interaction between metal nanoparticles and poly(SDP/CP/BZ)–GO composite.
O groups, which are helping to get the uniform size distribution of nanoparticles with reduced aggregations. Their results generate more active sites for adsorption of alcohols (methanol and ethylene glycol) towards electrochemical oxidation, (ii) poly(SDP/CP/BZ) present in Pt/poly(SDP/CP/BZ)–GO can prevent the agglomeration of graphene oxide as well as metal nanoparticles, which bring homogeneous coexistence between the nanoparticles and (iii) the electron transfer efficiency through an interfacial interaction between metal nanoparticles and poly(SDP/CP/BZ)–GO composite.
Further, to reduce the cost of the electrode material without compromising the catalytic activity, the non precious metal was doped with platinum metal. This is not only reducing the cost, but also enhances the catalytic activity. For this case, the copper (Cu) was doped along with platinum on poly(SDP/CP/BZ)–GO composite as supporting through in situ reduction method to form Pt–Cu/poly(SDP/CP/BZ)–GO bimetallic system. The resultant Pt–Cu/poly(SDP/CP/BZ)–GO catalyst was subjected to methanol and ethylene glycol oxidation in alkaline medium. The cyclic voltammograms of Pt–Cu/poly(SDP/CP/BZ)–GO catalyst for methanol and ethylene glycol in 0.5 M KOH solution at a scan rate of 50 mV s−1 were shown in Fig. 4.
Pt–Cu/poly(SDP/CP/BZ)–GO catalyst shows significantly enhance oxidation current of 45.03 and 49.60 mA mg−1 for methanol and ethylene glycol oxidation, respectively. From the results (Table 2), it was concluded that Pt–Cu/poly(SDP/CP/BZ)–GO catalyst shows considerably greater oxidation peak current than that of Pt/poly(SDP/CP/BZ)–GO catalyst. The enhanced electrocatalytic activity of Pt–Cu/poly(SDP/CP/BZ)–GO may be stimulated due to the changes in the geometric and electronic structure of the Pt nanoparticles with the introduction of second metal like copper, chemical interaction between poly(SDP/CP/BZ) and GO present in poly(SDP/CP/BZ)–GO composite and the synergy effect between the metal nanoparticles and poly(SDP/CP/BZ)–GO composite. In addition to that the copper is more electronegative metal than the platinum, so the interaction between platinum and copper present in the Pt–Cu/poly(SDP/CP/BZ)–GO catalyst may change the distribution of electrons in platinum. This effect is making more capable and possibilities for the adsorption of alcohols such as methanol and ethylene glycol on platinum surfaces. Hence, this phenomenon stimulates to increases the adsorption and the electrooxidation rate of methanol and ethylene glycol, etc.
Further, the enhanced electrooxidation of methanol and ethylene glycol can be explained based on their intermediate formation during the oxidation process as given below.
(i) Methanol. The formation of HCOO− ion and ‘CO’ species formed during the electrooxidation of methanol,
| Pt + CH3OH + 4OH− → Pt–CO + 4H2O + 4e− | (1) |
| Pt–CO + Pt–OH → CO2 + 2Pt + H+ | (2) |
| Pt + CH3OH + 5OH− → Pt–OOCH + 4H2O + 4e− | (3) |
| Pt–OOCH + Pt–OH → 2Pt + CO2 + H2O + 2e− | (4) |
Hence, still there is possible to ‘CO’ poisonous species which is unavoidable in the presence of platinum metal, though enhanced oxidation current is observed as in the case of Pt/poly(SDP/CP/BZ)–GO, when compared to Pt/GO and Pt/poly(SDP/CP/BZ) catalysts.
According to the above proposed mechanism, major intermediate formed is HCOO− and ‘CO’ poison during electrooxidation of methanol. Copper in Pt–Cu/poly(SDP/CP/BZ)–GO catalyst will assist the catalyst to undergo through the ‘HCOO−’ ion formation and it also assist to remove the HCOO− formed during electrooxidation of methanol. In general, the electrooxidation of small organic compounds on metal electrodes occur in the presence of reactive M(OH)ads species formed by hydroxyl adsorption on the electrode surfaces. Hence, the easily formed Cu–OHads (at lower potential when compared to Pt) can readily oxidize the Pt–(HCOO)ads to CO2, which can increase the availability of active Pt sites for the adsorption and electrooxidation of methanol (as given below).
 | (5) |
 | (6) |
The rate of reactions in accordance with the eqn (5) and (6) are higher than that of the reaction occurring in accordance with the eqn (2), which results enhanced catalytic activity in the presence of ‘Cu’ nanoparticles on Pt/poly(SDP/CP/BZ)–GO catalyst.
(ii) Ethylene glycol oxidation. Ethylene glycol produces formic acid as a major intermediate along with other byproducts such as glyoxal, glycolic acid, glyoxylic acid and oxalic acid during the electrooxidation process.23
According to the above proposed mechanism, the major product formed during ethylene glycol oxidation is HCOOH, which can be easily removed by the adding copper as second metal to Pt/poly(SDP/CP/BZ)–GO catalyst. The addition of copper could increase the catalytic activity by adsorbing the OH− ions in the electrolyte solution (KOH) at lower potential comparable to that of platinum. Hence, copper as co-catalyst will help to remove the intermediate product like formic acid or CO or some other intermediates formed during electrooxidation of ethylene glycol.
In addition to that the electrooxidation small organic molecule/intermediates formed during the electrooxidation of alcohols on metal electrodes occurs in the presence of reactive M(OH)ads species formed through hydroxyl group adsorption on the electrode surfaces. Hence, the formed Cu–OHads can readily oxidize the Pt–(HCOO)ads to CO2 compared to that of Pt–OHads. In this regard, the copper nanoparticles in Pt–Cu/poly(SDP/CP/BZ)–GO catalyst could enhance the regeneration of poisoned platinum, which is more reactive towards intermediate products.24–27
Hence, the copper particles can increase the availability of more numbers of active Pt sites for the adsorption and electrooxidation of ethylene glycol. The rate of oxidation of the intermediate product proceeding through eqn (8) is always higher than that of the oxidation proceeding through the eqn (7), which might be due to the easy formation of Cu–OH species at lower potential when compared to Pt–OH species.
 | (7) |
 | (8) |
The above results conclude that the Pt–Cu/poly(SDP/CP/BZ)–GO catalyst shows better catalytic activity through bi-functional effect than that of Pt/poly(SDP/CP/BZ)–GO catalyst. In addition to that Pt/poly(SDP/CP/BZ)–GO and Pt–Cu/poly(SDP/CP/BZ)–GO catalysts show better catalytic activity than that of the Pt/GO and Pt/poly(SDP/CP/BZ) catalyst. So, poly(SDP/CP/BZ)–GO composite is a potent and good supporting material with enhanced activities for fuel cell applications.
Overall, the oxidation current density of ethylene glycol is found to be higher than that of the oxidation current density of methanol, which may be the nature of byproduct formed during the electrooxidation of methanol. But, the ethylene glycol oxidation produces various intermediates such as glyoxal, glycolic acid, glyoxylic acid, oxalic acid and formic acid in alkaline solution (Fig. 7). Further, most of the C–C bond cleavage in ethylene glycol takes place at higher potential, which will prevent the CO poisoning of platinum. However, the methanol cleavage mostly takes place at lower potential and hence the oxidation of ‘CO’ poison may not possible at a lower potential, which will decrease the active surface area that are essential for the adsorption and oxidation of methanol. Hence, the prepared catalysts show higher oxidation current density for ethylene glycol when compared to methanol.
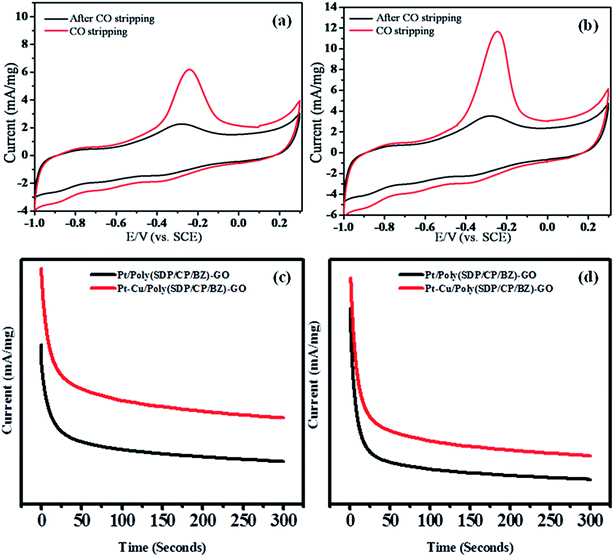
The stability with respect to time and reproducibility related to activities of Pt/poly(SDP/CP/BZ)–GO and Pt–Cu/poly(SDP/CP/BZ)–GO catalysts in methanol and ethylene glycol oxidation were determined by chronoamperometry analysis. The chronoamperometry analysis results of Pt/poly(SDP/CP/BZ)–GO and Pt–Cu/poly(SDP/CP/BZ)–GO catalysts in 0.5 M KOH + 0.5 M methanol and 0.5 M KOH + 0.5 M ethylene glycol solutions were shown in Fig. 5(c and d). The current density decreases rapidly for both the catalysts at the initial stage, which may be due to the formation of the intermediate carbonaceous species during methanol and ethylene glycol oxidation reaction.28 The steady state current observed for the as prepared catalysts clearly confirms the relative stability, reproducibility and higher catalytic activity of Pt–Cu/poly(SDP/CP/BZ)–GO catalyst.
From the overall electrooxidation analysis, it was observed that the Pt–Cu/poly(SDP/CP/BZ)–GO catalyst exhibits higher catalytic activity when compared to Pt–Cu/poly(SDP/CP/BZ)–GO. So, it has been nominated as the electrode material for the construction of single stack test fuel cell for its power generation performance.
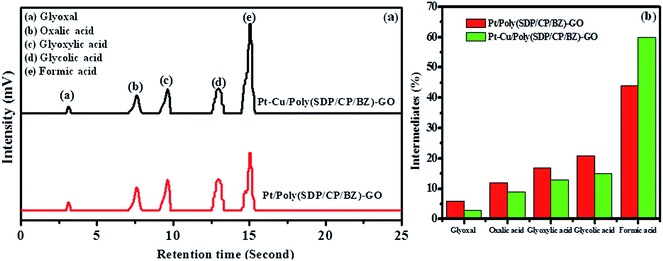
The Fig. 6 shows five intermediate peaks, which are corresponding to glyoxal, oxalic acid, glyoxylic acid, glycolic acid and formic acid formed during ethylene glycol oxidation. At first, the ethylene glycol oxidized to give five intermediates such as glyoxal, oxalic acid, glyoxylic acid, glycolic acid and formic acid. The intermediates like glyoxal, oxalic acid, glyoxylic acid and glycolic acid are further oxidized and they undergo cleavage of C–C bond to produce CO2. In the same way, the formic acid oxidized to give CO2. Hence, the above discussion gives clear information regarding the intermediate products formed during the ethylene glycol oxidation.
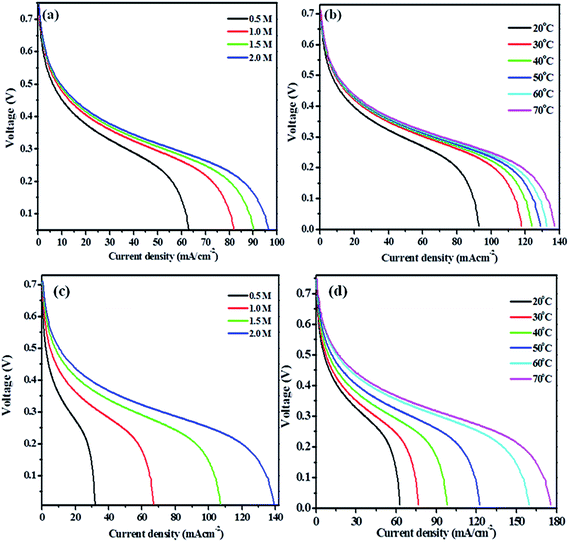
For methanol fuel, the current density increases with increasing the methanol concentration up to 4.5 M methanol solution in 1 M KOH solutions and further increase in the concentration of fuel shows no significant changes in the current densities. So, the maximum current density noticed for methanol solution was 97 mA cm−2 (Fig. 7(a)). The large increase in the current densities was noticed up to 2.0 M methanol solution, which may be taken as an optimum concentration of methanol. Hence, the effect of temperature in 2.0 M methanol + 1.0 M KOH solution is carried out at different temperature ranging from 20, 30, 40, 50, 60, 70 and 80 °C (Fig. 7(b)). The effect of temperature results concludes that the maximum current density obtained is 137 mA cm−2 at 70 °C.
For ethylene glycol fuel, the current density increases up to 2.5 M ethylene glycol in 1.0 M KOH solution. However, the significant increase in current density was noticed upto 2.0 M though an increase in current density was observed upto 2.5 M ethylene glycol. So, the optimum concentration of the ethylene glycol is taken as 2.0 M in 1.0 M KOH solution since the uniform or significant increase in the current density is observed up to 2.0 M (Fig. 7(c)). The current density was increased up to 80 °C, though the current density is increased dramatically at 70 °C (Fig. 7(d)). So, the optimum temperature is taken as 70 °C for Pt–Cu/poly(SDP/CP/BZ)–GO electrode for ethylene glycol (2.0 M) in 1.0 M KOH solution.
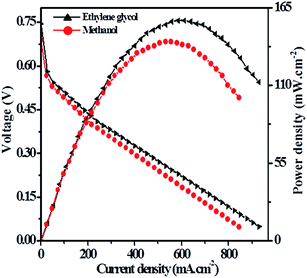
Hence, the direct alkaline alcohol test fuel cell is compared using the concentration of 2.0 M alcohol fuels in 1.0 M KOH solution at a constant temperature of 70 °C on Pt–Cu/poly(SDP/CP/BZ)–GO catalyst as electrode material. The performance of Pt–Cu/poly(SDP/CP/BZ)–GO electrode in single stack fuel cell with respect to the current density, power density and voltage relationship under optimum temperature (70 °C) and alcohol concentration (2.0 M) were shown in Fig. 8. From the Fig. 8, the maximum power densities of 112.24 and 140.67 mW cm−2 were noticed for methanol and ethylene glycol fuels, respectively. Further, the observed power density of the Pt–Cu/poly(SDP/CP/BZ)–GO catalysts are found to be higher than that of the literature data.29–53 From the overall studies, it was concluded that the prepared Pt–Cu/poly(SDP/CP/BZ)–GO catalyst is a potent electrode for direct alkaline alcohol fuel cells.
4. Conclusion
In the present investigation, poly(SDP/CP/BZ)–GO composite as supporting material was prepared for the electrooxidation of methanol and ethylene glycol in favor of fuel cell applications. For this application, platinum and platinum–copper nanoparticles were loaded on the novel poly(SDP/CP/BZ)–GO composite material. The resulted catalysts were subjected to electrooxidation of alcohols and CO tolerance studies to confirm their performance for fuel cell applications. The bimetallic Pt–Cu nanoparticles loaded poly(SDP/CP/BZ)–GO exhibits good CO tolerance and higher electrocatalytic activities of alcohols than that of platinum loaded poly(SDP/CP/BZ)–GO composite. Hence, the better performed novel Pt–Cu/poly(SDP/CP/BZ)–GO material was used for fuel cell construction. The single stack direct alkaline alcohol test fuel cell with an active surface area of 6.25 cm2 shows the maximum power density of 112.24 and 140.67 mW cm−2 for methanol and ethylene glycol fuels, respectively.Acknowledgements
The authors like to thank DST/Nanomission, New Delhi, India for the financial support to carry out this work and the establishment of Nanotech Research Lab through the grant No. SR/NM/NS-05/2011(G).References
- H. Vaghari, H. Jafarizadeh-Malmiri, A. Berenjian and N. Anarjan, Sustainable Chem. Processes, 2013, 1, 16 CrossRef.
- E. Antolini and E. R. Gonzalez, J. Power Sources, 2010, 195, 3431–3450 CrossRef CAS.
- K. Matsuoka, Y. Iriyama, T. Abe, M. Matsuoka and Z. Ogumi, J. Power Sources, 2005, 150, 27–31 CrossRef CAS.
- H. A. Miller, F. Vizza and A. Lavacchi, Nanostruct. Sci. Technol., 2016, 477–516 Search PubMed.
- K. I. Ozoemena, RSC Adv., 2016, 6, 89523–89550 RSC.
- M. Ando, T. Kobayashi, S. Iijima and M. Haruta, J. Mater. Chem., 1997, 7, 1779–1783 RSC.
- L. Pan, H. Zhao, W. Shen, X. Dong and J. Xu, J. Mater. Chem. A, 2013, 1, 7159 CAS.
- S. Park, S. J. Park and S. Kim, Bull. Korean Chem. Soc., 2012, 33, 4247–4250 CrossRef CAS.
- M. M. Shahid, A. Pandikumar, A. M. Golsheikh, N. M. Huang and H. N. Lim, RSC Adv., 2014, 4, 62793–62801 RSC.
- A. A. Navaee and A. Salimi, Electrochim. Acta, 2016, 211, 322–330 CrossRef CAS.
- Y. H. Kwok, A. C. H. Tsang, Y. Wang and D. Y. C. Leung, J. Power Sources, 2017, 349, 75–83 CrossRef CAS.
- D. Dong Liu, L. Li and T. You, J. Colloid Interface Sci., 2017, 487, 330–335 CrossRef PubMed.
- K. Kakaei, Electrochim. Acta, 2015, 165, 330–337 CrossRef CAS.
- H. Ashassi-Sorkhabi, B. R. Moghadam, E. Asghari, R. Bagheri and R. Kabiri, J. Taiwan Inst. Chem. Eng., 2016, 69, 118–130 CrossRef CAS.
- Z. Bai, L. Niu, Q. Zhang, H. Feng, L. Yang, Z. Yang and Z. Chen, Int. J. Hydrogen Energy, 2015, 40, 14305–14313 CrossRef CAS.
- C.-S. Liu, X.-C. Liu, G.-C. Wang, Ru-P. Liang and J.-D. Qiu, J. Electroanal. Chem., 2014, 728, 41–50 CrossRef CAS.
- H. R. Allcock, J. Mater. Chem., 1994, 6, 1476–1491 CrossRef CAS.
- Z. Q. Yao, M. S. Zhu, F. X. Jiang, Y. K. Du, C. Y. Wang and P. Yang, J. Mater. Chem., 2012, 22, 13707–13713 RSC.
- D. Li, M. B. Muller, S. Gilje, R. B. Kaner and G. Wallace, Nat. Nanotechnol., 2008, 3, 101–105 CrossRef CAS PubMed.
- W. H. Zhang, G. Zhang and X. Y. Wei, Appl. Catal., A, 2016, 509, 111–117 CrossRef CAS.
- F. Tuinstra and J. L. Koenig, J. Chem. Phys., 1970, 53, 1126 CrossRef CAS.
- D. Graf, F. Molitor, K. Ensslin, C. Stampfer, A. Jungen, C. Hierold and L. Wirtz, Nano Lett., 2007, 7, 238 CrossRef CAS PubMed.
- H. J. Kim, S. M. Choi, S. Green, G. A. Tompsett, S. H. Lee, G. W. Huber and W. B. Kim, Appl. Catal., B, 2011, 101, 366–375 CrossRef CAS.
- B. Beden, F. Kadirgan, C. Lamy and J. M. Leger, J. Electroanal. Chem., 1982, 142, 171–190 CrossRef CAS.
- J. Prabhuram and R. Manoharan, J. Power Sources, 1998, 74, 54–61 CrossRef CAS.
- A. V. Tripkovi, K. Dj. Popović, J. D. Momčilović and D. M. Draić, J. Electroanal. Chem., 1996, 418, 9–20 CrossRef.
- X.-Z. Fu, Y. Liang, S.-P. Chen, J.-D. Lin and D.-W. Liao, Catal. Commun., 2009, 10, 1893–1897 CrossRef CAS.
- R. T. S. Oliveira, M. C. Santos, P. A. P. Nascente, L. O. S. Bulhões and E. C. Pereira, Int. J. Electrochem. Sci., 2008, 3, 970–979 CAS.
- Y. Fang, T. Wang, R. Miao, L. Tang and X. Wang, Electrochim. Acta, 2010, 55, 2404–2408 CrossRef CAS.
- Y. C. Park, S. H. Lee, S. K. Kim, S. Lim, D. H. Jung, D. Y. Lee, S. Y. Choi, H. Ji and D. H. Peck, Int. J. Hydrogen Energy, 2010, 35, 4320–4328 CrossRef CAS.
- C. C. Yang, W. C. Chien and Y. J. Li, J. Power Sources, 2010, 195, 3407–3415 CrossRef CAS.
- C. C. Yang, S. J. Chiu, W. C. Chien and S. S. Chiu, J. Power Sources, 2010, 195, 2212–2219 CrossRef CAS.
- C. Xu, A. Faghri, X. Li and T. Ward, Int. J. Hydrogen Energy, 2010, 35, 1769–1777 CrossRef CAS.
- L. Feng, J. Zhang, W. Cai, L. Liang, W. Xing and C. Liu, J. Power Sources, 2011, 196, 2750–2753 CrossRef CAS.
- Y. J. Chiu, T. L. Yu and Y. C. Chung, J. Power Sources, 2011, 196, 5053–5063 CrossRef CAS.
- A. H. Haghighi, M. M. Hasani-Sadrabadi, E. Dashtimoghadam, Gh. Bahlakeh, S. E. Shakeri, F. S. Majedi, S. H. Emami and H. Moaddel, Int. J. Hydrogen Energy, 2011, 36, 3688–3696 CrossRef CAS.
- J. C. Tsai and C. K. Lin, J. Power Sources, 2011, 196, 9308–9316 CrossRef CAS.
- F. Lufrano, V. Baglio, O. Di Blasi, P. Staiti, V. Antonucci and A. S. Aricò, Phys. Chem. Chem. Phys., 2012, 14, 2718–2726 RSC.
- J. Y. Park, Y. Seo, S. Kang, D. You, H. Cho and Y. Na, Int. J. Hydrogen Energy, 2012, 37, 5946–5957 CrossRef CAS.
- R. Padmavathi, R. Karthikumar and D. Sangeetha, Electrochim. Acta, 2012, 71, 283–293 CrossRef CAS.
- T. Zhou, J. Zhang, J. Qiao, L. Liu, G. Jiang, J. Zhang and Y. Liu, J. Power Sources, 2013, 227, 291–299 CrossRef CAS.
- Y.-S. Ye, M.-Y. Cheng, X.-L. Xie, J. Rick, Y.-J. Huang and F.-C. Chang, J. Power Sources, 2013, 239, 424–432 CrossRef CAS.
- J.-F. Wu, C.-F. Lo, L.-Y. Li, H.-Y. Li, C.-M. Chang, K.-S. Liao, C.-C. Hu, Y.-L. Liu and S. J. Lue, J. Power Sources, 2014, 246, 39–48 CrossRef CAS.
- X. Yan, S. Gu, G. He, X. Wu and J. Benziger, J. Power Sources, 2014, 250, 90–97 CrossRef CAS.
- I. Kruusenberg, S. Ratso, M. Vikkisk, P. Kanninen, T. Kallio, A. M. Kannan and K. Tammeveski, J. Power Sources, 2015, 281, 94–102 CrossRef CAS.
- Y. Li, C. Liu, Y. Liu, B. Feng, L. Li, H. Pan, W. Kellogg, D. Higgins and G. Wu, J. Power Sources, 2015, 286, 354–361 CrossRef CAS.
- L. Demarconnay, S. Brimaud, C. Coutanceau and J. M. Léger, J. Electroanal. Chem., 2007, 601, 169–180 CrossRef CAS.
- A. Marchionni, M. Bevilacqua, C. Bianchini, Y. X. Chen, J. Filippi, P. Fornasiero, A. Lavacchi, H. Miller, L. Q. Wang and F. Vizza, ChemSusChem, 2013, 6, 518–528 CrossRef CAS PubMed.
- L. Xin, Z. Y. Zhang, J. Qi, D. Chadderdon and W. Z. Li, Appl. Catal., B, 2012, 125, 85–94 CrossRef CAS.
- K. Matsuoka, Y. Iriyama, T. Abe, M. Matsuoka and Z. Ogumi, J. Power Sources, 2005, 150, 27–31 CrossRef CAS.
- L. An, L. Zeng and T. S. Zhao, Int. J. Hydrogen Energy, 2013, 38, 10602–10606 CrossRef CAS.
- J. R. Varcoe, R. C. T. Slade, E. L. H. Yee, S. D. Poynton and D. J. Driscoll, J. Power Sources, 2007, 173, 194–199 CrossRef CAS.
- F. Munoz, C. Hua, T. Kwong, L. Tran, T. Q. Nguyen and J. L. Haan, Appl. Catal., B, 2015, 174–175, 323–328 CrossRef CAS.
| This journal is © The Royal Society of Chemistry 2017 |

