 Open Access Article
An aptasensor with dsDNA for rapid and highly sensitive detection of kanamycin in milk†
Falan Li a,
Xiangyou Wang
 *ab,
Xia Sun*b and
Yemin Guob
aSchool of Engineering, Northeast Agricultural University, No. 59 Mucai Street Xiangfang Distrct, Harbin 150000, Heilongjiang Province, P. R. China
bSchool of Agriculture and Food Engineering, Shandong University of Technology, No. 12 Zhangzhou Road, Zibo 255049, Shandong Province, P. R. China. E-mail: wxy@sdut.edu.cn; sunxia2151@sina.com; Fax: +86 533 2780897; Tel: +86 533 2780897
First published on 9th August 2017
Abstract
Herein, we developed an aptasensor using double-stranded DNA (dsDNA) modified with cadmium sulfide (CdS) nanoparticles and gold nanoparticles (AuNPs) on a gold electrode (GE) for kanamycin detection. The CdS nanoparticles were employed to strongly adsorb on the surface of GE via Au–S interactions. AuNPs, as the mediators, improved electron relay during the entire electron transfer process and the aptasensor response speed. Herein, we used dsDNA instead of single-stranded DNA (ssDNA) as the capture probe to prepare an aptasensor with improved stability. The proposed aptasensor exhibited a wider linearity to kanamycin in the range of 10.0–450.0 nM with a low detection limit of 2.85 nM. The aptasensor with ssDNA showed a low limit of detection of 9.76 nM. Moreover, it displayed high specificity for kanamycin and was free from interference in common milk adulterants. The proposed aptasensor had good reproducibility, stability, repeatability, and cost-effective regeneration. The aptasensor could selectively identify targets even in complex matrices, such as skimmed milk, and could be used for the detection of kanamycin in milk.
Introduction
Kanamycin is an aminoglycoside antibiotic, which is produced via the fermentation of Streptomyces kanamyceticus to treat infections caused by Gram-positive and Gram-negative bacteria.1–3 The abuse of kanamycin can cause rather serious side effects such as ototoxicity, nephrotoxicity, antibiotic resistance, and allergic reactions to the drug.4,5 To date, a variety of methods including surface plasmon resonance (SPR),6 capillary electrophoresis (CE),7 enzyme-linked immunosorbent assay,8 high performance liquid chromatography (HPLC),9 immunoassay,10 and electrochemical immunosensor11 have been developed to detect kanamycin in animal-derived food and biological samples. However, it's well known that although these traditional methods are reliable, sensitive, and stable, some problems, such as high turnaround time, sophisticated steps, expensive equipment, and high technical demand, limit their application.3Aptamers are artificial single-stranded DNA or RNA molecules with specific three-dimensional (3D) structures selected in vitro through SELEX12 that can specifically bind to a variety of targets, including ions, small molecules, proteins, and cells, with high affinity.13 Aptamers have attracted significant interest as recognition probes in bioassays because of their high specificity, simple synthesis, low immunogenicity, easy chemical modification, good chemical stability, and high affinity.14 Thus, electrochemical aptasensors are especially attractive in the fields of food safety and clinical diagnosis. In the past several years, an aptasensor for kanamycin detection has emerged as a simple yet efficient technique attracting increasing attention.15,16 Designing of a simple and sensitive sensor for sequence-specific recognition of double-stranded DNA (dsDNA) is crucial for disease diagnosis and human gene therapy because DNA in its natural state is double stranded.17 Recently, numerous methods have been used for sequence-specific recognition of dsDNA. The conformational changes in nucleic acids upon hybridization have been the basis for the development of different electrochemical DNA sensors.18–23
There are numerous reports stating that the aptamer can easily be adsorbed on the surface of citrate-capped negatively charged gold nanoparticles (AuNPs) to develop aptamer-based sensors for acetamiprid;24–28 moreover, the sequence-specific recognition of dsDNA by AuNP dual signal amplification has been reported.29 Recently, selective formation of AuNPs using dsDNA as templates has been proposed; however, ssDNA cannot serve as an effective template to support the formation. However, to the best of our knowledge, the use of a dsDNA/AuNP complex as an indicator probe has rarely been reported. Therefore, further exploration of the application of dsDNA/AuNP complexes in aptasensors and bio-nanotechnology remains a challenge. Herein, we developed an aptasensor-based label-free aptamer using dsDNA/AuNPs as the signal probe. This method takes advantage of the stronger binding affinity of the aptamer towards its target as compared to that towards its complementary sequence (competitor) and the remarkable difference in the affinity of AuNPs with dsDNA and mononucleotides. Cadmium sulfide (CdS) is an important II–VI group semiconductor with a wide band gap energy of 2.42 eV at room temperature. It has been extensively studied for its unique electronic and optical properties and potential applications in photoelectric devices.30 CdS nanoparticles were synthesized via a hydrothermal method using poly(N-vinyl-2-pyrrolidone) (PVP) as a surfactant to control the size of the particles and improve the dispersion and stability of the nanoparticles in the solution. The results show that PVP is an excellent surfactant and the O atom of C![[double bond, length as m-dash]](https://www.rsc.org/images/entities/char_e001.gif) O can effectively adsorb on the surface of the CdS nanoparticles, which prevents the growth of the CdS nanoparticles and their congregation. Moreover, this further improved the dispersion and stability of gold nanoparticles in the follow-up.
O can effectively adsorb on the surface of the CdS nanoparticles, which prevents the growth of the CdS nanoparticles and their congregation. Moreover, this further improved the dispersion and stability of gold nanoparticles in the follow-up.
In this study, we have employed electrochemical techniques to characterize the formation of dsDNA/AuNP/CdS for the development of an improved new aptasensor. Moreover, the proposed method had good sequence-specificity for the target dsDNA as compared to that for ssDNA. Kanamycin aptamer subunits after a ligation reaction can be hybridized with probe DNA to be the template for the formation of AuNP/CdS on the electrode surface. Therefore, highly sensitive and selective detection of target molecules can be realized by tracing the amplified electrochemical responses from dsDNA/AuNP/CdS on the electrode surface. The aptasensor not only had the significant advantages, such as a fast response, simple operation, and low cost, of electrochemical sensors but also inherited the high sensitivity and specificity of aptamers. The aptasensor displayed high specificity for kanamycin, was free from interference from common milk adulterants, and could selectively identify targets even in complex matrices such as skimmed milk. Therefore, the proposed aptasensor could be used for kanamycin detection in milk.
Experimental
Reagents and chemicals
NaH2PO4·2H2O and Na2HPO4·12H2O were purchased from Beijing Chemical Technology Co., Ltd. (Beijing, China). Kanamycin sulfate, neomycin sulfate, chlortetracycline, and tobramycin were purchased from Jingchun Co., Ltd. Chloroauric acid (HAuCl4), sodium citrate, and ethanol were obtained from Sinopharm Chemical Reagent Co., Ltd. (Shanghai, China). Cadmium chloride (CdCl2), ammonium acetate, and Na2S were obtained from Guangfu Science and Technology Co., Ltd. (Tianjing, China). All aptamer oligonucleotides were purchased from Sangon Biotechnology (Shanghai, China), and sequences of all aptamer oligonucleotides are listed as follows: kanamycin aptamer, 5′-AGATGGGG GTTGAGGCTAAGCCGA-3′; thiol labeled kanamycin aptamer, 5′-SH-AGATGGGGGTTGAGGCTAAGCCGA-3′; and its complementary single strand DNA kanamycin aptamer, 5′-SH-TCGGCTTAGCCTCAAC CCCCATCT-3′. All other chemicals were of analytical reagent grade. All the solutions were prepared with ultrapure water, which was purified using a Milli-Q purification system (Branstead, USA).Apparatus
Electrochemical measurements were carried out using a CHI660C workstation (China). A three-electrode configuration was employed, consisting of a gold electrode (GE, φ = 3 mm) serving as the working electrode and a saturated calomel electrode (SCE) and a platinum wire serving as the reference and counter electrodes, respectively. Solution pH values were measured via an FE20 Mettler-Toledo pH meter (Switzerland). Ultrasonication was performed using a KQ-100E ultrasonic cleaner (Kunshan, China). Scanning electron microscopy (SEM) and energy dispersive spectroscopy (EDS) were conducted using an FEI Sirion 200 (FEI, USA); transmission electron microscopy (TEM) was conducted using a Tecnai G2F20S-TWIN (FEI, USA). All electrochemical experiments were carried out at room temperature (RT).Preparation of AuNPs
Gold nanoparticles (AuNPs) were prepared via citrate reduction of tetrachloroauric acid (HAuCl4) in an aqueous solution using the Frens method.31 All the glassware used in the following process was washed with freshly prepared aqua regia (3![[thin space (1/6-em)]](https://www.rsc.org/images/entities/char_2009.gif) :
:![[thin space (1/6-em)]](https://www.rsc.org/images/entities/char_2009.gif) 1¼ conc. HCl
1¼ conc. HCl![[thin space (1/6-em)]](https://www.rsc.org/images/entities/char_2009.gif) :
:![[thin space (1/6-em)]](https://www.rsc.org/images/entities/char_2009.gif) conc. HNO3, v/v) for 1 h. After aqua regia treatment, the glassware was thoroughly rinsed with MilliQ water and then oven dried for 2–3 h to remove any traces of acid. In an Erlenmeyer flask, 100 ml of 0.01 wt% HAuCl4 solution was heated to boiling temperature under magnetic stirring. Then, 5 ml of 1 wt% sodium citrate solution was quickly added and kept boiling for further 15 min under heating and vigorous magnetic stirring after the mixture became deep red. The solution was then allowed to cool down to room temperature under continuous stirring and then stored at 4 °C for future use. The monodisperse spherical gold nanoparticles covered with a citrate shell were named as AuNPs in this study.
conc. HNO3, v/v) for 1 h. After aqua regia treatment, the glassware was thoroughly rinsed with MilliQ water and then oven dried for 2–3 h to remove any traces of acid. In an Erlenmeyer flask, 100 ml of 0.01 wt% HAuCl4 solution was heated to boiling temperature under magnetic stirring. Then, 5 ml of 1 wt% sodium citrate solution was quickly added and kept boiling for further 15 min under heating and vigorous magnetic stirring after the mixture became deep red. The solution was then allowed to cool down to room temperature under continuous stirring and then stored at 4 °C for future use. The monodisperse spherical gold nanoparticles covered with a citrate shell were named as AuNPs in this study.
Synthesis of CdS nanowires
Cd(NO3)2·4H2O and Na2S·9H2O were used as sources of Cd2+ and S2− ions in the solution, respectively. First, Cd(NO3)2·4H2O was added into the beaker. Then, 10% PVP was added dropwise under continuous stirring to obtain a pH of 2.5. The PVP is used as a surfactant to improve the uniformity of the CdS nanoparticles in an ice water bath. After the mixture was in an ice water bath for 30 min, Na2S·9H2O was added dropwise to the solution in an ice water bath for 30 min. CdS preparation was completed. CdS nanoparticles surface-capped with PVP were synthesized via a sol–gel method. Moreover, two important factors (Cd2+/S2− and PVP) influencing the preparation of the CdS nanoparticles and their mechanisms of influence were investigated. It was confirmed that the effects of superfluous S2− and addition of PVP on the reaction system were two important factors in the preparation of the CdS nanoparticles in high Cd2+ and S2− concentration solution, and the best dosage of PVP was determined.32Synthesis of dsDNA
The in-solution hybridization reaction was achieved by mixing the solutions containing 5 μM probe ssDNA (with the sequence 5′-AGATGGGGGTTGAGGCTAAGCCGA-3′) and 5 μM complementary target cDNA (with the sequence 5′-SH-TCGGCTTAGCCTCAACCCCC ATCT-3′) for 1 h at RT under mechanical shaking. The ssDNA and cDNA sequences were designed to mimic the PCR products. For this, the dsDNA solutions with different concentrations ranging from 0.1 nM to 1 μM were prepared via dilution of a 5 μM dsDNA solution with the measurement solution.33Electrochemical measurements
Cyclic voltammetry (CV) was performed over a potential range from −0.2 to +0.6 V at a scan rate of 100 mV s−1 in a 0.1 M KCl aqueous solution with 5.0 mM [Fe(CN)6]3−/4− (1![[thin space (1/6-em)]](https://www.rsc.org/images/entities/char_2009.gif) :
:![[thin space (1/6-em)]](https://www.rsc.org/images/entities/char_2009.gif) 1) as the redox probe. The electrochemical differential pulse voltammetry (DPV) measurements were carried out under the following conditions: the voltage was scanned from 0 to +0.6 V with a pulse width of 0.05 s, and the amplitude and the potential increment were both kept at 50 mV.
1) as the redox probe. The electrochemical differential pulse voltammetry (DPV) measurements were carried out under the following conditions: the voltage was scanned from 0 to +0.6 V with a pulse width of 0.05 s, and the amplitude and the potential increment were both kept at 50 mV.
Fabrication of aptasensors
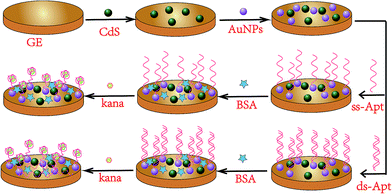
The aptasensor was fabricated on one gold electrode (GE) first. The bare GE was successively polished with 0.05 μm alumina slurry to obtain a mirror surface and ultrasonicated in an ethanol/ultrapure water bath for 5 min and then dried under ambient nitrogen gas. Subsequently, the electrode was scanned in 0.5 M H2SO4 aqueous solution by potential cycling in the range between −0.3 and 1.5 V at a scan rate of 100 mV s−1 until the cyclic voltammogram characteristic of a clean gold electrode was obtained. Then, the gold electrode was washed with copious amounts of ultrapure water and dried under nitrogen gas. After this, 10 μL of CdS suspension was dropped onto the surface of the GE and dried at RT. In the next step, 10 μL of AuNPs was dropped on the CdS-modified electrode surface. For dsDNA adsorption, the sensor surface was exposed to a solution containing in-solution hybridized dsDNA molecules for 1 h at RT. The dsDNA-modified electrode (dsDNA/AuNP/CdS/GE) was thoroughly washed with PBS to remove the loosely adsorbed aptamer. Then, the aptasensor modified with the dsDNA was electrochemically characterized in the measurement solution again. Subsequently, 10 μL of 1% BSA was dropped for 1 h to block the non-specific binding sites and avoid nonspecific adsorption. After being washed again with PBS, the aptasensor was incubated with kanamycin solution at 37 °C for 30 min to capture the target kanamycin. The as-prepared electrode was kept at 4 °C prior to use. The fabrication procedure of the aptasensor with ssDNA is the same as that of the abovementioned aptasensor. We obtained aptasensors for kanamycin detection. The schematic for the fabrication procedure of the aptasensors is displayed in Fig. 1.Determination of dissociation constant (Kd)
To determine the binding affinity of the selected aptamer, a fixed concentration of kanamycin was incubated with increasing concentrations of aptamer under mild shaking conditions for 30 min at RT. The unbound aptamer was removed by two gentle washes with the selection buffer.34 The dissociation constant (Kd) value was calculated by employing the nonlinear regression analysis using electroanalytical techniques. The Kd value is a measure of the affinity of the analyte to the receptors on the sensor surface. A lower dissociation constant corresponds to higher affinity, or higher stability of the analyte–receptor complex, which would help to improve the sensitivity. The binding of the ligand to the receptor is characterized via association (ka) and dissociation (kd) kinetic constants. With these constants, it is also possible to determine the equilibrium constants of association and dissociation (Ka = ka/kd and Kd = 1/Ka, respectively):
 | (1) |
 | (2) |
Results and discussion
Dissociation constant (Kd) measurement
The fitted parameters, estimated by a linear regression of the Hanes-Woolf regression, are Kd and Δimax. The calculated Kd value is 0.127 nM. The Langmuir binding curve also suggests that kanamycin independently binds to the aptamers. This very low Kd is comparable to that of the previously reported methods35 and much lower than that of other traditional methods for kanamycin detection;2 this might be due to the improved affinity of the immobilized aptamers and the electron transfer rate decrease upon the recognition-induced folding of the aptamer on the surface of the aptasensor. This might also be one reason for the high sensitivity of the kanamycin detection method.Characterization of the nanotracers and aptamer binding of kanamycin
Scanning electron microscopy (SEM) and transmission electron microscopy (TEM) images of the as-prepared CdS and AuNPs are shown in Fig. 2. Fig. 2(a) displays the SEM image of the CdS nanoparticles with uniform density and size distributions, and their lengths range from tens of nanometers to several hundred nanometers. The top right corner of Fig. 2(a) is the SEM image of the CdS nanoparticle dilution, from which it can be seen that the CdS nanoparticles have a tube structure. Fig. 2(c) shows the TEM images of CdS nanoparticles, in which the CdS nanoparticles distributed in tube-like structures can be observed. The SEM and TEM images of the CdS nanoparticles demonstrate good dispersion of CdS. The SEM (Fig. 2b) image of AuNPs clearly illustrates a number of bright dots positioned over the entire surface, suggesting that the AuNPs have been successfully dispersed on the surface of the GE. As shown in Fig. 2(d), the TEM image revealed that average particle diameters of the AuNPs were generally around 20 nm. Thus, the abovementioned results indicate that the as-prepared CdS and AuNPs were successfully synthesized. The energy dispersive spectroscopy (EDS) scan region of the CdS coating and the corresponding plane scan results of Cd and S elements are shown in Fig. 2(i). All the elements were uniformly distributed on the surface, and there was no element enrichment phenomenon. Thus, the abovementioned results indicate that the as-prepared CdS was successfully synthesized.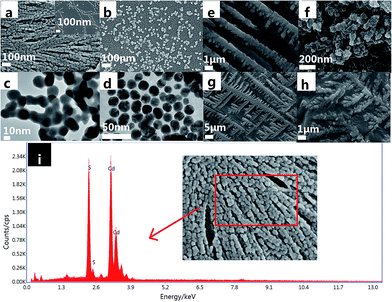 | ||
| Fig. 2 SEM images of (a) CdS; (b) AuNPs; TEM images of (c) CdS; (d) AuNPs; SEM images of (e) ssDNA; (f) ssDNA-kana; (g) dsDNA; (h) dsDNA-kana; and (i) energy dispersive spectroscopy of CdS. | ||
Fig. 2(e)–(h) shows the SEM images obtained before and after kanamycin bound to single-stranded DNA (e and f) and double-stranded DNA (g and h). DsDNA-bound kanamycin was more ordered and stable than ssDNA. This showed that dsDNA was more effective than ssDNA in specifically binding kanamycin.
Electrochemical characterization of the aptasensor
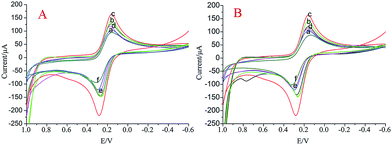
Cyclic voltammetry (CV) is an effective and convenient method for probing the features of a modified electrode surface. CV was used to characterize the construction of the aptasensor via a step-by-step approach. As displayed in Fig. 3, a pair of distinct redox peaks were observed for the bare GE due to the oxidation and reduction of [Fe(CN)6]4−/3− (curve a). After CdS was modified on the electrode, the peak current of CV was obviously increased (curve b); this might be due to the unique electronic properties of CdS. After AuNPs were modified on the electrode, the peak current of CV was obviously increased (curve c); this might be due to the excellent electron transfer ability of the AuNPs. Addition of the dsDNA (ssDNA) led to a smaller decrease and the peak potential difference turned larger (curve d) mainly due to the non-conductive ability of the oligonucleotides. Compared with the aptasensor with ssDNA, the aptasensor with dsDNA had a larger current change difference. This may be because the aptamer and AuNP-based platform relied on the preferential binding of AuNPs to ssDNA over dsDNA or secondary and tertiary-structured ssDNA.36 After the surface was blocked by BSA, the passivation of the active sites of the assembled electrode occurred, and the peak current further decreased (curve e). As expected, the peak current decreased further (curve f) after hybridization between aptamers and kanamycin. The CV peaks significantly increased with the addition of 100 nM kanamycin because the kanamycin target recycling resulted in the release of dsDNA (ssDNA), and the oligonucleotides that hindered the electronic transmission were reduced.Optimization of the experimental conditions
To achieve the best sensing performance, some experimental conditions should be optimized including the concentration of dsDNA, reaction time between dsDNA and kanamycin, the incubation pH, and the incubation time of the aptasensor with kanamycin. The concentration of the dsDNA had an effect on the hybridization efficiency of aptamers and kanamycin on the electrode and further affected the sensitivity of the aptasensor. Therefore, different concentrations of dsDNA (0.2, 0.5, 1.0, 2.0, 5.0, 8.0, 10.0, and 15.0 μM) were hybridized with kanamycin. As shown in Fig. 4(a), the peak currents increased with the increasing aptamer concentrations and reached a plateau at 5 μM. Thus, the dsDNA concentration of 5 μM was adopted in this study. The pH value of the detection solution was also investigated in the range of 6.0–8.5. As shown in Fig. 4(b), the maximum peak current change was observed at pH 7.2. Therefore, pH 7.2 PBS was selected in this study. The incubation time of the aptasensor with both aptamer and targets was another important parameter that could affect the response of the aptasensor. The dependence of the DPV peak current response on the incubation time before and after dsDNA addition is displayed in Fig. 4(c). The DPV peak current changes increased with the increasing incubation time from 20 to 160 min and then reached a plateau after 100 min; this indicated that dsDNA was saturated on the electrode surface. Thus, 100 min was the optimal incubation time of the aptasensor that was used in the following experiments. Besides the effect of dsDNA concentration and incubation time, it was found that the reaction time between aptamer and kanamycin also had an effect on the peak current of [Fe(CN)6]3−/4−. Therefore, the effect of the reaction time was also evaluated. The results showed that the peak current of [Fe(CN)6]3−/4− obviously decreased with the increasing reaction time from 0 to 20 min and stayed stable after 20 min (Fig. 4, curve d); this suggested that the reaction was completed. Therefore, a reaction time of 20 min was chosen in the following experiments based on the stable response current. A simple and selective aptasensor was developed for the rapid determination of kanamycin in this study.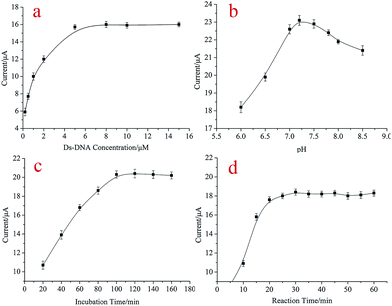 | ||
| Fig. 4 The optimization of experimental parameters: the influence of (a) dsDNA concentration, (b) pH of the working solution, (c) the incubation time, and (d) the reaction time. | ||
Analytical performance of the aptasensor
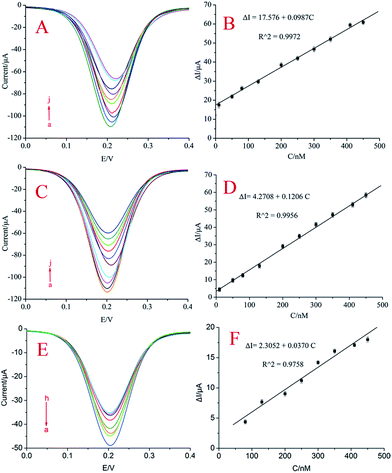
Under the optimum conditions, the aptasensor was used to detect kanamycin. As can be seen from Fig. 5(A) (the aptasensor with ssDNA) and Fig. 5(C) (the aptasensor with dsDNA), the current intensity increased with the increasing kanamycin concentration. The different electrodes have peaks at different potentials, but they did not have any effect on the size of the peak. The current difference with the same concentration of aptamer modified on different electrodes is consistent (Fig. S1†). The change in current intensity has a linear relationship with the kanamycin concentration in the range of 10.0–450.0 nM (Fig. 5(B); the aptasensor with ssDNA), and the regression equation is ΔI = 17.576 + 0.0987C (R2 = 0.9972). The change in current intensity has a linear relationship with the kanamycin concentration in the range of 10.0–450.0 nM (Fig. 4(D); the aptasensor with dsDNA), and the regression equation is ΔI = 4.2708 + 0.1206C (R2 = 0.9956), where ΔI = I − I0 (I0 and I correspond to the current intensity before and after the addition of kanamycin, respectively), C is the kanamycin concentration, and R is the regression coefficient. The aptasensor with dsDNA (2.85 nM) showed a lower limit of detection than the aptasensor with ssDNA (9.76 nM) (S/N = 3). These were competitive with or even better than the previously reported methods (Table S1†) 14,37–42. Consequently, the proposed method in this study had a wide linear range and low detection limits for kanamycin.To verify that the addition of CdS nanoparticles improved the sensitivity of the aptasensor, we performed a comparative test. In the case where the other electrode modification steps were the same, an aptasensor without CdS nanoparticle modification was assembled. The different concentrations of kanamycin were detected using the contrapositive aptasensor. As can be seen from Fig. 5(F), the changes in the current intensity of the aptasensor were found to be proportional to kanamycin concentration in the linear range from 80 nM to 450 nM with a detection limit of 25.69 nM (S/N = 3). Thus, the sensitivity of the aptasensor without CdS nanoparticles is lower than that of the aptasensor with CdS nanoparticles in this study. The improved sensing performance can be attributed to the multiple amplified current of the CdS nanoparticles and AuNPs.
Specificity, reproducibility, stability, repeatability, and regeneration of the aptasensor
To test the specificity of the developed aptasensor for kanamycin analysis, aptamer and kanamycin analogs were tested by detecting the DPV peak current change (ΔI) under the same conditions. As illustrated in Fig. 6(A), the results show that only kanamycin exhibits an obvious current intensity change (ΔI), whereas ΔI is only 4.2% for neomycin sulfate, 2.0% for gentamicin, 4.7% for oxytetracycline, and 3.4% for tobramycin as compared to ΔI of kanamycin. The response of the aptasensor in a mixture of the abovementioned four antibiotics was also examined. The ΔI value in the mixture had little difference as compared to that in only kanamycin. Signal intensities of 5 μM kanamycin in the presence of various interfering substances (500 μM) were almost unchanged in contrast to those of kanamycin alone. The results indicated that the proposed aptasensor exhibited high specificity for kanamycin detection. The robustness of the aptasensor was tested by performing the assay in the presence of common milk adulterants (such as sodium chloride, glucose, and sodium bicarbonate). No considerable current change was observed in the presence of different interfering agents in the processed milk (Fig. 6B). However, kanamycin spiked milk induced aggregation with current change; this indicated the high specificity of the aptamer for kanamycin. The abovementioned assay showed that the kanamycin aptamer had insignificant interference from common milk adulterants.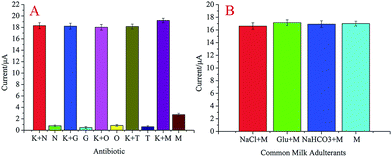 | ||
| Fig. 6 (A). DPV current responses of the aptasensor to kanamycin and its analogs. (B) DPV current responses of the aptasensor to kanamycin in the presence of common milk adulterants. | ||
The reproducibility of the design strategy was tested via inter-assay accuracy. The same concentration of kanamycin was examined with five independently prepared electrodes using the same experimental conditions. A relative standard deviation (RSD) of 3.7% was obtained, which indicated that the aptasensor had good reproducibility.
The aptasensor was measured via CV for a 60-cycle successive scan, and a 2.8% deviation of the initial response was observed. The stability of the aptasensor was examined by storing the sensor at 4 °C. After a 30 day storage period, the aptasensor after adsorbing kanamycin retained 96.8% of its initial current response. The results showed that the prepared aptasensor had satisfactory stability.
After continuously using the five aptasensors 3 times, the variation coefficients of the inter-assay were 2.5% with the same concentration of kanamycin, which showed that the aptasensor had good repeatability.
The prepared electrochemical aptasensors were readily regenerated because the aptamers were anchored to the electrode through molecular recognition and the simple operation of immersion of electrode in a solution containing aptamer for 30 min easily regenerated the aptasensors; thus, the prepared electrochemical aptasensors could readily and cost-effectively be regenerated.
Application of the aptasensor
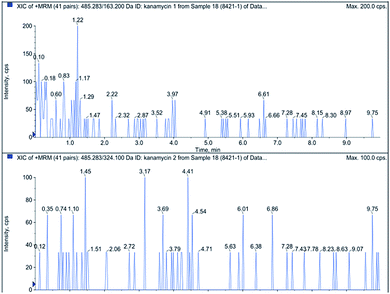
To evaluate the applicability of the prepared aptasensor, a milk sample was measured by the aptasensor. Milk was purchased from a local supermarket with intact packages. In addition, the kanamycin content in the milk sample was detected by liquid chromatography-tandem mass spectrometry (LC-MS/MS) as a reference. The results showed no kanamycin residues in milk samples (Fig. 7). The accuracy of kanamycin detection in milk samples was estimated by assaying the recoveries via a standard addition method. The milk sample was placed in a centrifuge for 10 min (6000 rpm), the supernatant of the mixture was separately diluted five times with the buffer solution (PBS, pH 7.2) and then equilibrated for 0.5 h at room temperature. Milk was spiked with different kanamycin concentrations (0.01, 0.05, 0.1, 0.2, 0.5, 1.0, 2.0, and 5.0 μM) and directly analyzed. As can be seen in Table 1, the spiked recoveries were between 91.0% and 110.4% for kanamycin. The results show that our aptasensor could selectively identify targets even in complex matrices such as skimmed milk, and the proposed aptasensor could potentially be used for kanamycin detection in milk.| Milk found (μM) | Added (μM) | Total found (μM) | Recovery (%) |
|---|---|---|---|
| Not detected | 0.010 | 0.0091 | 91.00 |
| Not detected | 0.050 | 0.0552 | 110.4 |
| Not detected | 0.100 | 0.0938 | 93.80 |
| Not detected | 0.200 | 0.1915 | 95.75 |
| Not detected | 0.500 | 0.4824 | 96.48 |
| Not detected | 1.000 | 0.9863 | 98.63 |
| Not detected | 2.000 | 2.1047 | 105.24 |
| Not detected | 5.000 | 4.8537 | 97.07 |
Conclusions
In this study, we developed a facile and sensitive aptasensor based on dsDNA for the rapid detection of kanamycin in milk samples. A CdS-labeled GE was employed to strongly adsorb on the surface of the GE via Au–S interactions. Current intensity changes served as signals for kanamycin detection. The aptasensor was based on the excellent electron transfer ability of AuNPs and their unique interaction with aptamers. Utilizing the ΔI as the response signal and AuNPs as signal amplifiers, it was found that the aptasensor exhibited good stability, specificity, and reproducibility in detecting kanamycin and had a wide detection range with a low detection limit. The proposed aptasensor provides an excellent, rapid tool for sensitive kanamycin monitoring. The aptasensor has been applied to the determination of kanamycin in milk samples. Furthermore, this method is very simple and convenient since there is no requirement for the functionalization of the AuNPs. This study not only focuses on kanamycin, but can also be extended to detect other antibiotics through the substitution of the appropriate aptamer. Moreover, the proposed aptasensor can have promising applications in sensitive assays for multiplex antibiotics screening.Acknowledgements
This work was supported by the National Natural Science Foundation of China (No. 30972055, 31101286, 31471641), Agricultural Science and Technology Achievements Transformation Fund Projects of the Ministry of Science and Technology of China (No. 2011GB2C60020), Special project of independent innovation of Shandong Province (2014CGZH0703), and Shandong Provincial Natural Science Foundation, China (No. Q2008D03, ZR2014CM009, ZR2014FL003, ZR2015CM016).Notes and references
- X. Bai, H. Hou, B. Zhang and J. Tang, Biosens. Bioelectron., 2014, 56, 112 CrossRef CAS PubMed.
- K. M. Song, M. Cho, H. Jo, K. Min, S. H. Jeon, T. S. Kim, M. S. Han, J. K. Ku and C. Ban, Anal. Biochem., 2011, 415, 175 CrossRef CAS PubMed.
- H. Li, D. E. Sun, Y. Liu and Z. Liu, Biosens. Bioelectron., 2014, 55, 149 CrossRef CAS PubMed.
- W. Xu, Y. Wang, S. Liu, J. H. Yu, H. Z. Wang and J. D. Huang, New J. Chem., 2014, 38, 4931 RSC.
- R. Wang, B. Ge, X. Jia, Z. Li and J. Chang, Anal. Methods, 2013, 5, 5302 RSC.
- X. Wang, M. Zou, X. Xu, R. Lei, K. Li and N. Li, Anal. Bioanal. Chem., 2009, 395, 2397 CrossRef CAS PubMed.
- E. Kaale, A. V. Schepdael, E. Roets and J. Hoogmartens, Electrophoresis, 2003, 24, 1119 CrossRef CAS PubMed.
- H. Watanabe, A. Satake, Y. Kido and A. Tsuji, Analyst, 1999, 124, 1611 RSC.
- B. Blanchaert, E. P. Jorge, P. Jankovics, E. Adams and A. V. Schepdael, Chromatographia, 2013, 76, 1505 CAS.
- Y. Chen, Z. Wang, S. Tang, Y. Zhu and X. Xiao, J. Agric. Food Chem., 2008, 56, 2944 CrossRef CAS PubMed.
- Q. Wei, Y. F. Zhao, B. Du, D. Wu, H. Li and M. H. Yang, Food Chem., 2012, 134, 1601 CrossRef CAS PubMed.
- C. Tuerk and L. Gold, Science, 1990, 249, 505 CAS.
- L. C. Bock, L. C. Griffin, J. A. Latham, E. H. Vermaas and J. J. Toole, Nature, 1992, 355, 564 CrossRef CAS PubMed.
- X. Sun, F. L. Li, G. H. Shen, J. D. Huang and X. Y. Wang, Analyst, 2014, 139, 299 RSC.
- J. Daprà, L. H. Lauridsen, A. T. Nielsen and N. Rozlosnik, Biosens. Bioelectron., 2013, 43, 315 CrossRef PubMed.
- K. H. Leung, H. Z. He, S. H. Chan, W. C. Fu, C. H. Leung and D. L. Ma, Sens. Actuators, B, 2013, 177, 487 CrossRef CAS.
- K. M. Vasquez, L. Narayanan and P. M. Glazer, Science, 2000, 290, 530 CrossRef CAS PubMed.
- C. Fan, K. W. Plaxco and A. J. Heeger, Proc. Natl. Acad. Sci. U. S. A., 2003, 100, 9134 CrossRef CAS PubMed.
- Y. Mao, C. Luo and Q. Ouyang, Nucleic Acids Res., 2003, 31, 108 CrossRef.
- C. E. Immoos, S. J. Lee and M. W. Grinstaff, ChemBioChem, 2004, 5, 1100 CrossRef CAS PubMed.
- Y. Xiao, B. D. Piorek, K. W. Plaxco and A. J. Heeger, J. Am. Chem. Soc., 2005, 127, 17990 CrossRef CAS PubMed.
- X. Zuo, S. Song, J. Zhang, D. Pan, L. Wang and C. Fan, J. Am. Chem. Soc., 2007, 129, 1042 CrossRef CAS PubMed.
- G. S. Bang, S. Cho and B. G. Kim, Biosens. Bioelectron., 2005, 21, 863 CrossRef CAS PubMed.
- T. K. Sharma, R. Ramanathan, R. Rakwal, G. K. Agrawal and V. Bansal, Proteomics, 2015, 15, 1680 CrossRef CAS PubMed.
- P. Weerathunge, R. Ramanathan, R. Shukla, T. K. Sharma and V. Bansal, Anal. Chem., 2014, 86, 11937 CrossRef CAS PubMed.
- H. J. Shi, G. H. Zhao, M. C. Liu, L. F. Fan and T. C. Cao, J. Hazard. Mater., 2013, 260, 754 CrossRef CAS PubMed.
- T. K. Sharma, J. G. Bruno and A. Dhiman, Biotechnol. Adv., 2017, 35, 275 CrossRef CAS PubMed.
- A. Dhiman, P. Kalra, V. Bansal, J. G. Bruno and T. K. Sharma, Sens. Actuators, B, 2017, 246, 535 CrossRef CAS.
- Z. B. Li, X. M. Miao, K. Xing, A. H. Zhu and L. S. Ling, Biosens. Bioelectron., 2015, 74, 687 CrossRef CAS PubMed.
- J. N. Coleman, M. Lotya, A. O'Neill, S. D. Bergin, P. J. King, U. Khan, K. Young and A. Gaucher, et al., Science, 2011, 331, 568 CrossRef CAS PubMed.
- G. Frens, Nat. Phys. Sci., 1973, 241, 20 CrossRef CAS.
- W. L. Cao, K. H. Zhang and J. C. Zhang, Chin. J. Inorg. Chem., 2002, 18, 997 CAS.
- C. S. Wu, A. Poghossian, T. S. Bronder and M. J. Schöning, Sens. Actuators, B, 2016, 229, 506 CrossRef CAS.
- A. Chrouda, A. Sbartai, A. Baraket and L. Renaud, et al., Anal. Biochem., 2015, 488, 36 CrossRef CAS PubMed.
- J. Chen, Z. H. Li, J. Ge, R. Yang, L. Zhang, L. B. Qu, H. Q. Wang and L. Zhang, Talanta, 2015, 139, 226 CrossRef CAS PubMed.
- Y. Y. Xu, T. Han, X. Q. Li, L. H. Sun, Y. J. Zhang and Y. S. Zhang, Anal. Chim. Acta, 2015, 891, 298 CrossRef CAS PubMed.
- C. Z. Yu, Y. Z. He, G. N. Fu, H. Y. Xie and W. E. Gan, J. Chromatogr. B: Anal. Technol. Biomed. Life Sci., 2009, 877, 333 CrossRef CAS PubMed.
- C. Li, Y. Y. Zhang, S. A. Eremin, O. Yakup, G. Yao and X. Y. Zhang, Food Chem., 2017, 227, 48 CrossRef CAS PubMed.
- L. Qin, G. M. Zeng, C. Lai, D. L. Huang, C. Zhang, P. Xu, T. J. Hu, X. G. Liu, M. Cheng, Y. Liu, L. Hu and Y. Y. Zhou, Sens. Actuators, B, 2017, 243, 946 CrossRef CAS.
- X. J. Bai, H. Hou, B. L. Zhang and J. L. Tang, Biosens. Bioelectron., 2014, 56, 112 CrossRef CAS PubMed.
- T. K. Sharma, R. Ramanathan, P. Weerathunge, M. Mohammadtaheri, H. K. Daima, R. Shukla and V. Bansal, Chem. Commun., 2014, 50, 15856 RSC.
- F. L. Li, Y. M. Guo, X. Sun and X. Y. Wang, Eur. Food Res. Technol., 2014, 239, 227 CrossRef CAS.
Footnote |
| † Electronic supplementary information (ESI) available. See DOI: 10.1039/c7ra05946a |
| This journal is © The Royal Society of Chemistry 2017 |

