
 Open Access Article
 This Open Access Article is licensed under a Creative Commons Attribution-Non Commercial 3.0 Unported Licence
Surface chemistry of water-dispersed detonation nanodiamonds modified by atmospheric DC plasma afterglow†
Pavla Stenclova *a,
Vladyslava Celedovab,
Anna Artemenkoa,
Vit Jiraseka,
Jaroslav Jiraab,
Bohuslav Rezekb and
Alexander Kromkaa
*a,
Vladyslava Celedovab,
Anna Artemenkoa,
Vit Jiraseka,
Jaroslav Jiraab,
Bohuslav Rezekb and
Alexander Kromkaa
aInstitute of Physics, Academy of Sciences of the Czech Republic, Cukrovarnicka 10, 162 00 Prague 6, Czech Republic. E-mail: stenclova@fzu.cz
bFaculty of Electrical Engineering, Czech Technical University in Prague, Technicka 2, 166 27 Prague, Czech Republic
First published on 9th August 2017
Abstract
Surface modification of detonation nanodiamonds (DNDs) is a key factor for their application in diverse fields of science and technology. In this work we report on an easy and low-cost method for modifying water-dispersed DNDs by atmospheric DC plasma afterglow. DNDs were used in either as-received form (asrec-DND) or were oxidized by air-annealing at 450 °C for 30 minutes (O-DND). The influence of applied voltage and thus the type of discharge (corona discharge at 10 kV or transient spark discharge at 15 kV) and treatment duration (5 and 10 minutes) on the surface chemistry of DNDs was evaluated by Fourier Transform Infrared (FTIR) spectroscopy supported by X-ray photoelectron spectroscopy (XPS) and dynamic light scattering (DLS). Treated asrec-DNDs revealed stable positive ζ-potential (30 mV) during rearrangement of oxygen-containing moieties (changes in area below 1250 cm−1) as well as CHx groups, reflected in the enormous enhancement of the band at 1328 cm−1 and disappearance of the C![[double bond, length as m-dash]](https://www.rsc.org/images/entities/char_e001.gif) C band at 1589 cm−1. On the other hand, the DC discharge afterglow had only minor impact on the surface chemistry of O-DND particles, as detected by FTIR and XPS, while a negative change of ζ-potential by up to 22 mV occurred. O-DND particles dried in vacuum also exhibited a noticeable catalytic effect towards hydrocarbons.
C band at 1589 cm−1. On the other hand, the DC discharge afterglow had only minor impact on the surface chemistry of O-DND particles, as detected by FTIR and XPS, while a negative change of ζ-potential by up to 22 mV occurred. O-DND particles dried in vacuum also exhibited a noticeable catalytic effect towards hydrocarbons.
1 Introduction
Nanodiamond particles (NDs) promise a broad application potential in diverse fields. In the last few years, NDs arose for instance as a promising candidate for theranostics (biosensors, NMR sensors, biomarkers, drug delivery agents, etc.) due to their structural and chemical properties, photostable colour centres (especially NV and SiV), and biocompatible properties including low cytotoxicity.1 Besides biomedical applications, NDs' opto-electronic properties are gaining interest also in spintronics.2,3The most representative group of NDs are particles produced by a detonation process (DND – detonation nanodiamonds) with a nominal size of about 5 nm in diameter and an almost monodisperse narrow size distribution. However, as-prepared DNDs suffer from undefined surface functional groups including alcohols, ethers or sp2 carbon coming from the post-synthetic treatment and washing in mineral acids.4,5 In case of 5 nm DNDs, the ratio of surface atoms to the volume of the particle is about 15%,6 thus the chemistry of the surface strongly determines the DND properties, functions and thereby their utilization. For example, it was shown, that the surface termination can control photoluminescence of DNDs from NV centres due to the electric dipoles of the surface atoms.7,8 Many attempts to standardization or modification of DNDs have been already performed including wet chemical treatment,9–11 annealing in different atmospheres,12–15 or plasma treatment.16–22
Commercially available purified DNDs contain more than 90% of carbon, residual nitrogen, hydrogen and oxygen in various forms. Residual hydrogen and oxygen on their surface is represented by various functional groups such as CHx, alcohols, aldehydes, ketones, ethers, carboxyl acids and their derivates. More than 80% of DNDs volume is represented by sp3 carbon, while reactive sp2 form of carbon and surface functional groups allow both non-covalent and covalent chemical modification.9 Non-covalent interactions are represented by hydrogen bonds and electrostatic forces resulting in a strong interaction for instance with biomolecules.10 Covalent chemical modifications are performed with the aim to homogenize the surface functional groups and to improve de-agglomeration and stabilization of NDs in colloidal solutions.11 The modified surface can then also serve as a suitable starting point for further modification by various functional molecules.23
Among various methods, oxidation by annealing in air was found to be highly efficient and environmentally friendly for removal of sp2 carbon from DND surface without using toxic or aggressive chemicals.24 Thermogravimetric and Raman analysis confirmed that the annealing in air at 450 °C can reliably remove non-diamond carbon and does not affect the diameter of sp3 core. Annealing at higher temperatures can decrease the DNDs diameter below 2 nm.25,26 After the annealing in air, CHx groups are mostly removed and oxidized mostly to cyclic ketones and lactones that are presented as functional groups on DNDs surface.24 On the other hand, annealing in hydrogen atmosphere resulted in vanishing ether groups and appearance of higher amount of CHx groups, as revealed by FTIR spectroscopy and XPS.27
Besides annealing of DND powders in different atmospheres, various types of plasma treatments were also performed. Hydrogenation of the entire DNDs surface was achieved by microwave hydrogen plasma in a specialized setup.15 Presence of C–O and CO groups on DNDs was replaced by typical signatures of hydrogen termination, while the overall content of oxygen decreased to 3 at%. Kromka et al.19 was able to employ diffuse coplanar surface barrier discharge (DCSBD) at atmospheric pressure in hydrogen atmosphere to graft hydrogen to DNDs. The same setup was used to introduce amino groups on DNDs surface from hydrogen/nitrogen gas mixture.20 However, DNDs are often treated non-uniformly during the plasma modification of dry powder due to the limited contact of the reactive gas species with the particles.
Therefore, for more practical and volume processing, attempts were performed to functionalize nanoparticles in aqueous suspensions by employing underwater corona discharge,17,21 laser irradiation (LI) or radio-frequency (RF) plasma in liquid.16,18,22 Underwater corona discharge in case of Jirásek et al.21 led to filamentation caused by presence of NaCl and formation of epoxides as a result of chemical reactions between OH radicals and CC bonds originally present in as-received DNDs. On the other hand Kozak et al.22 observed only minor changes on as-received DNDs treated by LI and RF plasma. The DNDs were almost insensitive to RF treatment while LI resulted in oxidative etching of sp2 shell. Transformation of functional groups on DNDs were not observed for neither LI nor RF plasma treatment.22
In this contribution we report on a novel modification of surface functional groups of water-dispersed DNDs by corona or transient spark discharge afterglow. By correlation of infrared, Raman, and X-ray photoelectron spectroscopy and dynamic light scattering we show that the process can be used to substantially rearrange surface chemical groups while keeping ζ-potential intact and vice versa. Specific adsorption of carbon-based molecules is also noticed.
2 Experimental part
Detonation nanodiamond powder of 5 nm nominal size (New Metals and Chemicals Corp., Ltd.; Kyobashi, Japan) with two types of initial surface modification was used in the performed experiments. The first surface modification is characterized by high amount of CHx groups in as-received DNDs,27 the as-received DNDs are further labelled as asrec-DNDs. The as-received DND particles were air-annealed at 450 °C for 30 minutes. Such treated DNDs are characteristic with increased amount of oxygen-containing surface groups and thus they are further labelled as O-DND.27 Suspensions of both DNDs were prepared by dispersing of appropriate amount of DND powder in deionized water to the concentration of 1 mg ml−1. The suspension was ultrasonically treated for 45 minutes to achieve homogeneity before plasma treatment.The afterglow plasma treatments were performed using the setup consisting of point-to-hollow electrode system covered in the 2 mm thick, ø30 mm plastic tube (see Fig. 1b). The tube has two holes: ø6 mm underneath the hollow cathode to allow the ion flux diffuse into treated sample and ø4 mm hole at the top of the tube wall to allow ambient air diffuse inside the tube.
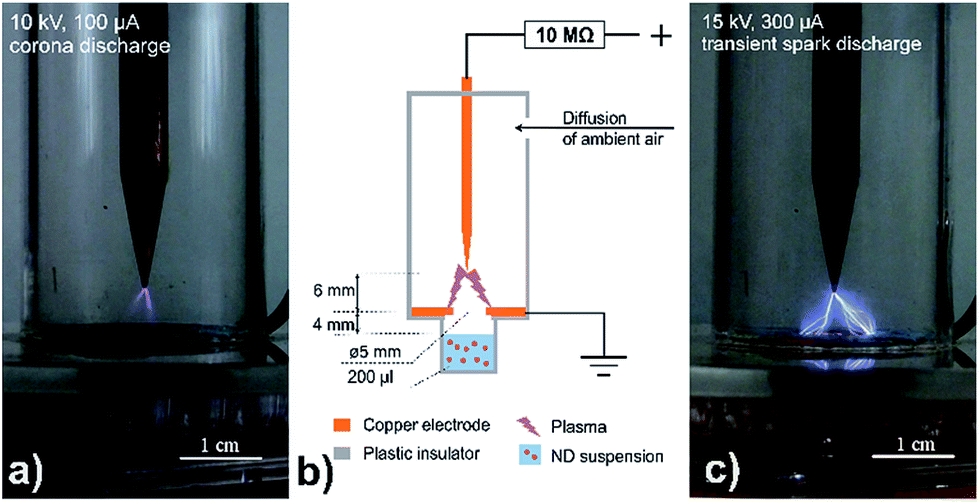 | ||
| Fig. 1 Real image of setup providing corona discharge at 10 kV (a) and transient spark discharge at 15 kV (c) and schematic representation of setup for DND treatment (b). | ||
The sharp copper electrode was connected to high voltage through 10 MΩ resistor and the second electrode, realized as a copper circle penetrated in the middle with ø5 mm hole, was grounded. The diameter of the cathode hollow was the same as the diameter of a single well of the 96-wells microtiter plate, used as a sample holder. The well with 200 μl of DNDs suspension was tightly covered with the electrode system, so the distance between the grounded electrode and treated sample was 4 mm.
Point-to-hollow electrode geometry (see Fig. 1) was used to generate either positive DC corona discharge (10 kV@100 μA) or transient spark discharge (15 kV@300 μA). Samples were treated indirectly by afterglow of positive corona (Fig. 1a) or transient spark discharge (Fig. 1c) for 5 or 10 minutes. Suspension was stirred by the ion flux and no additional mixing was performed during the experiments. The humidity in the setup increased during the treatment. Despite the fact that we did not measure the humidity values, one can clearly observe formation of droplets on the plastic tube. Humidity inside the plastic tube increased in time as a result of liquid evaporation, hence the tube was purged for 10 s with ambient air after each treatment. Loss of liquid due to evaporation induced by the ion flux increased with treatment time. In extreme case (treatment by transient spark discharge afterglow for 10 minutes) it was estimated up to 40%. Evaporation at the shorter treatments was estimated around 15% of the sample volume.
Evolution of surface functional groups on the DND particles before and after the treatment was characterized by grazing angle reflectance Fourier transform infrared (GAR-FTIR) spectroscopy. IR absorbance spectra were measured using a N2-purged Thermo Nicolet 870 spectrometer equipped with the KBr beam splitter and MCT-D detector cooled by liquid nitrogen. A 100–200 μl of the aqueous suspension was applied on the Au mirror by a drop casting just before the GAR-FTIR measurement. DNDs on Au mirrors were heated on a hotplate at 100 °C for 2 min to evaporate water. Samples were additionally dried in vacuum chamber pumped down to 10−6 mbar for 5 days to get rid of adsorbed water. Optical absorbance was calculated in the standard absorbance units as A = −log(R/R0), where R is the spectrum measured with DNDs and R0 is the reference (background) spectrum recorded using clean Au mirror prior to the DNDs application. In all cases, the spectra represent an average of 128 scans recorded with a resolution of 4 cm−1. Note that the GAR method does not provide quantitative information about the functional groups and the spectra should be evaluated only qualitatively. The spectra were measured within two days after the treatment and after storage the treated suspension in ambient air for 3 months.
The NDs suspensions deposited on Au mirrors were also used for Raman spectra measurements by using a Renishaw InVia Raman microspectrometer with excitation wavelength of 442 nm. The power of the incident laser was below 1 mW to minimize possible heat-induced changes of the samples. All measurements were performed with a 100× objective (numerical aperture 0.5), resulting in the laser spot diameter of 7 μm. The accumulation time was set to 180 s to increase the signal-to-noise ratio. A spectral calibration was done on a bulk monocrystalline diamond sample.
Characterization of the chemical composition of the DNDs was done by X-ray photoelectron spectroscopy (XPS, AXIS Supra, Kratos) using monochromated Al Kα X-ray source (1486.6 eV) and hemispherical energy analyser (analysed area – 0.7 × 0.3 mm2). The XPS photoelectron spectra were acquired at a constant take-off angle of 90°. The survey scans were recorded using 80 eV pass energy, whereas the high resolution scans were recorded at 20 eV pass energy. The asrec-DND and O-DND particles were calibrated in accordance with ref. 18. According to the literature6,19 the C 1s peaks were deconvoluted into four different peaks: C-sp2 (284.2 eV), C-sp3 (285.3 eV), C–O (286.6 eV) and CO (287.6 eV). The Kratos charge neutralizer system was used to compensate charging effects on analysed surfaces. The spectra were processed with CasaXPS software using linear base-line and Gaussian line shapes of variable widths. The deviation of binding energies in the fits was about ±0.2 eV. The samples for XPS analysis were prepared in the same way as for the IR analysis, which means by drop casting the colloidal suspension on Au substrate for better adhesion.
Dynamic light scattering (DLS) measurements of colloidal suspension were performed on a Malvern Zetasizer Nano ZS equipped with a helium–neon laser (633 nm) at 25 °C; the scattering angle was 173°. A disposable folded capillary cell was used to eliminate sample cross contamination. The refractive index of bulk diamond (2.4) was used to recalculate intensity distribution to number distribution. Untreated as well as treated colloidal suspension of original concentration 1 mg ml−1 were diluted with deionized water to concentration of 0.5 mg ml−1 and ultrasonically treated for 30 minutes prior to the measurements. Additional filtration or centrifugation was not performed. The measurement was repeated 6 times. The size distribution is represented as the mean values, while the obviously outlying results were excluded. The results are presented as a number distribution.
3 Results
The well-dried IR spectra of reference as well as treated samples dried for prolonged time in vacuum are depicted in Fig. 2. The reference spectrum of asrec-DNDs (Fig. 2a, black line) reveals a broad band at 3300 cm−1 belonging to –OH stretch of alcohol groups or carboxylic acids. Three sharp peaks at 3000–2800 cm−1 belong to stretching vibrations of CHx groups. Related bending vibrations are centred at 1456, 1372 and 1327 cm−1. Vibration centred at 1595 cm−1 is attributed to CC double bonds. Carbonyl band at 1704 cm−1 is most probably attributed to carboxylic acids or ketones. Broad absorption below 1250 cm−1 belongs to various C–O and C–O–C vibrations. Asrec-DNDs treated by corona discharge afterglow (Fig. 2a) revealed disappearance of CC band at 1595 cm−1 and newly formed band at 1627 cm−1, which can be ascribed to stretching vibration of C–O group in carboxylic acids. Intensity of the band at 1327 cm−1 increased relatively to CO band and thus the band at 1327 cm−1 became the most intensive band in the spectra of treated material. The absorption below 1250 cm−1 slightly decreases. In the spectra treated by transient spark discharge afterglow (Fig. 2b), the band of CC bond disappears as well and a new band of C–O stretch centred at 1637 cm−1 is developed. The biggest change in the treated spectra in comparison to reference one is the enormous enhancement of the broad band centred at 1332 cm−1. Moreover, new sharp maximum at 1077 cm−1 is developed in the area below 1250 cm−1.
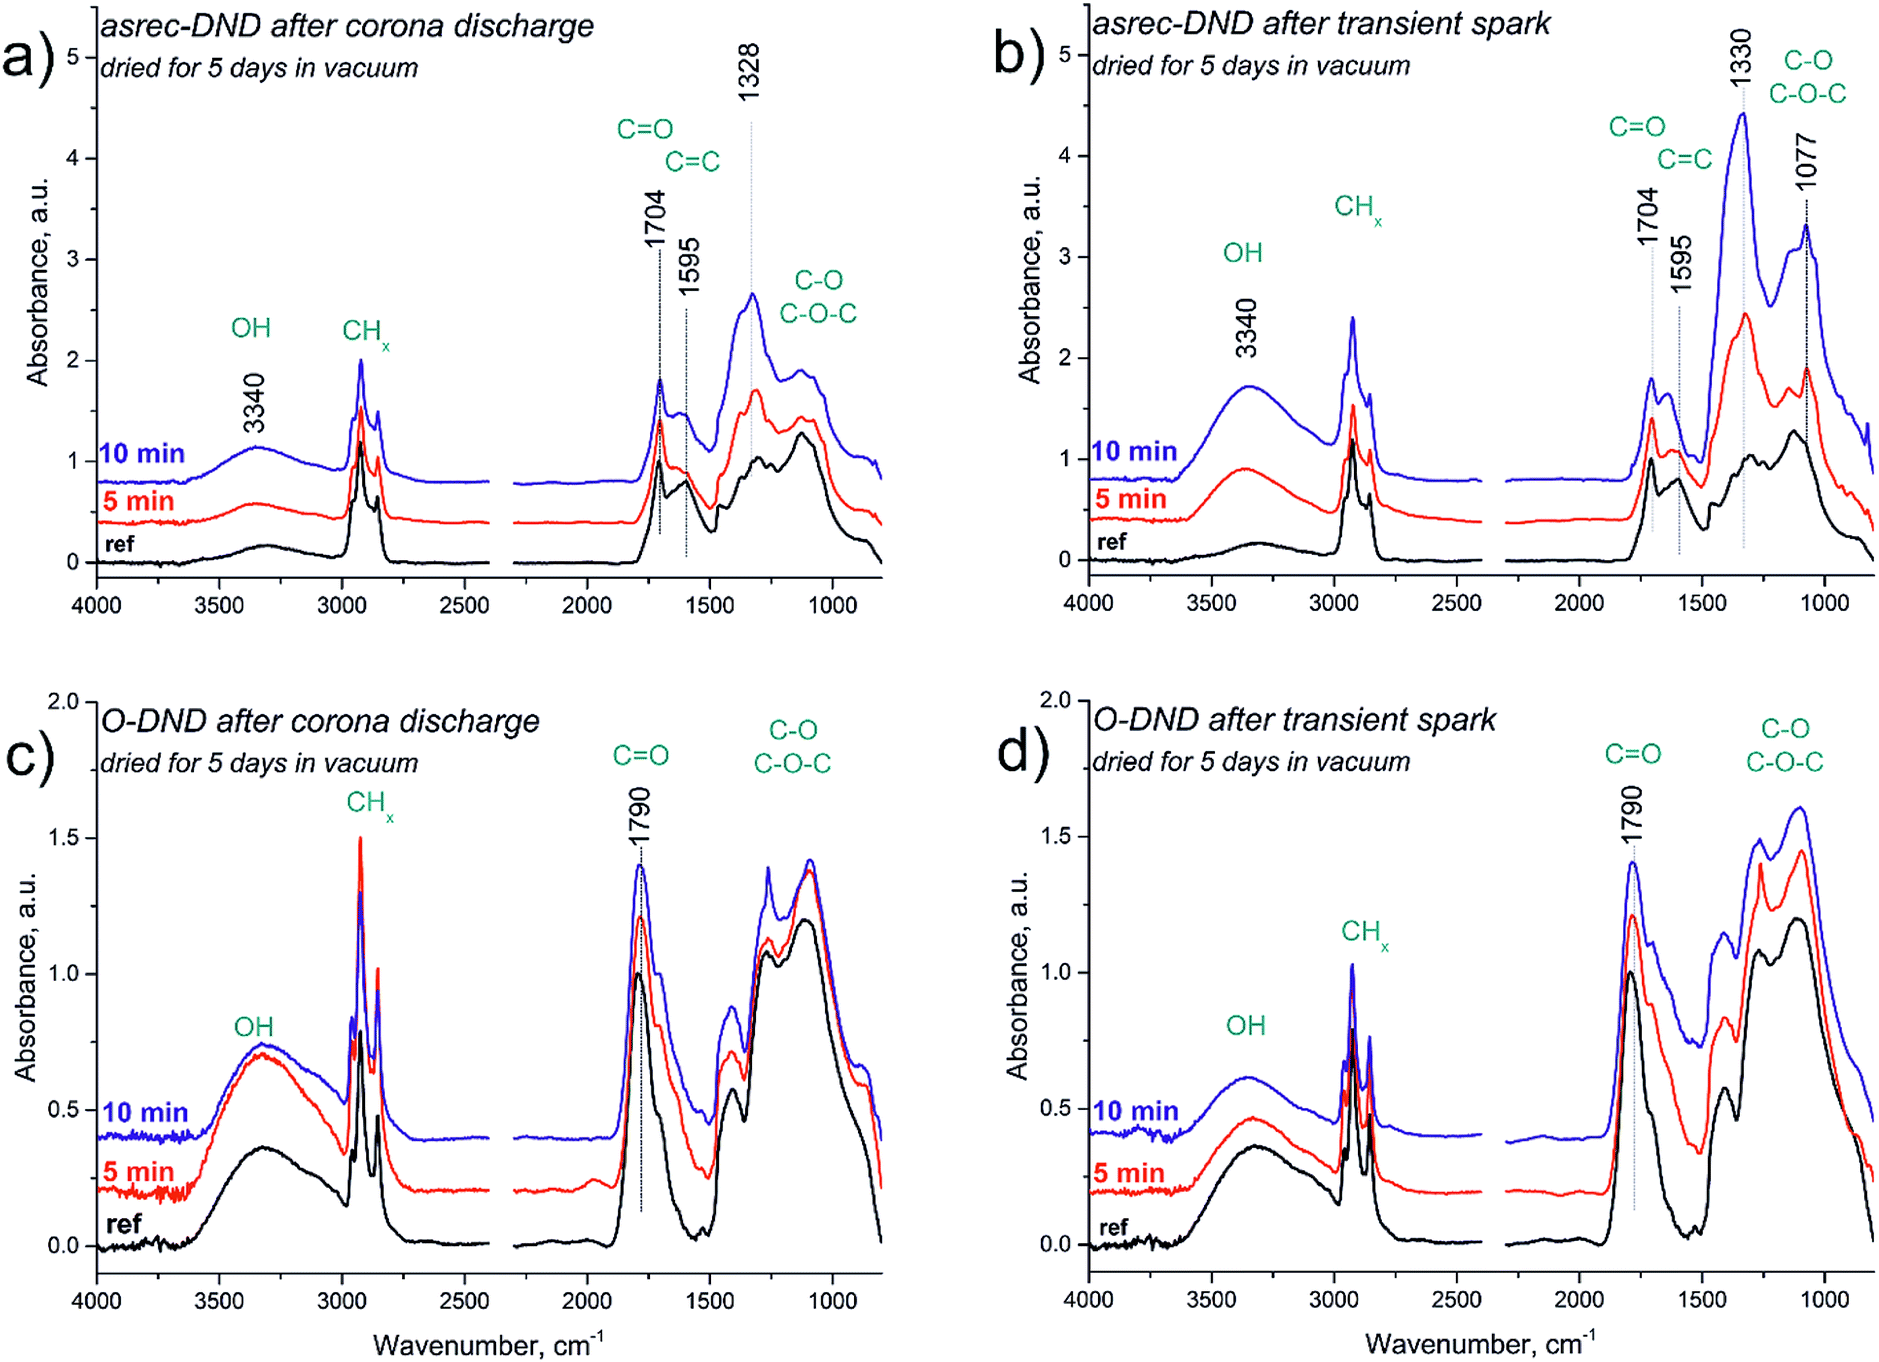 | ||
| Fig. 2 IR spectra of asrec-DNDs treated by corona discharge afterglow (a) and treated by transient spark discharge (b), and of O-DND treated by corona discharge (c) and transient spark discharge (d) afterglow. Spectra were normalized to the carbonyl band (1704 cm−1 in asrec-DNDs or 1790 cm−1 in O-DND) and Y offset shifted for better clarity. | ||
The reference spectrum of O-DND (Fig. 2c, black line) reveals a broad band at 3300 cm−1 belonging to –OH stretch of alcohol groups or carboxylic acids together with a strong band centred at 1790 cm−1 of carbonyl groups with a right shoulder at 1707 cm−1. A remarkable absorption feature at 1400–1000 cm−1 is related to various C–O and C–O–C vibrations typical for air-annealed samples. After the drying of DNDs in vacuum, sharp bands at 3000–2800 cm−1 are present in the spectra. Their origin will be further discussed. After the treatment by corona discharge afterglow (Fig. 2c) the spectrum does not undergo any significant changes. Only sharpening of the band at 1263 cm−1 can be observed in some cases. Spectra treated by the transient spark discharge afterglow (Fig. 2d) reveal mostly the same spectral features as the spectra after corona discharge. Thus, one can only mark some broadening of the carbonyl band to the lower wavenumbers up to 1550 cm−1.
Note, that IR spectra before applying the prolonged vacuum drying procedure are present in Fig. S1 in the ESI.† There the reference spectrum of asrec-DNDs contains several features of adsorbed water. Namely, sharp peak at 3690 cm−1 belonging to the free –OH stretch of water not influenced by hydrogen bonds. The broad –OH stretch at 3500–3000 cm−1 is clearly split into two maxima centred at 3330 cm−1 and 3200 cm−1 and broad –OH bending vibration was present at 1634 cm−1. The rest of the bands remained almost same. The sample treated by 10 or 15 kV for 10 minutes looked practically the same as samples before the drying procedure.
The reference spectrum of O-DND before drying in vacuum (Fig. S1†) revealed only traces of CHx groups at 3000–2800 cm−1. Other spectral features seemed to be quite independent on the drying procedure. The IR spectra of O-DND samples treated by DC discharge afterglow had distinct spectral features in the area 1630–1550 cm−1 prominent as several sharp bands. After the drying procedure these features disappeared. Changes in IR spectra of both asrec-DNDs and O-DNDs develop gradually as a function of the treatment time. On the other hand, spectral features in IR spectra caused by application of the higher voltage (and subsequent change to transient spark discharge) only slightly differ from those caused by corona afterglow.
The treated DNDs were stored in the original suspension under ambient air. As shown in Fig. 3, the spectra of neither asrec-DNDs nor O-DNDs showed any significant changes in position of the bands after 3 months.
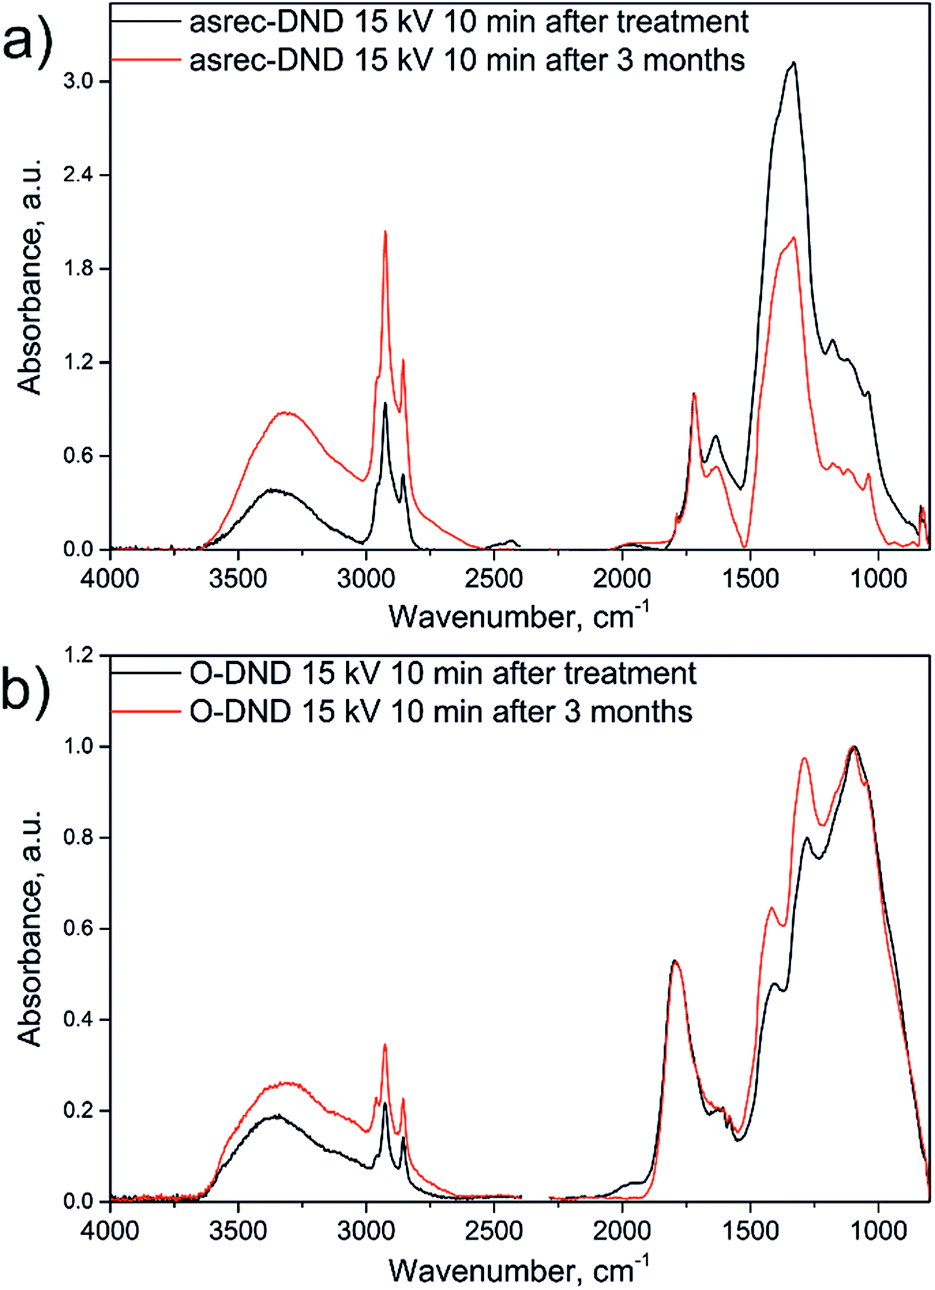 | ||
| Fig. 3 Comparison of IR spectra of asrec-DNDs (a) and O-DNDs (b) measured after the treatment and after 3 months storage. Spectra were normalized for better clarity. | ||
The Raman spectra revealed typical features for DNDs (see Fig. S2†). The band centred at approx. 1325 cm−1 is ascribed to the sp3 diamond structure and is redshifted with respect to the Raman mode of single crystal diamond (1332 cm−1).28 Additionally, broad bands corresponding to non-diamond phases were detected at ca. 1250 cm−1 and 1500–1800 cm−1 (G band).29 The Raman spectra of asrec-DNDs exhibit a higher content and obviously different composition of the non-diamond phase in comparison to O-DND samples. Spectra before and after the DC afterglow treatment did not show remarkable changes though.
Relative concentrations of atoms and chemical bonds of the reference and treated samples evaluated by XPS measurements are summarized in Table 1. The reference as well as treated asrec-DND samples show very similar concentration of atoms, where the major part of about 92 at% is represented by carbon atoms and about 5–6 at% by oxygen. Deconvolution of the O 1s peak (see Fig. S4†) shows that the samples had maximally 2% of water and that asrec-DNDs with hydrogen-related groups on the surface bind more water. The amount of water and difference between as-received and oxidized DNDs is in a good agreement with thermogravimetric analysis of DNDs in our prior work.30 Note, that 2–3 at% of nitrogen was found in each sample. This is related to impurities naturally found in detonation NDs.5 The reference sample of asrec-DNDs contains 45% of non-diamond sp2 phase estimated from deconvolution of C 1s peak, while sp3 phase is 46%. Less than 10% is represented by C–O and CO bonds. In the asrec-DND samples treated by DC discharge afterglow, the amount of sp2 phase slightly increases, while sp3 phase and C–O content decrease by few percent. The amount of carbonyl group remains constant at 2%.
| Sample name | O at% | C at% | N at% | sp2% | sp3% | C–O% | CO% |
CHx% |
|---|---|---|---|---|---|---|---|---|
| Asrec-DND reference | 6 | 92 | 2 | 45 | 46 | 7 | 2 | |
| Asrec-DND 10 kV 10 min | 5 | 92 | 3 | 52 | 40 | 6 | 2 | |
| Asrec-DND 15 kV 10 min | 6 | 92 | 2 | 50 | 43 | 5 | 2 | |
| O-DND reference | 11 | 86 | 3 | 7 | 75 | 6 | 5 | 7 |
| O-DND 10 kV 10 min | 10 | 88 | 2 | 2 | 81 | 7 | 4 | 6 |
| O-DND 15 kV 10 min | 10 | 88 | 2 | 3 | 78 | 9 | 5 | 6 |
After the air-annealing, the overall oxygen content in reference O-DND increased to 10 at%. From the deconvolution of C 1s peak the relative concentration of sp3 in the reference O-DND increased to 75%, while the sp2 phase dropped to 7% compared to the reference asrec-DND sample. Amount of C–O bond is 6% and 5% for CO.
The XPS analysis shows the same relative concentration of atoms before and after the plasma treatment. Both treatment types caused an additional decrease in sp2 phase down to 2% and a slight increase in sp3 phase. Content of C–O increased by 2, resp. 3%, and the content of CO remained almost constant as in the case of asrec-DNDs.
The samples were also characterized using DLS measurements providing us ζ-potential and hydrodynamic radius Rhyd. DLS results are summarized in Table 2. For non-filtered/non-centrifuged samples the average hydrodynamic radius was found to be about 106 nm for the reference asrec-DND sample and 91 nm for the reference O-DND sample. Hydrodynamic radius of treated samples of both origins is above the values of non-treated samples. The obtained hydrodynamic radius by DLS measurements reveals the formation of large objects, i.e. aggregates or clusters. After the plasma treatment the formation of aggregates was slightly enhanced, probably due to the rearrangement of surface functional groups as will be discussed below.
| Sample name | Rhyd, nm | ζ-Potential, mV | Sample name | Rhyd, nm | ζ-Potential, mV |
|---|---|---|---|---|---|
| Asrec-DND reference | 106 | 30 | O-DND reference | 91 | −34 |
| Asrec-DND 10 kV 5 min | 122 | 32 | O-DND 10 kV 5 min | 164 | −28 |
| Asrec-DND 10 kV 10 min | 164 | 32 | O-DND 10 kV 10 min | 164 | −21 |
| Asrec-DND 15 kV 5 min | 164 | 31 | O-DND 15 kV 5 min | 142 | −24 |
| Asrec-DND 15 kV 10 min | 190 | 30 | O-DND 15 kV 10 min | 190 | −12 |
ζ-Potentials of both reference and treated asrec-DNDs showed positive values. Values of ζ-potential after the treatment of asrec-DNDs does not change and remains close to 30 mV. Untreated O-DNDs revealed a negative value around −34 mV. The negative ζ-potential is an indication of the successful annealing and is related to the increased oxygen content.5 After applying treatment for 10 minutes the value of ζ-potential increased to −21 mV and up to −12 mV for 10 kV and 15 kV, respectively. Still, the ζ-potential of treated O-DND samples remained negative indicating a higher oxygen content on their surface compared to asrec-DNDs.
ζ-Potentials are considered to be good indicators of stable or unstable colloidal systems.31 The situation is more complex with nanodiamonds though. We cannot agree with the conclusion that DND colloids with 30 mV or lower ζ-potential are unstable. It also depends on their surface chemistry and other properties. For instance, Williams et al.27 showed that H-DNDs and O-DNDs can have similar ζ-potential of about 30 mV (albeit opposite sign) around neutral pH yet H-DND colloid remains stable long time while O-DND colloid aggregates and sediments. This effect was observed in our samples as well. We were even able to enhance this effect for formation on long nanodiamond filaments.21 So far it has been only hypothesized about various factors that can cause this effect: surface charge, capillary forces, specific surface chemistry.32
4 Discussion
The obtained results show that the established setup allows the surface modification of liquid-dispersed nanomaterial just by the discharge afterglow. As the discharge was sustained above the DND suspension, the suspension was indirectly treated by reactive species generated by plasma in ambient air. Afterglow production of different types of reactive species in water, their concentration and reactivity were recently described elsewhere.33,34 We expect mainly presence of reactive oxygen species (ROS – ozone, singlet oxygen, OHx radicals) and reactive nitrogen species (RNS – NOx radicals). Our setup allowed easy modification of the discharge type from mild corona to more aggressive transient spark discharge at higher applied voltage. Similarly to the results of Kromka et al.19 we expected more powerful and subsequently faster modification of DND suspension by applying higher voltage. This effect was not observed in our experiments. Based on the IR spectra, the changes in surface chemistry of DNDs seems to be independent to the discharge type or the treatment time. By the presented setup one can avoid the decomposition of the liquid media as in the case of underwater discharge. Moreover this method allows the modification of lower amounts of suspension, as the high amount of liquid media is not necessary for cooling down the system. Additional advantage can be seen in no need of salt addition for maintaining the conductivity of the suspension as in the case of underwater discharge.33Based on IR measurements, supported by XPS and DLS analysis, the afterglow discharge treatments have following effects: after the normalization of asrec-DNDs spectra on the carbonyl band centred at 1704 cm−1 there are practically no significant changes in the band positions within the area of functional groups up to 1750 cm−1. Disappearance of the band at 1595 cm−1 indicates the removal of the CC double bonds. During the plasma processes in aqueous conditions, the OH radical can be attached to the CC double bond as well as to the CH3 group. This process is most probably present in our case and is proven by presence of OH stretch at 3340 cm−1 as well as newly formed C–O stretch at 1637 cm−1 and C–O bending below 1250 cm−1. In the case of transient spark discharge afterglow, the spectra are also enriched by sharp maximum at 1077 cm−1. According to the literature,35,36 this band can be attributed to C–O bending of alcohols as well as CHx bending or even absorption of nitrogen-containing moieties. The most prominent change reflected in the IR spectra of asrec-DNDs treated by both types of afterglow is the strong enhancement of the broad band with maximum at approx. 1330 cm−1 relatively to CO stretch and CHx stretching. Usually, this band is active in Raman spectra and belongs to the sp3 diamond core. In IR spectra it is commonly ascribed to the nitrogen defects within the nanodiamond particle. Totally symmetric –C–C– or –CC– bonds should not be active in the IR spectra. If the band at 1330 cm−1 will be ascribed to the nitrogen defects in diamond lattice vibrations, it has to be somehow enhanced by the afterglow treatment. The nitrogen defects might be sensitive to the surface changes, as was already observed by fluorescence changes of NV centers.8
Providing an additional drying procedure in vacuum on reference and treated asrec-DNDs indicated, that the reference sample strongly adsorbs water molecules and thus the spectra were disturbed by specific stretching and bending vibration of these water molecules. On the other side, the treated asrec-DNDs revealed almost the same spectral bands before and after additional drying procedure. Only minor changes were recognized. This dependence should be assigned to successful modification of surface groups onto the nanodiamond particles after the plasma afterglow treatment. As the XPS spectra revealed the same atomic composition, the changes must be assigned to rearrangement of surface functional groups rather than to the direct oxidation of the particles. As the content of CO bonds estimated from C 1s peak deconvolution remained constant, the changes are supposed to proceed only at lower oxidation states, that means alcohol or ether groups.
Kozak et al.22 used radio-frequency microplasma jetting and pulsed laser irradiation plasma for treatment of the asrec-DNDs. The IR spectra before and after the treatment revealed the same spectral bands and only changes in their intensities were observed. Moreover, the CHx groups were not affected at all. Still, in the work of Kozak et al.22 additional drying in vacuum for 3 days was required to recognize surface changes in the IR spectra. Yet, in our case the changes on treated asrec-DNDs are clearly detectable without additional drying before measurements. These findings lead us to conclusion, that the surface modification of the asrec-DNDs in liquid suspension by atmospheric DC discharge afterglow is more efficient than the modifications by radio-frequency plasma or pulsed laser irradiation treatments.
O-DND FTIR spectra normalized on the carbonyl (CO) band centred around 1790 cm−1 did not reveal any significant changes in the surface functional groups after the treatment by plasma afterglow. Noticeable may be only a small variations of the band centred at 1260 cm−1. This band is usually attributed to ether-like C–O–C or stretching of C–O triangle epoxy groups.37 Slight increase of C–O bond by 2, resp. 3% was also proven by XPS results.
The prolonged vacuum drying procedure uncovered several interesting effects. First, the carbonyl band is contributed by the band centred at 1707 cm−1 and thus at least two carbonyl-type species are present in the air-annealed O-DND. Second, absorption bands at 1625, 1604 and 1580 cm−1 (Fig. S1†), which were present in FTIR spectra of O-DND dried on a hotplate disappeared. These bands might be attributed to some non-covalently attached hydrocarbons or aromatic contaminants from ambient air, which were removed during the vacuum drying. Nevertheless, they did not probably affect ζ-potential as the intensity of FTIR bands does not correlate with the ζ-potential trend. Third, there are very strong CHx stretches (3000–2800 cm−1) in the FTIR spectra of O-DNDs (Fig. 2), which were not present before drying in vacuum. Similarly, new components were also observed in the deconvoluted XPS C 1s band centered at 282.7 eV. The overall content of this component is around 6% in all types of O-DND samples.
This is a specific feature for O-DNDs that was not observed on asrec-DNDs or reference gold substrate (see Fig. S5†) going through the same process. About 32 at% of carbon was detected by XPS on the reference Au substrate without detectable feature at 282.7 eV. Hence, this band cannot be merely attributed to a common contamination.
The pronounced feature at 282.7 eV in XPS and pronounced CHx peaks in FTIR were observed only after prolonged drying of O-DNDs in UHV vacuum heated up to 300 °C. Thus lack of water is essential for observation of this effect. Due to the high intensity of the CHx peaks in FTIR spectra of O-DND, which is even higher than in asrec-DNDs, masking of these vibrations in the samples dried only on a hotplate by water is not very probable.
On other carbon-based materials, similar XPS feature was attributed to small hydrocarbon fractions or atomic carbon dissociated from carbon oxide.38 Thus the O-DND may exhibit a unique catalytic activity towards dissociation of carbon species, in this case those from ambient air, if their surface is exposed and not covered by water.
5 Conclusions
We investigated the influence of the atmospheric DC discharge afterglow treatment on the surface modification of diamond nanoparticles dispersed in water. We found that the afterglow plasma treatment changed both oxygen-containing groups as well as CHx groups on the asrec-DNDs, as reflected in the IR spectra. Based on correlation of the IR spectra with XPS, Raman and DLS measurements we conclude that the afterglow plasma treatment did not change the diamond core and induced rearrangement of surface functional groups rather than direct oxidation or reduction processes. At the same time, ζ-potential remained constant (30 mV). Contrary, surface chemistry of O-DNDs prepared by annealing in air was resistant against the afterglow treatment yet revealed a clear trend in the ζ-potential (change up to 22 mV). In addition, after the long-term drying of O-DNDs in vacuum, pronounced adsorption of hydrocarbon fractions was detected by IR and XPS spectra. That is a specific feature that was not observed on asrec-DNDs or reference gold samples going through the same process. Hence it cannot be a mere contamination and O-DND may thus provide interesting catalytic properties towards hydrocarbons.In comparison to treatment by other plasma methods, such as DCSBD discharge, LI or RF plasma, the atmospheric DC discharge afterglow caused pronounced changes on surface groups at much shorter times. Thus the afterglow plasma setup allows a low-cost and fast treatment of ND particles dispersed in a liquid medium at room temperature and atmospheric pressure with possibility to control the gas atmosphere. The hollow-cathode geometry provides a strong ion flux during the afterglow plasma treatment which perfectly stirs the sample and, at the same time, does not chemically or thermally damage nanoparticles. Thus volumes of up to 1 ml could be simply processed without additional mixing apparatus.
Acknowledgements
This work was supported by the Czech Science Foundation under the grant no. 15-01687S and the student grant Czech Technical University in Prague (the grant no. SGS16/223/OHK3/3T/13) and the regional development project CZ.02.1.01/0.0/0.0/15003/0000464 (MSMT). T. Izak and K. Kuldová are gratefully acknowledged for the Raman spectra measurements and R. Yatskiv for DLS measurements.References
- K.-K. Liu, C.-C. Wang, C.-L. Cheng and J.-I. Chao, Biomaterials, 2009, 30, 4249–4259 CrossRef CAS PubMed.
- H. G. Zanin, A. C. Peterlevitz, R. F. Teófilo, H. J. Ceragioli and V. Baranauskas, Ferroelectrics, 2012, 436, 96–100 CrossRef CAS.
- J. Cardellino, N. Scozzaro, M. Herman, A. J. Berger, C. Zhang, K. C. Fong, C. Jayaprakash, D. V. Pelekhov and P. C. Hammel, Nat. Nanotechnol., 2014, 9, 343–347 CrossRef CAS PubMed.
- V. V. Danilenko, Phys. Solid State, 2004, 46, 595–599 CrossRef CAS.
- A. Schrand, S. A. C. Hens and O. Shenderova, Crit. Rev. Solid State Mater. Sci., 2009, 34, 18–74 CrossRef CAS.
- S. Stehlik, M. Varga, M. Ledinsky, V. Jirasek, A. Artemenko, H. Kozak, L. Ondic, V. Skakalova, G. Argentero, T. Pennycook, J. C. Meyer, A. Fejfar, A. Kromka and B. Rezek, J. Phys. Chem. C, 2015, 119, 27708–27720 CAS.
- A. Stacey, T. J. Karle, L. P. McGuinness, B. C. Gibson, K. Ganesan, S. Tomljenovic-Hanic, A. D. Greentree, A. Hoffman, R. G. Beausoleil and S. Prawer, Appl. Phys. Lett., 2012, 100, 071902 CrossRef.
- V. Petráková, A. Taylor, I. Kratochvílová, F. Fendrych, J. Vacík, J. Kučka, J. Štursa, P. Cígler, M. Ledvina, A. Fišerová, P. Kneppo and M. Nesládek, Adv. Funct. Mater., 2012, 22, 812–819 CrossRef.
- O. A. Shenderova, V. V. Zhirnov and D. W. Brenner, Crit. Rev. Solid State Mater. Sci., 2002, 27, 227–356 CrossRef CAS.
- A. Krueger, Adv. Mater., 2008, 20, 2445–2449 CrossRef CAS.
- Y. Liang, M. Ozawa and A. Krueger, ACS Nano, 2009, 3, 2288–2296 CrossRef CAS PubMed.
- T. Jiang, K. Xu and S. Ji, J. Chem. Soc., Faraday Trans., 1996, 92, 3401 RSC.
- Y. Liu, Z. Gu, J. L. Margrave and V. N. Khabashesku, Chem. Mater., 2004, 16, 3924–3930 CrossRef CAS.
- K. B. Holt, C. Ziegler, D. J. Caruana, J. Zang, E. J. Millán-Barrios, J. Hu and J. S. Foord, Phys. Chem. Chem. Phys., 2008, 10, 303–310 RSC.
- H. A. Girard, J. C. Arnault, S. Perruchas, S. Saada, T. Gacoin, J.-P. Boilot and P. Bergonzo, Diamond Relat. Mater., 2010, 19, 1117–1123 CrossRef CAS.
- Q. Yu, Y. J. Kim and H. Ma, Appl. Phys. Lett., 2006, 88, 231503 CrossRef.
- D. Medvedev, D. Sapunov, B. Potapkin and S. Korobtsev, Appl. Phys. A, 2012, 108, 275–281 CrossRef CAS.
- H. Kozak, Z. Remes, J. Houdkova, S. Stehlik, A. Kromka and B. Rezek, J. Nanopart. Res., 2013, 15, 1568 CrossRef.
- A. Kromka, J. Čech, H. Kozak, A. Artemenko, T. Ižák, J. Čermák, B. Rezek and M. Černák, Phys. Status Solidi B, 2015, 252, 2602–2607 CrossRef CAS.
- V. Jirásek, J. Čech, H. Kozak, A. Artemenko, M. Černák and A. Kromka, Phys. Status Solidi A, 2016, 213, 2680–2686 CrossRef.
- V. Jirásek, P. Lukeš, H. Kozak, A. Artemenko, M. Člupek, J. Čermák, B. Rezek and A. Kromka, RSC Adv., 2016, 6, 2352–2360 RSC.
- H. Kozak, A. Artemenko, J. Čermák, V. Švrček, A. Kromka and B. Rezek, Vib. Spectrosc., 2016, 83, 108–114 CrossRef CAS.
- M. Khanal, V. Turcheniuk, A. Barras, E. Rosay, O. Bande, A. Siriwardena, V. Zaitsev, G.-H. Pan, R. Boukherroub and S. Szunerits, Langmuir, 2015, 31, 3926–3933 CrossRef CAS PubMed.
- O. Shenderova, I. Petrov, J. Walsh, V. Grichko, V. Grishko, T. Tyler and G. Cunningham, Diamond Relat. Mater., 2006, 15, 1799–1803 CrossRef CAS.
- S. Osswald, G. Yushin, V. Mochalin, S. O. Kucheyev and Y. Gogotsi, J. Am. Chem. Soc., 2006, 128, 11635–11642 CrossRef CAS PubMed.
- S. Stehlik, M. Varga, M. Ledinsky, D. Miliaieva, H. Kozak, V. Skakalova, C. Mangler, T. J. Pennycook, J. C. Meyer, A. Kromka and B. Rezek, Sci. Rep., 2016, 6, 38419 CrossRef CAS PubMed.
- O. A. Williams, J. Hees, C. Dieker, W. Jäger, L. Kirste and C. E. Nebel, ACS Nano, 2010, 4, 4824–4830 CrossRef CAS PubMed.
- T. Jiang and K. Xu, Carbon, 1995, 33, 1663–1671 CrossRef CAS.
- A. C. Ferrari and J. Robertson, Phys. Rev. B, 2001, 64, 075414 CrossRef.
- S. Stehlik, T. Glatzel, V. Pichot, R. Pawlak, E. Meyer, D. Spitzer and B. Rezek, Diamond Relat. Mater., 2016, 63, 97–102 CrossRef CAS.
- N. Gibson, O. Shenderova, T. J. M. Luo, S. Moseenkov, V. Bondar, A. Puzyr, K. Purtov, Z. Fitzgerald and D. W. Brenner, Diamond Relat. Mater., 2009, 18, 620–626 CrossRef CAS.
- V. N. Mochalin, O. Shenderova, D. Ho and Y. Gogotsi, Nat. Nanotechnol., 2011, 7, 11–23 CrossRef PubMed.
- P. Bruggeman and C. Leys, J. Phys. D: Appl. Phys., 2009, 42, 053001 CrossRef.
- Z. C. Liu, D. X. Liu, C. Chen, D. Li, A. J. Yang, M. Z. Rong, H. L. Chen and M. G. Kong, J. Phys. D: Appl. Phys., 2015, 48, 495201 CrossRef.
- E. V. Sokolenko, Inorg. Mater., 2014, 50, 246–252 CrossRef CAS.
- G. A. Inel, E.-M. Ungureau, T. S. Varley, M. Hirani and K. B. Holt, Diamond Relat. Mater., 2016, 61, 7–13 CrossRef CAS.
- V. Y. Osipov, A. E. Aleksenskiy, A. I. Shames, A. M. Panich, M. S. Shestakov and A. Y. Vul', Diamond Relat. Mater., 2011, 20, 1234–1238 CrossRef CAS.
- A. Grüneis, K. Kummer and D. V. Vyalikh, New J. Phys., 2009, 11, 073050 CrossRef.
Footnote |
| † Electronic supplementary information (ESI) available. See DOI: 10.1039/c7ra04167e |
| This journal is © The Royal Society of Chemistry 2017 |