
 Open Access Article
 This Open Access Article is licensed under a
 Creative Commons Attribution 3.0 Unported Licence
MOF-derived Co/ZnO@silicalite-1 photocatalyst with high photocatalytic activity
Xiaobing Yang†
a,
Juan Chen†b,
Huixian Laic,
Jiapeng Hua,
Ming Fangd and
Xuetao Luo *c
*c
aCollege of Ecology and Resource Engineering, Wuyi University, Wuyishan, Fujian 354300, China
bDepartment of Pharmacy, Zhongshan Hospital, Xiamen University, Xiamen, 361004, China
cFujian Key Laboratory of Advanced Materials, College of Materials, Xiamen University, Xiamen, 361005, China. E-mail: xuetao@xmu.edu.cn
dShaoxing Testing Institute of Quality and Technical Supervision, Shaoxing, Zhejiang 312366, China
First published on 7th August 2017
Abstract
Metal doped ZnO supported on porous materials have unique and highly attractive properties and have drawn worldwide attention. Herein, we explored the synthesis of Co/ZIF-8@silicalite-1 catalysts containing different amounts of Co by using metal organic frameworks as precursors and silicalite-1 as support. Then Co/ZIF-8@silicalite-1 catalysts were calcined at 550 °C to prepare the Co/ZnO@silicalite-1 photocatalysts. All samples were characterized by XRD, SEM, FT-IR and UV-vis diffuse reflectance spectra. The results show that the doping Co can increase the particle size of Co/ZIF-8 and decrease the content of Zn in Co/ZIF-8@silicalite-1. When ZnO@silicalite-1 is doped with Co from 0% to 20%, its band gap absorption is extended from 380 to 480 nm and a new band gap absorption at about 720 nm appears. The photocatalystic properties were investigated by degradation of rhodamine B (RhB) aqueous solution under UV light. In the series of Co/ZnO@silicalite-1 photocatalysts, 5Co/ZnO@silicalite-1 shows the highest photocatalytic efficiency.
1. Introduction
In the past few years, semiconductor photocatalysts has attracted much attention as photocatalytic material in various organic pollution degradation and antimicrobial application.1 Until now, many semiconductor photocatalysts have been reported, such as TiO2,2 Ag3PO4,3 SnO,4 WO3,5 Bi2O3,6 and ZnO.7 Among the various semiconductor photocatalysts, ZnO has been widely studied and extensively used in solar cells, photocatalysis, environmental remediation, and piezoelectric nanogenerators due to its high photocatalytic efficiency, excellent oxidative capacity, chemical stability, low cost and environmental sustainability.8With the rapid development of science and technology, it is important to improve the photocatalytic activity of ZnO. The photocatalytic activity of ZnO is influenced by many factors. The most important factors are band gap and electron–hole pair recombination. Both of them are all affected by the particle size of the catalyst. For example, the photocatalytic reactions mainly occurred at the interface between the catalyst surfaces and organic pollutants. When ZnO catalyst is nanosized, it can provide more surface area for the photocatalytic reactions. Further more, the recombination rate of the electron–hole pair in large size catalyst particles is higher than in small size catalyst particles.9 So many researchers have made effects to prepare the ZnO nanoparticles.10–13 However, the small size catalyst particles are easily to aggregate together and difficult to recycle. This restricts its application in photocatalytic systems. As a result, many researchers have made attempts to immobilize ZnO nanoparticles on solid support materials to overcome these drawbacks by synergistic effects, such as bentonite,14 graphene,15 glass,16 stainless steel,17 and zeolite.18
In the tradition research, the band gap of ZnO is 3.2 eV. It indicates that ZnO can be excited to produce the electron–hole pair to degrade the organic pollution under UV irradiation.19 In order to improve the photocatalytic activity of ZnO, many strategies have been used. For example, doping some ions on ZnO is a useful way, such as Cr,20 Fe,21 Cu,22 Ag,23 and Co.24 When ZnO is doped with some ions, it has more defects in its surface layer, which can make the photogenerated electrons and holes separation effectively.
In the last few years, metal–organic frameworks (MOFs), with the remarkable characteristics of well-defined channels and cavities of regular size and shape, have been widely studied and used for gas storage,25,26 small molecule separations,27 chemical catalysis and drug delivery,28,29 due to its large internal surface areas, uniform channels, (sub)nanometer-sized cavities, high thermal and chemical stability.30–34 Some attempts also have been made to explore the semiconducting properties of MOFs. Lin et al. suggested that band gaps of MOFs are between 1.0 and 5.5 eV.35,36 Bordiga et al. demonstrated that MOFs behave as metal oxide quantum dots.36 Zeolitic imidazolate frameworks (ZIFs), as a subfamily of metal organic frameworks (MOFs), are consisted of tetrahedral divalent metal ions (Zn2+, Co2+) and an imidazole derivative.37,38 For example, Zn2+ can be connected by imidazolate linkers to form ZIF-8.39 And ZIF-67 is consisted of Co and imidazole.40 Zn and Co also can be linked together by imidazolate linkers to form Co/ZIF-8.41 However, up to now, there are still no reports that use MOFs as precursor to synthesize the Co co-doped ZnO with porous structure by self-doping. In this work, we used silicalite-1 as support to load the Co/ZIF-8 nanoparticles on its surface and synthesized the Co/ZnO@silicalite-1 photocatalyst by sintering method. Then we explored the influence of Co doping for the photocatalyst and the performance of Co/ZnO@silicalite-1 by degradation rhodamine B solution.
2. Experimental
2.1 Chemicals
Zinc nitrate hexahydrate (Zn(NO3)2·6H2O, 98%), cobalt nitrate hexahydrate (Co(NO3)2·6H2O, 99%), 2-methylimidazole (99%) and methanol (99%) were purchased from Sinopharm Chemical Reagent Co. Ltd. All chemicals were used as received without further purification. Deionized water was used throughout the experiments.2.2 Synthesis of Co/ZIF-8@silicalite-1 and Co/ZnO@silicalite-1
A series of Co/ZIF-8@silicalite-1 doped with different amount of Co were synthesized using a modification of a previously known procedure.24 The synthesis protocol for 5Co/ZIF-8@silicalite-1 will be provided as an example. 20 mmol g Zn(NO3)2·6H2O and 1 mmol Co(NO3)2·6H2O was dissolved into methanol (100 ml) containing 2 g silicalite-1. And 100 ml methanol containing 80 mmol 2-methylimidazole was added under agitation. After 30 min, the solution was centrifuged and dried at 40 °C. The process of preparing Co/ZIF-8@silicalite-1 is shown in Fig. 1. 2Co/ZIF-8@silicalite-1, 10Co/ZIF-8@silicalite-1 and 20 Co/ZIF-8@silicalite-1 were synthesized by the same procedure. In order to remove the organic parts of Co/ZIF-8, Co/ZIF-8@silicalite-1 was directly carbonized at 550 °C for 2 h under air atmosphere to prepare the Co/ZnO@silicalite-1 photocatalyst.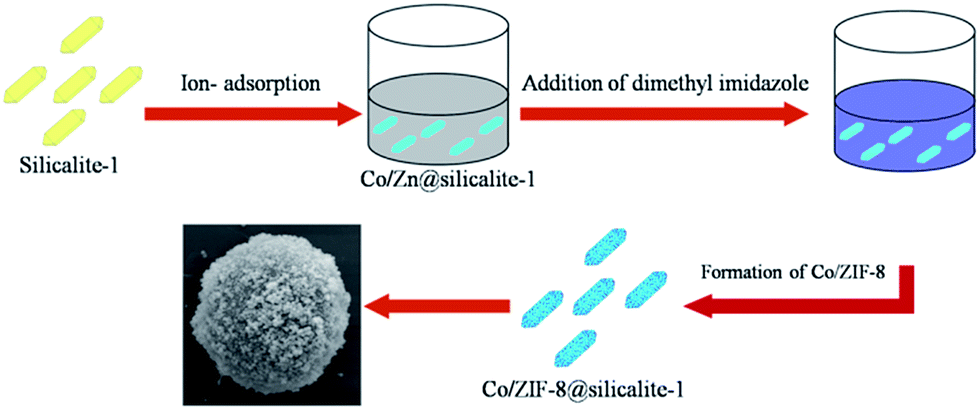 | ||
| Fig. 1 The process of preparing Co/ZIF-8@silicalite-1. | ||
2.3 Characterization of the products
The morphology of all samples was observed on a Hitachi SU70 scanning microscope at accelerating voltage of 10 kV. The phase of the samples was tested by X-ray powder diffraction (XRD) on a Bruker-AxsD8 diffractometer using Cu-Kα radiation in the angular range (2θ) from 5 to 60°, operated at 40 kV and 40 mA with a scanning rate of 1°/min. The nitrogen adsorption–desorption isotherms were measured by TriStar at 77 K after degassing the samples at 200 °C for 2 h. Special surface areas were calculated from the results obtained for the nitrogen adsorption–desorption isotherms, according to Brunauer Emmett Teller (BET) equation. UV-vis absorption spectra of the Reactive Brilliant Red X-3B solution were determined using a UV-1901 UV-visible spectrophotometer.2.4 Catalytic activity testing
The catalytic activity of all samples was tested by degradation of rhodamine B (RhB) solution in an inclosed box. In the inclosed box, a 300 W lamp (irradiating UV light, λ < 400 nm) was immobilized on the top and a magnetic stirrer was fixed at the bottom. The distance between the light and the reactor is 10 cm. In each experiment, 100 ml of rhodamine B aqueous solution (5 mg L−1) containing 0.2 g of catalyst was put into the reactor. Before the photocatalytic test was initiated, the solution was stirred continuously in the dark conditions for 30 min to ensure the adsorption–desorption equilibrium between RhB and the catalyst. Then, the UV light was turned on. During this irradiating time, five milliliters of the solution was withdrawn from the reactor every fifteen minutes and centrifuged to remove the photocatalyst before measuring to determine the residual dye concentration in solution. The fractional degradation efficiency (DR) of RhB can be calculated by the following equation:where C0 is the initial concentration of RhB and Ct is the concentration at a definite interval of time, respectively.
3. Results and discussion
The formation mechanism of Co/ZIF-8@silicalite-1 is shown in Fig. 2. In our previous work, it can be known that silicalite-1 has high surface area.42 And there are lots of pores in its structure, which are about 0.55 nm. When silicalite-1 disperses in ethanol containing Co2+ and Zn2+, it can absorb Co2+ and Zn2+ in its pores and surface (Co2+/Zn2+@silicalite-1). Then, dimethyl imidazole (2MI) is added into the ethanol and mixed with Co2+/Zn2+@silicalite-1, it can combine the Co2+ and Zn2+ absorbed in the surface of silicalite-1 and format Co/ZIF-8 structure on the surface of silicalite-1.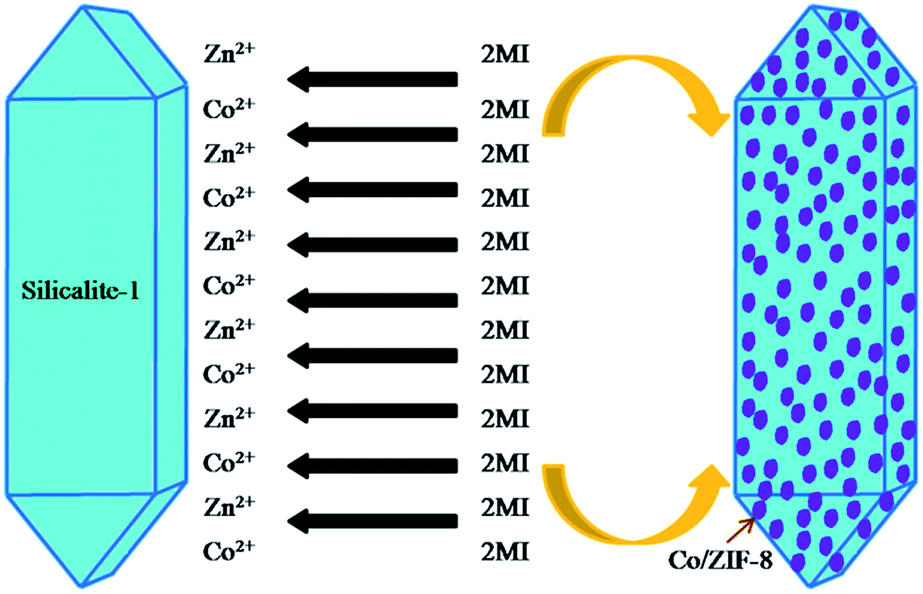 | ||
| Fig. 2 The formation mechanism of Co/ZIF-8@silicalite-1. | ||
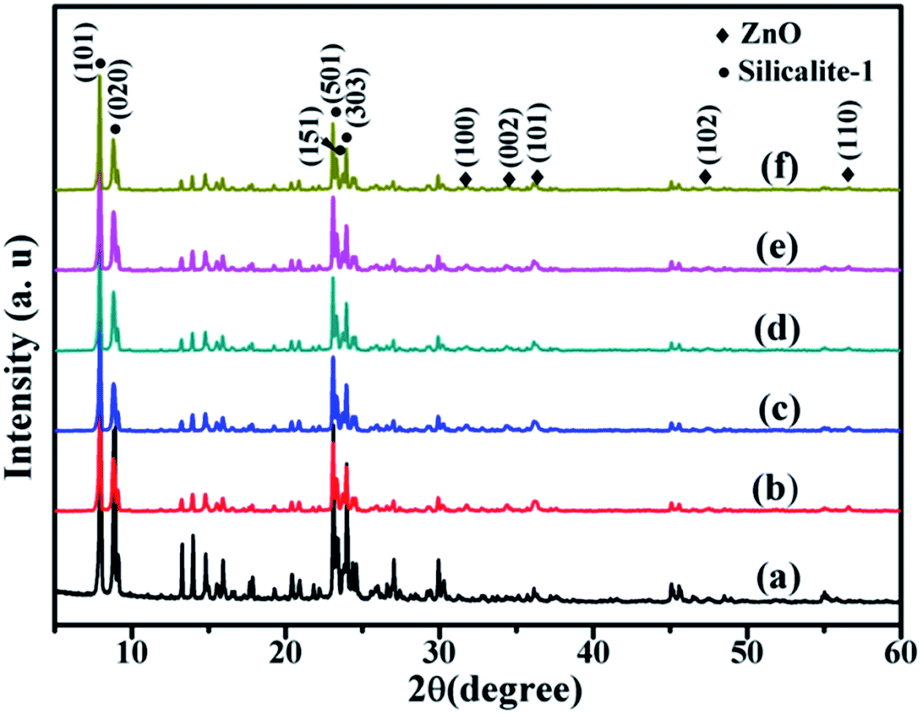
Fig. 3 is the XRD patterns of Co/ZIF-8@silicalite-1 catalysts. Fig. 3a is the XRD patterns of silicalite-1. From Fig. 3a, it can be seen that silicalite-1 shows characteristic peaks at 7.98°, 8.82°, 13.24°, 13.94°, 14.80°, 15.53°, 15.89°, 17.79°, 20.37°, 23.18° and 24.46°, which are ascribable to (101), (020), (300), (012), (301), (202), (040), (031), (501), (151) and (303) reflections of silicalite-1 (JCPDS: 48-0136).43 Fig. 3b is the XRD patterns of ZIF-8@silicalite-1. It can be seen that ZIF-8@silicalite-1 exhibits new peaks at 14.73°, 16.45°, 18.06°, which are ascribable to (101), (002), (112) reflections of ZIF-8 (JCPDS: 89-3739).44 Fig. 3c and e–g are the XRD patterns of 2Co/ZIF-8@silicalite-1, 5Co/ZIF-8@silicalite-1, 10Co/ZIF-8@silicalite-1 and 20Co/ZIF-8@silicalite-1. It can be seen that the diffraction peaks of Co/ZIF-8@silicalite-1 doping with different amounts of Co are almost the same with ZIF-8@silicalite-1. It indicates that the doping of Co does not change the diffraction peaks of ZIF-8@silicalite-1.
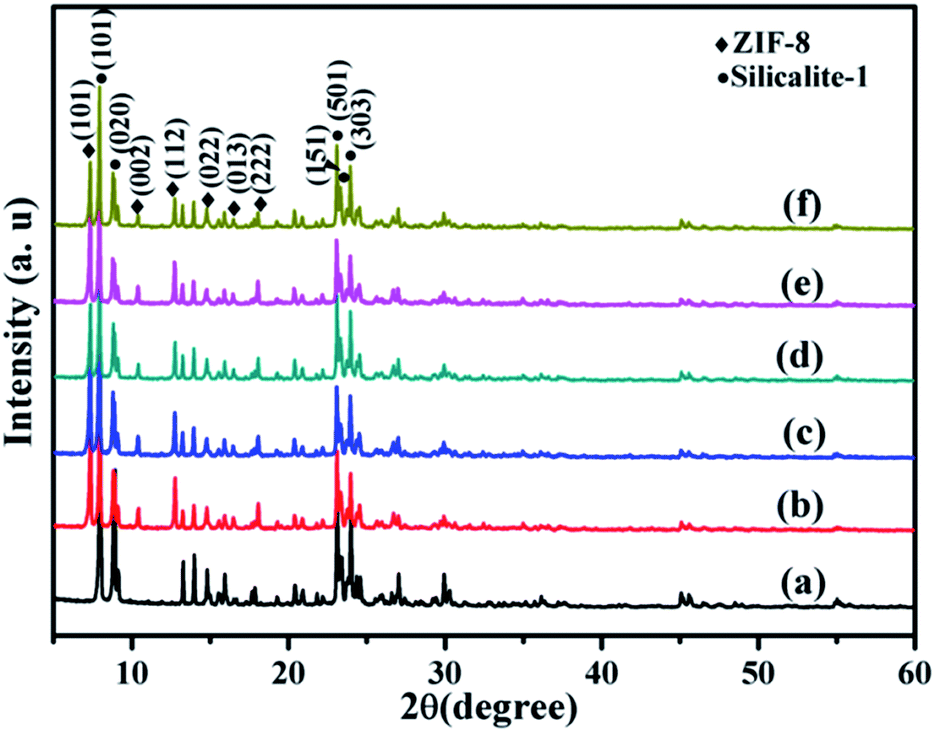 | ||
| Fig. 3 XRD patterns of (a) silicalite-1, (b) ZIF-8@silicalite-1, (c) 2Co/ZIF-8@silicalite-1, (d) 5Co/ZIF-8@silicalite-1, (e) 10Co/ZIF-8@silicalite-1, (f) 20Co/ZIF-8@silicalite-1. | ||
Fig. 4 is the SEM images of ZIF-8@silicalite-1 and Co/ZIF-8@silicalite-1 samples. Fig. 4a is the SEM images of ZIF-8@silicalite-1. It can be seen that the surface of silicalite-1 is coated with a layer of ZIF-8 nanoparticles. The high magnification image (Fig. 4b) shows that ZIF-8 nanoparticles, with a narrow size distribution ranging from 100 to 200 nm, are clearly observed. Fig. 4c–f are the high magnification images of 2Co/ZIF-8@silicalite-1, 5Co/ZIF-8@silicalite-1, 10Co/ZIF-8@silicalite-1, 20Co/ZIF-8@silicalite-1. It can be seen that when the content of Co increase from 0 to 20, the average size of Co/ZIF-8 increases from 150 to 350 nm. It is in accordance with Zaręba's report.41
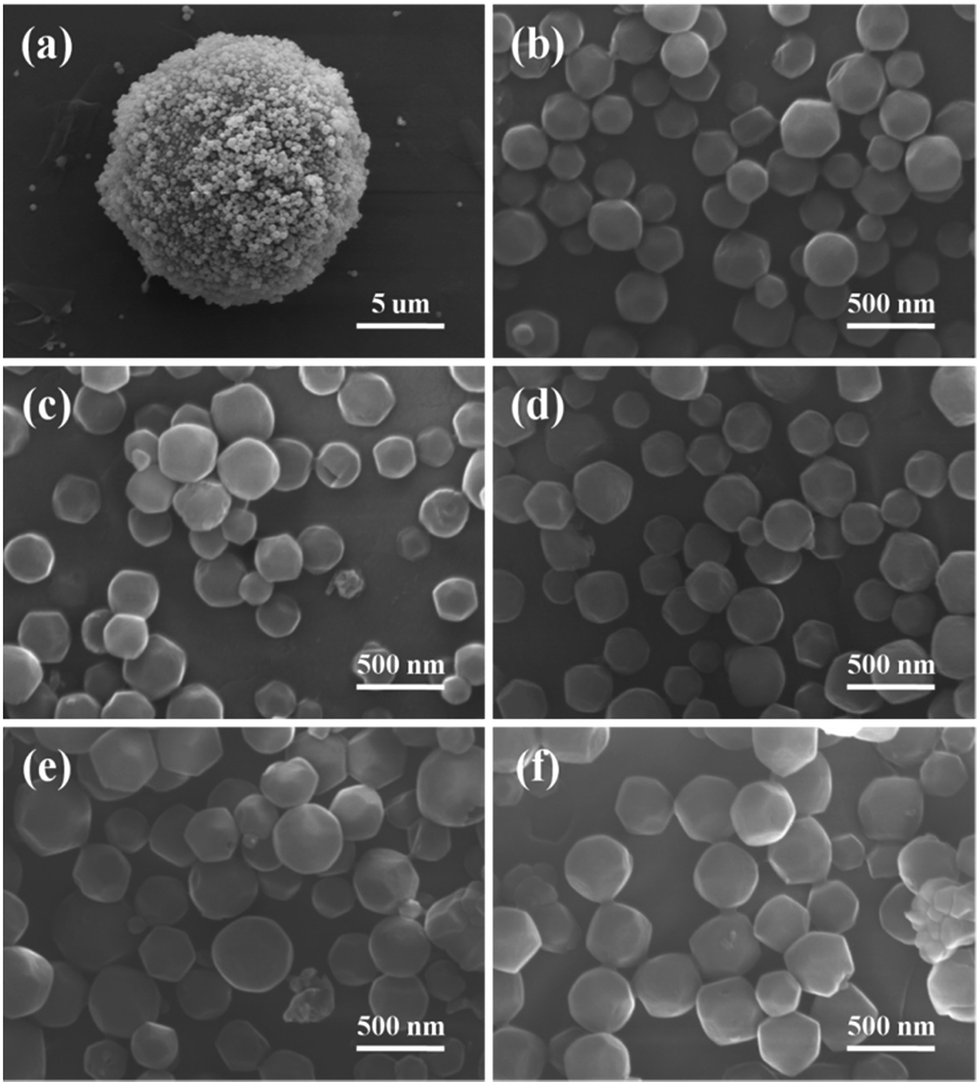 | ||
| Fig. 4 SEM images of (a and b)ZIF-8@silicalite-1, (c) 2Co/ZIF-8@silicalite-1, (d) 5Co/ZIF-8@silicalite-1, (e) 10Co/ZIF-8@silicalite-1, (f) 20Co/ZIF-8@silicalite-1. | ||
To obtain the Co/ZnO@silicalite-1 photocatalyst, Co/ZIF-8@silicalite-1 catalysts were calcined at 550 °C for 2 h under air atmosphere to remove the organic ligand. Fig. 5 is the XRD patterns of Co/ZnO@silicalite-1 photocatalysts. Fig. 5a is the XRD patterns of silicalite-1, which is the same with Fig. 3a. From Fig. 5, it can be seen that after sintering, the characteristic peaks of ZIF-8 is disappeared. There are appeared new peaks at 31.77°, 34.42°, 36.25°, 47.54° and 56.59°, which are corresponding to (100), (002), (101), (103) and (110) reflections of ZnO (JCPDS: 36-1451). It indicates that ZIF-8 transforms into ZnO. Fig. 5c–f are the XRD patterns of ZnO@silicalite-1 coated with different amounts of Co. The doping of Co does not change the characteristic peaks of ZnO@silicalite-1.
 | ||
| Fig. 5 XRD patterns of (a) silicalite-1, (b) ZnO@silicalite-1, (c) 2Co/ZnO@silicalite-1, (d) 5Co/ZnO@silicalite-1, (e) 10Co/ZnO@silicalite-1, (f) 20Co/ZnO@silicalite-1. | ||
Fig. 6 is the magnification of XRD patterns of Co/ZnO@silicalite-1 photocatalysts from 30° to 40°. It can be found that there are existing distinct characteristic peaks at 31.77°, 34.42°, 36.25° for ZnO@silicalite-1 (Fig. 6b). When ZnO@silicalite-1 is doped with 2% Co, the intensity of characteristic peaks of ZnO is weakened (Fig. 6c). With the increase of Co from 2% to 20%, the intensity of characteristic peaks of ZnO decreases more. It indicates that the doping of Co can restrain the formation of ZIF-8.
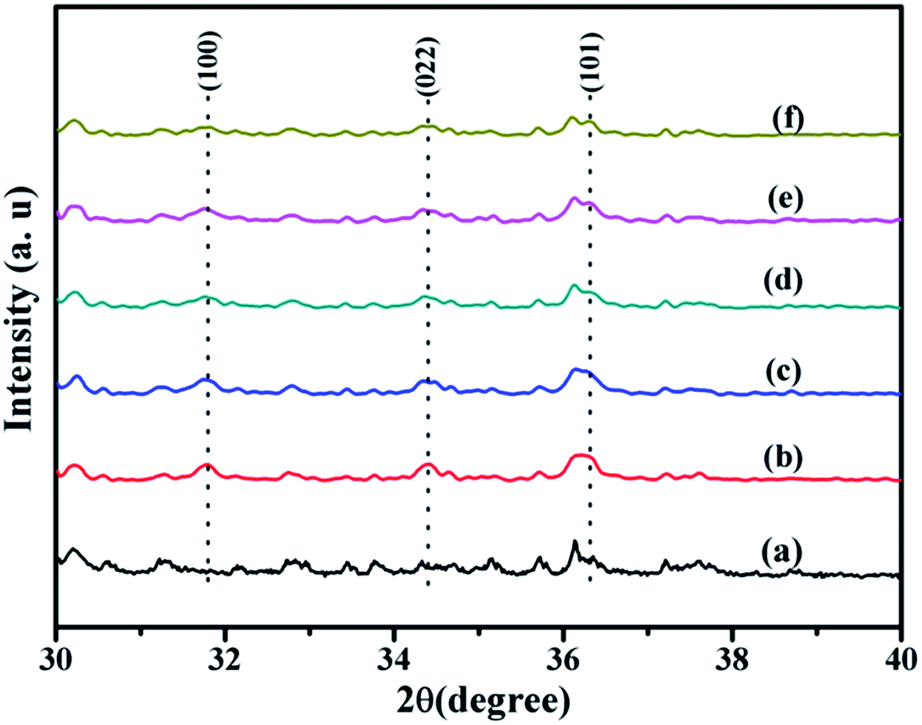 | ||
| Fig. 6 XRD patterns of (a) silicalite-1, (b) ZnO@silicalite-1, (c) 2Co/ZnO@silicalite-1, (d) 5Co/ZnO@silicalite-1, (e) 10Co/ZnO@silicalite-1, (f) 20Co/ZnO@silicalite-1. | ||
Fig. 7 is the SEM images of Co/ZnO@silicalite-1 photocatalysts. After sintering, the structure of Co/ZIF-8 collapses. Fig. 7a and b are the SEM images of ZnO@silicalite-1. It can be seen that the collapsed nanoparticles are about 50 nm and adheres on the surface of silicalite-1. With the increase of Co content, the collapsed nanoparticles increase too (from 50 to 200 nm). From Fig. 5 and 6, we can know that the nanoparticles are ZnO.
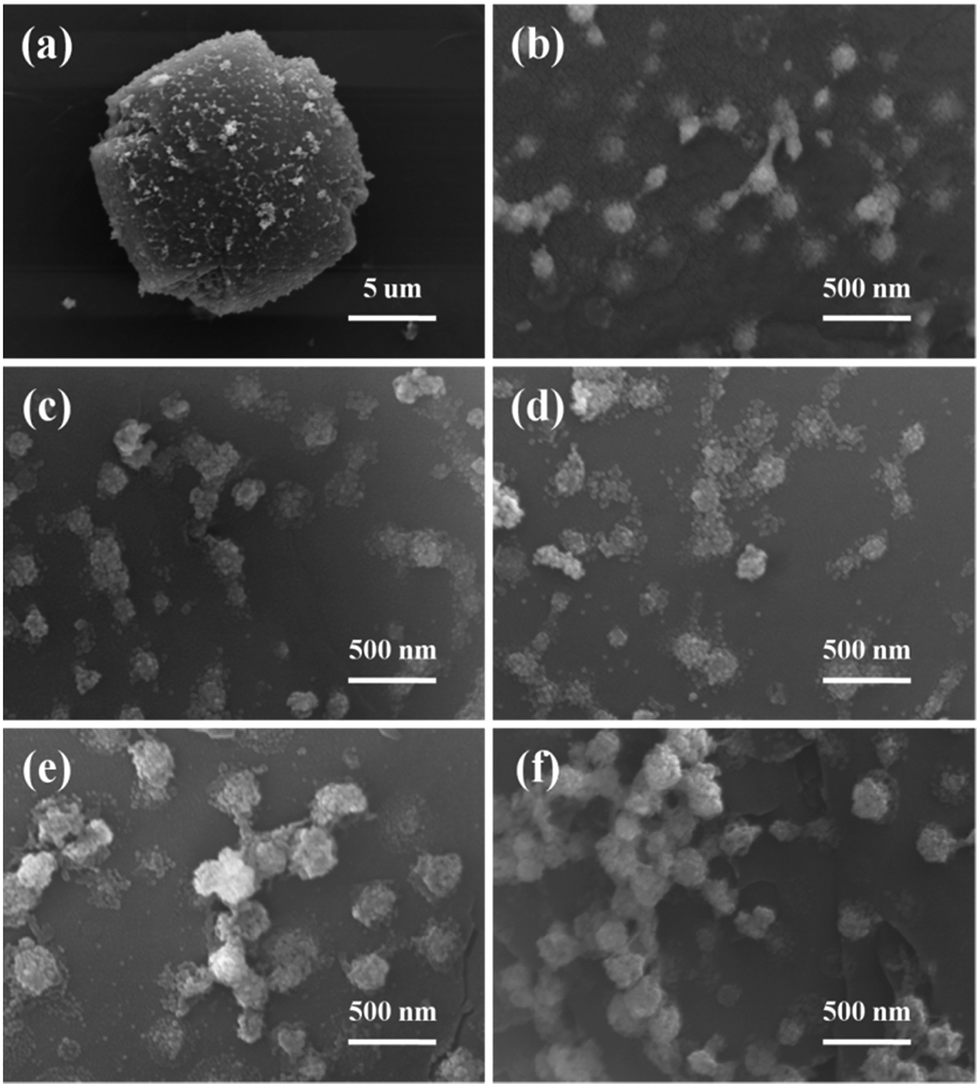 | ||
| Fig. 7 SEM images of (a and b) ZnO@silicalie-1, (c) 2Co/ZnO@silicalite-1, (d) 5Co/ZnO@silicalite-1, (e) 10 Co/ZnO@silicalite-1, (f) 20Co/ZnO@silicalite-1. | ||
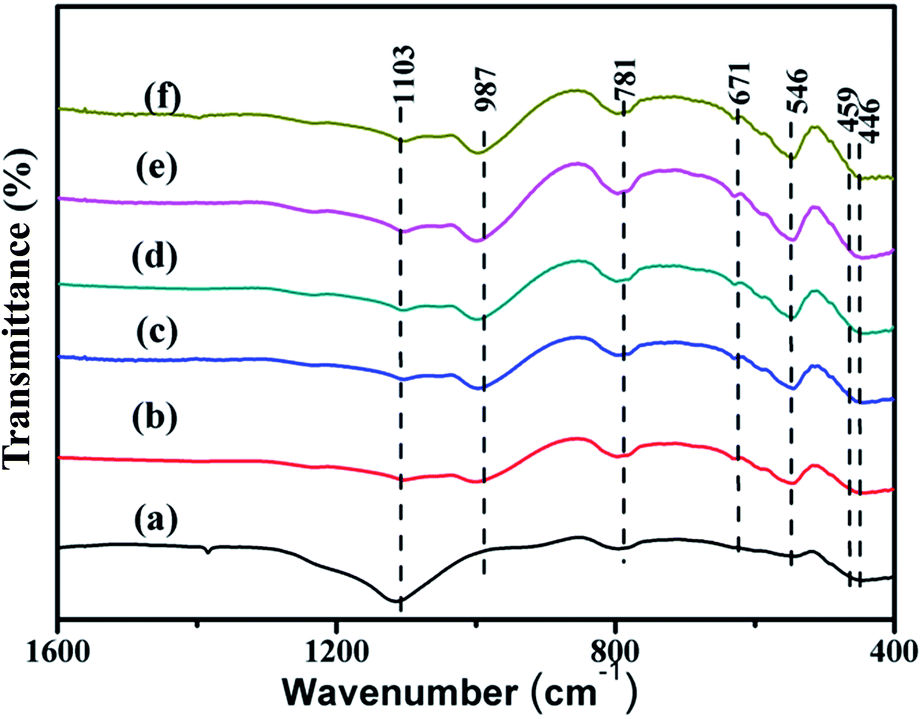
The FT-IR spectra of silicalite-1, ZnO@silicalite-1 and Co/ZnO@silicalite-1 with different Co content are shown in Fig. 8. From Fig. 8, it can be found that all samples show vibration bands at around 446, 546, 781 and 1103 cm−1. The band at 446 cm−1 is attributed to the bending vibration of SiO4.38 The band at 546 cm−1 is corresponding to the five membered ring of pentasil zeolite structure.23 The bands at 1103 cm−1 and 781 cm−1 are attributed to the internal asymmetric stretching vibration and external symmetric stretching of Si–O–Si bonds, respectively. Fig. 8b is the FT-IR spectra of ZnO@silicalite-1. It can be seen that there is existing new band at 459 cm−1, which is belonged to the characteristic band of ZnO. When ZnO@silialite-1 is doped with Co, it shows band at 671 cm−1 (Fig. 8c), which is ascribed to Co–O bond.
 | ||
| Fig. 8 FT-IR spectra of (a) silicalite-1, (b) ZnO@silicalite-1, (c) 2Co/ZnO@silicalite-1, (d) 5Co/ZnO@silicalite-1, (e) 10Co/ZnO@silicalite-1, (f) 20Co/ZnO@silicalite-1. | ||
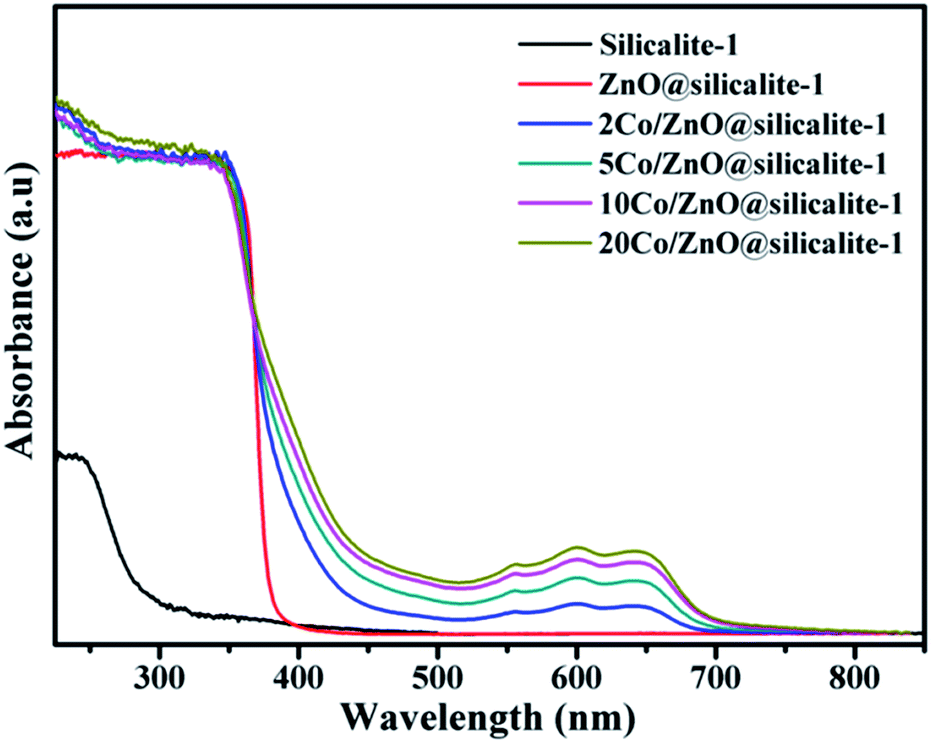
Fig. 9 shows the UV-vis diffuse reflectance spectra for silicalite-1, ZnO@silicalite-1, Co/ZnO@silicalite-1 containing different amounts of Co. Silicalite-1 just shows a weak band gap absorption at about 300 nm. When silicalite-1 is coated with ZnO nanoparticles, it shows a highly band gap absorption at about 388 nm. When ZnO@silicalite-1 is doped with 2% Co, its band gap absorption is extended into the visible light region (about 450 nm). With the increase of the doping Co content, the band gap absorption of Co/ZnO@silicalite-1 is extended from 450 to 480 nm. Except that, there is appearing new band gap absorption at about 720 nm. It is probably due to the Zn1−xCoxO solid solution formation.45,46 And the intensity of the band gap absorption also enhances with the increase of Co content.
 | ||
| Fig. 9 UV-vis absorption spectra of photocatalysts. | ||
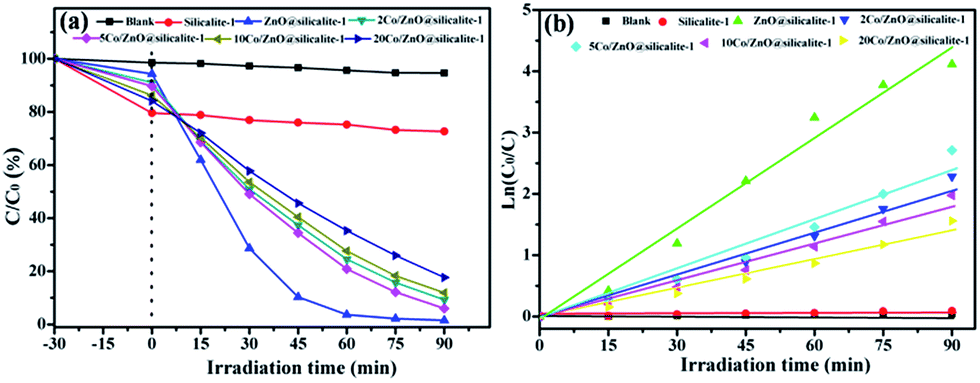
To evaluate the photocatalytic activity of all samples, degradation rhodamine (RhB) was chosen as a model organic dye. The results of RhB removal by photocatalysts are shown in Fig. 10a. In order to eliminate the influence of the adsorption of photocatalyst, all experiments were operated in the dark for 30 min. After 30 min of continuously stirring in the dark, 20.4% of RhB is absorbed by silicate-1. It is attributed the high specific surface area of silicalite-1.47 When silicalite-1 is coated with ZnO nanoparticles, it can absorb 14.8% of RhB. The decrease of its adsorptive property is attributed to the decrease of silicalite-1. With the increase of Co content, the adsorptive property of photocatalyst decreases. It may be caused by the increase of Co in the photocatalyst and the decrease of silicalite-1 content. Then, all experiments are exposed under the UV light. After 90 min of UV light irradiation, only 5.4% of RhB is degraded by itself under the UV light. And silicalite-1 just degrades 6.3% of RhB. Silicalite-1 almost has not photocatalytic properties. When silicalite-1 is coated with ZnO nanoparticles, it can degrade 98.5% of RhB. When ZnO@silicalite-1 is doped with 2% Co, it can degrade 90.7% of RhB. The photocatalytic efficiency of 2Co/ZnO@silicalite-1 is lower than the photocatalytic efficiency of ZnO@silicalite-1, which is attributed to the significantly decreasing ZnO (Fig. 6). However, the photocatalytic efficiency of 5Co/ZnO@silicalite-1 is 94.0%, and then the photocatalytic efficiency of Co/ZnO@silicalite-1 decreases with the increase of Co content. It indicates the doping Co can enhance the photocatalytic efficiency of ZnO@silicalite-1 and 5Co/ZnO@silicalite-1 has the highest photocatalytic efficiency. The photocatalysis degradation kinetic reaction can be described by ln(C0/C) = kt, where k is a pseudo-first-rate kinetic constant and t is the irradiation time. And the results are shown in Fig. 10b. The calculated k value for 2Co/ZnO@silicalite-1, 10Co/ZnO@silicalite-1 and 20Co/ZnO@silicalite-1 is 0.023, 0.02 and 0.016 min−1, respectively. For 5Co/ZnO@silicalite-1, the calculated k value is 0.027 min−1, which is higher than 2Co/ZnO@silicalite-1, 10Co/ZnO@silicalite-1 and 20Co/ZnO@silicalite-1. The photocatalysis activity of the composite is improved greatly. For ZnO@silicalite-1, its k value is 0.05 min−1, which it higher than Co doped ZnO@silicalite-1. It is attributed to the decrease of ZnO content.
 | ||
| Fig. 10 Photocatalytic degradation (a) and kinetics (b) of all samples. | ||
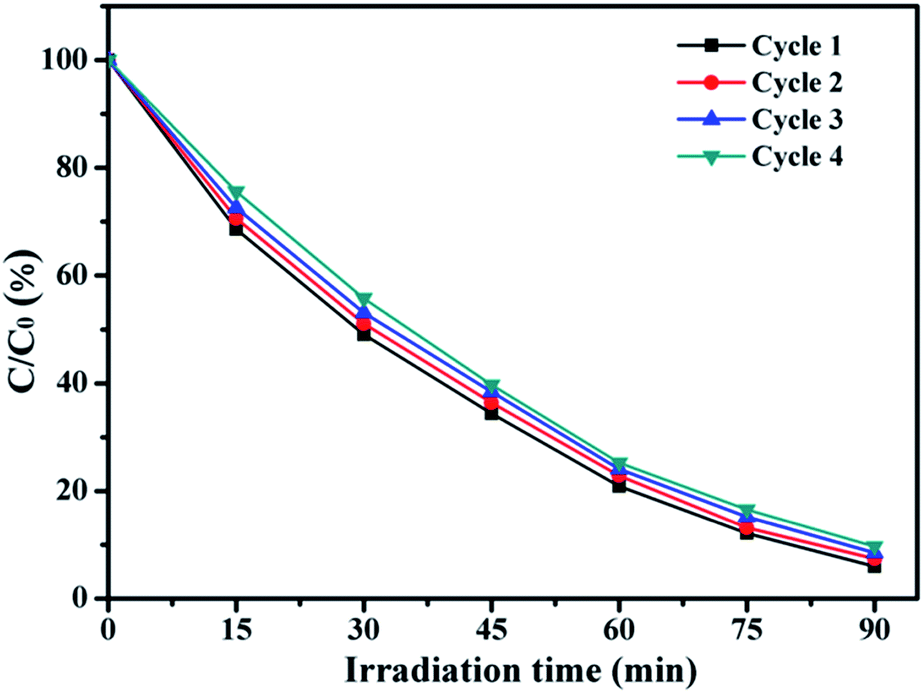
In order to investigate the stability of photocatalytic performance of Co/ZnO@silicalite-1, 5Co/ZnO@silicalite-1 was chosen to degrade RhB in four repeated cycles. The results are shown in Fig. 11. It can be found that after four photocatalytic degradation cycles, the photocatalytic efficiency of 5Co/ZnO@silicalite-1 reduces only by 3.6%. It may be the reason that 5Co/ZnO nanoparticles adhere tightly on the surface of silicalite-1.
 | ||
| Fig. 11 Four photocatalytic degradation cycles of RhB using 5Co/ZnO@silicalite-1 photocatalyst under UV light. | ||
Fig. 12 shows the schematic illustration of Co/ZnO@silicalite-1 for RhB degradation under UV light. Co/ZnO nanoparticles adhere tightly on the surface of silicalite-1. Silicalite-1 has high surface area. It can absorb RhB molecules on its surface or pores. When Co/ZnO is irradiated by UV light, it can generate electrons and holes. O2 can capture electrons from the conduction band to form O2−. And OH− can lose its electrons from the valence band to form ˙OH. The generated O2− and ˙OH can convert RhB molecules into CO2, H2O and so on.
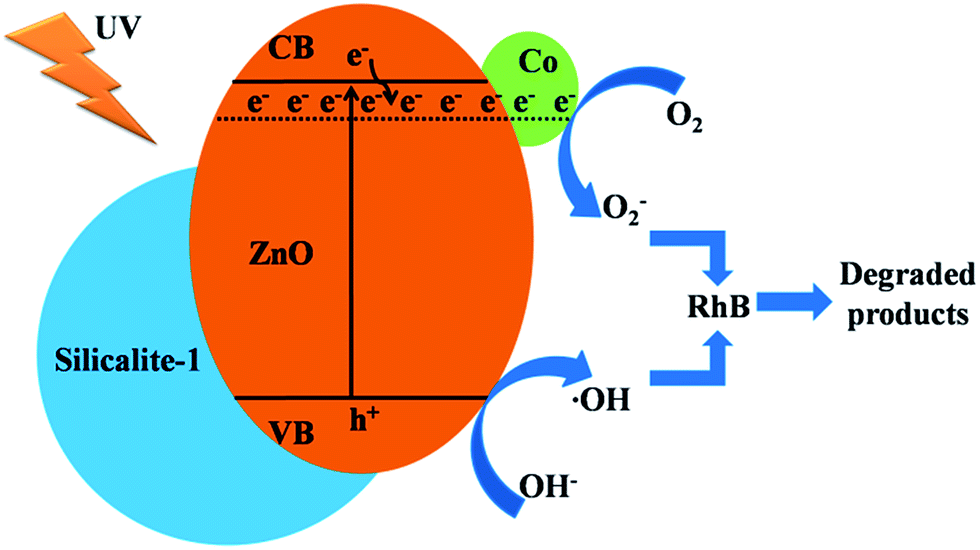 | ||
| Fig. 12 The schematic illustration of Co/ZnO@silicalite-1 for RhB degradation under UV light. The solid lines indicate VB and CB of ZnO whereas dashed lines indicate the change in VB and CB energies on Co/ZnO@silicalite-1. | ||
4. Conclusions
This paper reports a sample and rapid way to synthesize Co/ZnO@silicalite-1 photocatalysts and explores the influence of Co for its properties. The results show that the doping Co can restrain the synthesis of ZnO. But the band gap absorption of the photocatalyst is extended into the visible energy region and there is also appearing an new band gap absorption at about 720 nm. When Co/ZnO@silicalite-1 photocatalysts were used to degrade RhB solution, 5Co/ZnO@silicalite-1 exhibited the highest photocatalytic activity (94.0%). Moreover, 5Co/ZnO@silicalite-1 has high photostability. It has potential to be used in the treatment of dye pollutants.Acknowledgements
The authors grateful acknowledge financial supported by the Scientific Technological Innovation Platform of Fujian Province (2006L2003). Especially, we thank very much Professor Bizhou Lin from Huaqiao University of China for the helpful discussions.Notes and references
- J. H. Jun, H. Seong, K. Cho, B.-M. Moon and S. Kim, Ceram. Int., 2009, 35, 2797–2801 CrossRef CAS.
- C. Yi, X. Li, J. Luo, S. M. Zakeeruddin and M. Grätzel, Adv. Mater., 2016, 28, 2964–2970 CrossRef CAS PubMed.
- H. Katsumata, T. Sakai, T. Suzuki and S. Kaneco, Ind. Eng. Chem. Res., 2014, 53, 8018–8025 CrossRef CAS.
- Y. Tang, D. Wu, S. Chen, F. Zhang, J. Jia and X. Feng, Energy Environ. Sci., 2013, 6, 2447–2451 CAS.
- P. M. Rao, L. Cai, C. Liu, I. S. Cho, C. H. Lee, J. M. Weisse, P. Yang and X. Zheng, Nano Lett., 2014, 14, 1099–1105 CrossRef CAS PubMed.
- L. An, G. Wang, Y. Cheng, L. Zhao, F. Gao and Y. Tian, Res. Chem. Intermed., 2014, 41, 7449–7461 CrossRef.
- D. Liu, Y. H. Lv, M. Zhang, Y. F. Liu, Y. Y. Zhu, R. L. Zong and Y. F. Zhu, J. Mater. Chem. A, 2014, 2, 15377–15388 CAS.
- M. S. Gohari and A. H. Yangjeh, RSC Adv., 2016, 6, 2402–2413 RSC.
- D. Virovska, D. Paneva, N. Manolova, I. Rashkov and D. Karashanova, Mater. Sci. Eng., C, 2016, 60, 184–194 CrossRef CAS PubMed.
- J. Hou, L. Miao, C. Wang, P. Wang, Y. Ao, J. Qian and S. Dai, J. Hazard. Mater., 2014, 276, 164–170 CrossRef CAS PubMed.
- L. R. Heggelund, M. Diez-Ortiz, S. Lofts, E. Lahive, K. Jurkschat, J. Wojnarowicz, N. Cedergreen, D. Spurgeon and C. Svendsen, Nanotoxicology, 2013, 8, 559–572 CrossRef PubMed.
- D. Y. Son, K. H. Bae, H. S. Kim and N. G. Park, J. Phys. Chem. C, 2015, 119, 10321–10328 CAS.
- S. B. Dkhil, D. Duché, M. Gaceur, A. K. Thakur, F. B. Aboura, L. Escoubas, J. J. Simon, A. Guerrero, J. Bisquert, G. Garcia-Belmonte, Q. Bao, M. Fahlman, C. Videlot-Ackermann, O. Margeat and J. Ackermann, Adv. Energy Mater., 2014, 4, 1400805 CrossRef.
- H. Xu, T. Yu and J. Liu, Mater. Lett., 2014, 117, 263–265 CrossRef CAS.
- E. Rokhsat and O. Akhavan, Appl. Surf. Sci., 2016, 371, 590–595 CrossRef CAS.
- C.-L. Hsu, Y.-D. Gao, Y.-S. Chen and T.-J. Hsueh, Sens. Actuators, B, 2014, 192, 550–557 CrossRef CAS.
- T. T. Vu, L. del Río, T. Valdés-Solís and G. Marbán, J. Hazard. Mater., 2013, 246–247, 126–134 CrossRef CAS PubMed.
- Z. Liu, Z. Liu, T. Cui, J. Li, J. Zhang, T. Chen, X. Wang and X. Liang, Chem. Eng. J., 2014, 235, 257–263 CrossRef CAS.
- W. Yu, J. Zhang and T. Peng, Appl. Catal., B, 2016, 181, 220–227 CrossRef CAS.
- K. Pinkaew, G. Yang, T. Vitidsant, Y. Jin, C. Zeng, Y. Yoneyama and N. Tsubaki, Fuel, 2013, 111, 727–732 CrossRef CAS.
- Y. Liu, L. Sun, J. Wu, T. Fang, R. Cai and A. Wei, Mater. Sci. Eng., B, 2015, 194, 9–13 CrossRef CAS.
- J. Ma, K. Wang, L. Li, T. Zhang, Y. Kong and S. Komarneni, Ceram. Int., 2015, 41, 2050–2056 CrossRef CAS.
- P. Fageria, S. Gangopadhyay and S. Pande, RSC Adv., 2014, 4, 24962–24972 RSC.
- M. Li, K. Chang, T. Wang, L. Q. Liu, H. B. Zhang, P. Li and J. H. Ye, J. Mater. Chem. A, 2015, 3, 13731–13737 CAS.
- J. G. Wu, T. Fang, R. Cai, S. Y. Li, Y. Wang, C. E. Zhao and A. Wei, RSC Adv., 2016, 6, 4245–4150 Search PubMed.
- S. Liu, L. Sun, F. Xu, J. Zhang, C. Jiao, F. Li, Z. Li, S. Wang, Z. Wang, X. Jiang, H. Zhou, L. Yang and C. Schick, Energy Environ. Sci., 2013, 6, 818–823 CAS.
- S. Yang, F. Ye, Q. Lv, C. Zhang, S. Shen and S. Zhao, J. Chromatogr. A, 2014, 1360, 143–149 CrossRef CAS PubMed.
- K. Na, K. M. Choi, O. M. Yaghi and G. A. Somorjai, Nano Lett., 2014, 14, 5979–5983 CrossRef CAS PubMed.
- C. O. Tavra, E. F. Baxter, T. Tian, T. D. Bennett, N. K. H. Slater, A. K. Cheetham and D. F. Jimenez, Chem. Commun., 2015, 51, 13878–13881 RSC.
- H. C. J. Zhou and S. Kitagawa, Chem. Soc. Rev., 2014, 43, 5415–5418 RSC.
- B. S. Barros, J. Chojnacki, A. A. M. Soares, J. Kulesza, L. L. D. Luz and S. A. Júnior, Mater. Chem. Phys., 2015, 162, 364–371 CrossRef CAS.
- Y. Yang, K. Shen, J. Z. Lin, Y. Zhou, Q. Y. Liu, C. Huang, H. N. Abdelhamid, Z. Q. Zhang and H. Chen, RSC Adv., 2016, 6, 45475–45481 RSC.
- I. M. Hauptvogel, R. Biedermann, N. Klein, I. Senkovska, A. Cadiau, D. Wallacher, R. Feyerherm and S. Kaskel, Inorg. Chem., 2011, 50, 8367–8374 CrossRef CAS PubMed.
- J. Kulesza, B. S. Barros, S. A. Júnior, C. A. F. D. Oliveira, D. M. D. A. Melo and J. Chojnacki, Mater. Chem. Phys., 2014, 143, 1522–1527 CrossRef CAS.
- C. K. Lin, D. Zhao, W. Y. Gao, Z. Yang, J. Ye, T. Xu, Q. Ge, S. Ma and D. J. Liu, Inorg. Chem., 2012, 51, 9039–9044 CrossRef CAS PubMed.
- S. Bordiga, C. Lamberti, G. Ricchiardi, L. Regli, F. Bonino, A. Damin, K. P. Lillerud, M. Bjorgen and A. Zecchina, Chem. Commun., 2004, 2300–2301 RSC.
- Y. Pan, Y. Liu, G. Zeng, L. Zhao and Z. Lai, Chem. Commun., 2011, 47, 2071–2073 RSC.
- J. Qian, F. Sun and L. Qin, Mater. Lett., 2012, 82, 220–223 CrossRef CAS.
- N. L. Torad, M. Hu, Y. Kamachi, K. Takai, M. Imura, M. Naito and Y. Yamauchi, Chem. Commun., 2013, 49, 2521–2523 RSC.
- N. L. Torad, R. R. Salunkhe, Y. Li, H. Hamoudi, M. Imura, Y. Sakka, C. C. Hu and Y. Yamauchi, Chem.–Eur. J., 2014, 20, 7895–7900 CrossRef CAS PubMed.
- J. K. Zaręba, M. Nyk and M. Samoć, Cryst. Growth Des., 2016, 16, 6419–6425 Search PubMed.
- X. B. Yang, C. H. Gan, H. P. Xiong, L. Q. Huang and X. T. Luo, RSC Adv., 2016, 6, 105737–105743 RSC.
- X. B. Yang, L. Q. Huang, J. T. Li, X. Y. Tang and X. T. Luo, RSC Adv., 2017, 7, 12224–12230 RSC.
- P. Neelakanda, E. Barankova and K.-V. Peinemann, Microporous Mesoporous Mater., 2016, 220, 215–219 CrossRef CAS.
- J. Kegel, J. Halpin, F. Laffir, I. M. Povey and M. E. Pemble, CrystEngComm, 2017, 19, 1938–1946 RSC.
- A. Šutka, T. Käämbre, R. Pärna, I. Juhnevica, M. Maiorov, U. Joost and V. Kisand, Solid State Sci., 2016, 56, 54–62 CrossRef.
- B. E. Kayaalp, Y. J. Lee, A. Kornowski, S. Gross, M. D. Arienzo and S. Mascotto, RSC Adv., 2016, 6, 90401–90409 RSC.
Footnote |
| † Xiaobing Yang and Juan Chen contributed equally to this work. They are co-first authors. |
| This journal is © The Royal Society of Chemistry 2017 |