DOI:
10.1039/C7RA05932A
(Paper)
RSC Adv., 2017,
7, 38526-38537
Structures, stabilities and spectral properties of metalloborospherenes MB0/−40 (M = Cu, Ag, and Au)†
Received
26th May 2017
, Accepted 27th July 2017
First published on 7th August 2017
Abstract
The discovery of borospherene B40 marks the onset of a new class of boron fullerenes and it is of current interest in chemical physics and, in particular, boron chemistry. In this work, density functional theory (DFT) and time-dependent density functional theory (TD-DFT) calculations are carried out to study the structures, stabilities, photoelectron spectra, infrared spectra, Raman spectra and electronic absorption spectra of metalloborospherenes MB0/−40 (M = Cu, Ag, and Au). It is found that Cu, Ag and Au atoms can form stable exohedral metalloborospherenes M&B0/−40 (M = Cu, Ag, and Au) and endohedral metalloborospherenes M@B0/−40 (M = Cu, Ag, and Au). In addition, the relative energies of these metalloborospherenes suggest that Cu, Ag and Au atoms favor the exohedral configuration. The Cu atom favors an exohedral geometry with the dopant face-capping a heptagon on the side surface (η7-Cu), whereas Ag and Au atoms favor exohedral geometries with the dopant bonding a side boron atom of the hexagonal ring. The calculated spectra suggest that doping of metal atoms in borospherene B40 can change the spectral features since the extra metal atoms can modify the electronic structure of borospherene B40. The addition of metal atoms can lead to more infrared and Raman active modes and redshift the electronic absorption spectra. The calculated results also show that metalloborospherenes MB0/−40 (M = Cu, Ag, and Au) have different and meaningful spectral features, insight into the spectral properties is important to understand the compounds and reveal their potential applications. These spectral features can be readily compared with future spectroscopy measurements and used as fingerprints to identify and distinguish the metalloborospherenes MB0/−40 (M = Cu, Ag, and Au).
Introduction
Since the discovery of C60,1 boron clusters have been received ample attention and previous works have shown that most boron clusters are planar or quasi-planar structures.2–9 In addition, stuffed fullerene-like boron carbide nanoclusters, boron sheets and different three-dimensional (bowl, tube, cage) boron clusters have been proposed based on theoretical calculations.10–22 Exhilaratingly, an all-boron fullerene B40− was produced using a laser vaporization supersonic source in 2014.23 Photoelectron spectroscopy analysis confirmed the existence of B40−. The first all-boron fullerene with 40 atoms is named ‘borospherene’. Soon after, the all-boron fullerene B39− was also produced via laser vaporization.24 The first observation of borospherene has aroused interest in boron clusters and their derivatives such as the dynamic behavior of B40,25 hydrogen storage capacity of Ti-decorated B40,26 manganese-centered and cobalt-centred tubular boron clusters (MnB16− and CoB16−),27,28 experimental and theoretical studies of Bn− (n = 27–29),29–31 structures and properties of borospherenes (B42+, B0/−44, and B46),32–35 structures of boron clusters Bn (n = 30 to 51) and exohedral complexation in C6H6CrB40,36,37 CO2 capture, storage and separation by borospherene B40,38 and spectral properties of borospherenes B0/−40.39,40
Since the discovery of fullerene C60,1 researchers have reported the development of several fullerene derivatives based on the functionalization of the C60 aiming to produce new properties or improve their existing properties. The important studies involve the use of C60 derivatives in biological systems,41,42 solar cells43,44 and superconductors.45 Endofullerenes based on C60 have attracted much attention due their potential applications in superconductivity and materials science.46–49 Similarly, can metalloborospherenes also show new properties? Several theoretical studies have been reported to investigate the structures and electronic properties of metalloborospherenes.50–57 Bai et al. reported the metalloborospherenes MB40 (M = Ca, Mg, Sr, and Be), they found that both Ca and Sr with bigger atomic radii exhibit endohedral structures as the global minima, whereas Be and Mg with smaller atomic radii favor the exohedral geometries with the dopant face-capping a heptagon on the side surface (η7-M). Their studies suggest that the atomic radii of metal dopants play a key factor in determining stability of the metalloborospherenes. Jin et al. reported the metalloborospherenes MB40 (M = Sc, Y, and La). They found that Sc, Y, and La atoms all favor the off-center location within the B40 cage. However, in another study of metalloborospherenes MB40 (M = Li, Na, Ba, and K), the results show that K favors the η7-K exohedral location whereas Na favors the endohedral off-center location, even though the size of Na (1.91 Å) is smaller than that of K (2.34 Å). So the atomic radius of metal dopant is not the only factor in determining stability of the metalloborospherenes. Therefore, it will be useful to determine additional factors that can be used to identify the preference of endohedral or exohedral doping for the metal atoms. It is necessary to examine all possible binding configurations of other metal atoms with the B40 cage.
Ag and Au have often been used as electrodes of single-molecule device, such as the electrical transport properties of single-molecule devices Au–B40–Au and Au–Sr@B40–Au were studied by using density functional theory and non-equilibrium Green's function method.58–60 It is necessary to investigate the structures and stabilities of metalloborospherenes MB0/−40 (M = Ag, Au). On the one hand, it can enrich the research of metalloborospherenes, on the other hand, it also can provide theoretical guidance for borospherene or metalloborospherene molecular devices. In this work, we provide a theoretical study on the structures, stabilities, photoelectron spectra, infrared, Raman and electronic absorption spectra of metalloborospherenes MB0/−40 (M = Cu, Ag, and Au). Our works can provide valuable results to assist further experimental identifications on the metalloborospherenes MB0/−40 (M = Cu, Ag, and Au), and also may provide theoretical guidance for the applications and synthesis of them in the future.
Computational methods
To gain relative stabilities between the endohedral and exohedral structures of metalloborospherenes MB0/−40 (M = Cu, Ag, and Au), we divided into two steps. First, we performed a scan of potential energy by using the dopant as a probe to move along the path connecting the B40 center toward the outside but keeping the B40 cage intact. Considering the molecular symmetry (D2d), six target paths were selected. (1) Ly: connecting the B40 center and a heptagon center (y axis); (2) Lz: connecting the B40 center and a hexagon center (z axis); (3) Lxy: angle bisector of angle between x axis and y axis; (4) Lyz: angle bisector of angle between y axis and z axis; (4) Lxz: angle bisector of angle between x axis and z axis; (6) Lxyz: intersection line of three planes determined by x axis and Lyz, z axis and Lxz, y and Lxz, respectively. Structure of D2d B40 indicates that there exist six kinds of boron atoms with different chemical environment (confirmed by the NBO charge analysis and calculated 11B NMR spectrum61,62), two of which belong to hexagon and four to heptagon as shown by different numbers in Fig. 1. Four paths containing Lxz, Lxy, Lyz and Lxyz ensure the dopant atop six different boron atoms. This method is a quick and advisable computational indicator to demonstrate the relative stabilities between the endohedral and exohedral configurations of metallofullerenes and metalloborospherenes.52,63 In the last step, geometry optimizations and frequency calculations were performed containing local minima in the six target paths. The potential energy scan was performed using the PBE0 functional with 6-31G basis set for boron and a double-ζ basis set (LanL2DZ) with the effective core potential for metals. Geometry optimizations and harmonic frequency analysis were carried out using the PBE0 functional with 6-311+G* basis set for boron and a double-ζ basis set (LanL2DZ) with the effective core potential for metals. These optimized structures were then used in the calculations of photoelectron spectra and electronic absorption spectra based on the time-dependent DFT formalism.64 Adiabatic detachment energy (ADE) was calculated as the energy difference of the anion and neutral metalloborospherenes at their respective optimized geometries. The first vertical detachment energy (VDE) was calculated as the energy difference between the anion ground state and the neutral at the optimized anion geometry. The higher vertical detachment energies (VDEs) were approximated via ΔSCF-time-dependent density functional theory (ΔSCF-TD-DFT).23,24,64 All computations were carried out using the Gaussian09 software package.65
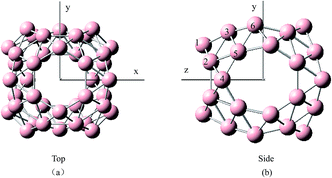 |
| | Fig. 1 Structures of B0/−40 observed along the (a) z direction and (b) x direction. Six numbers denote the six kinds of boron atoms with different chemical environment. | |
Results and discussion
Structures
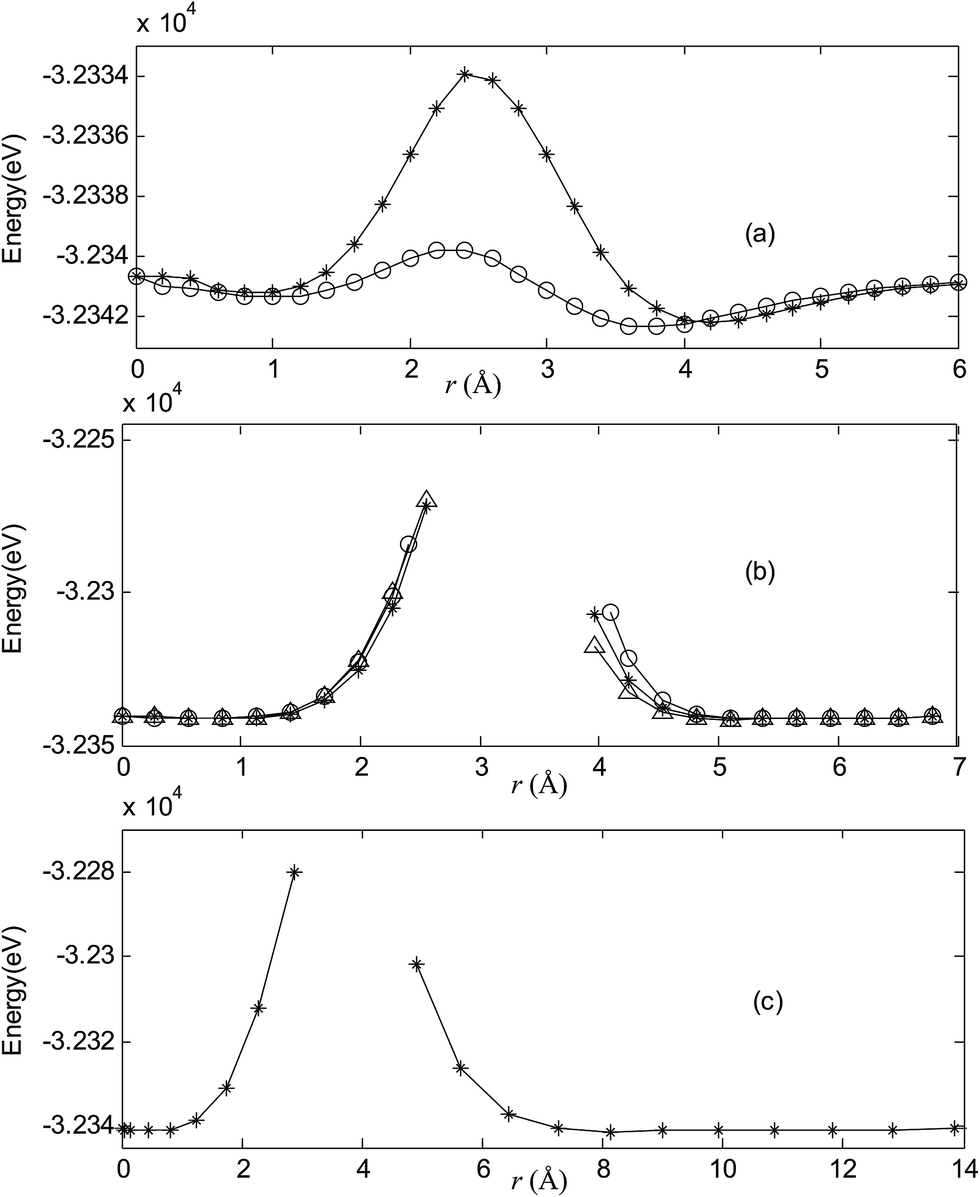
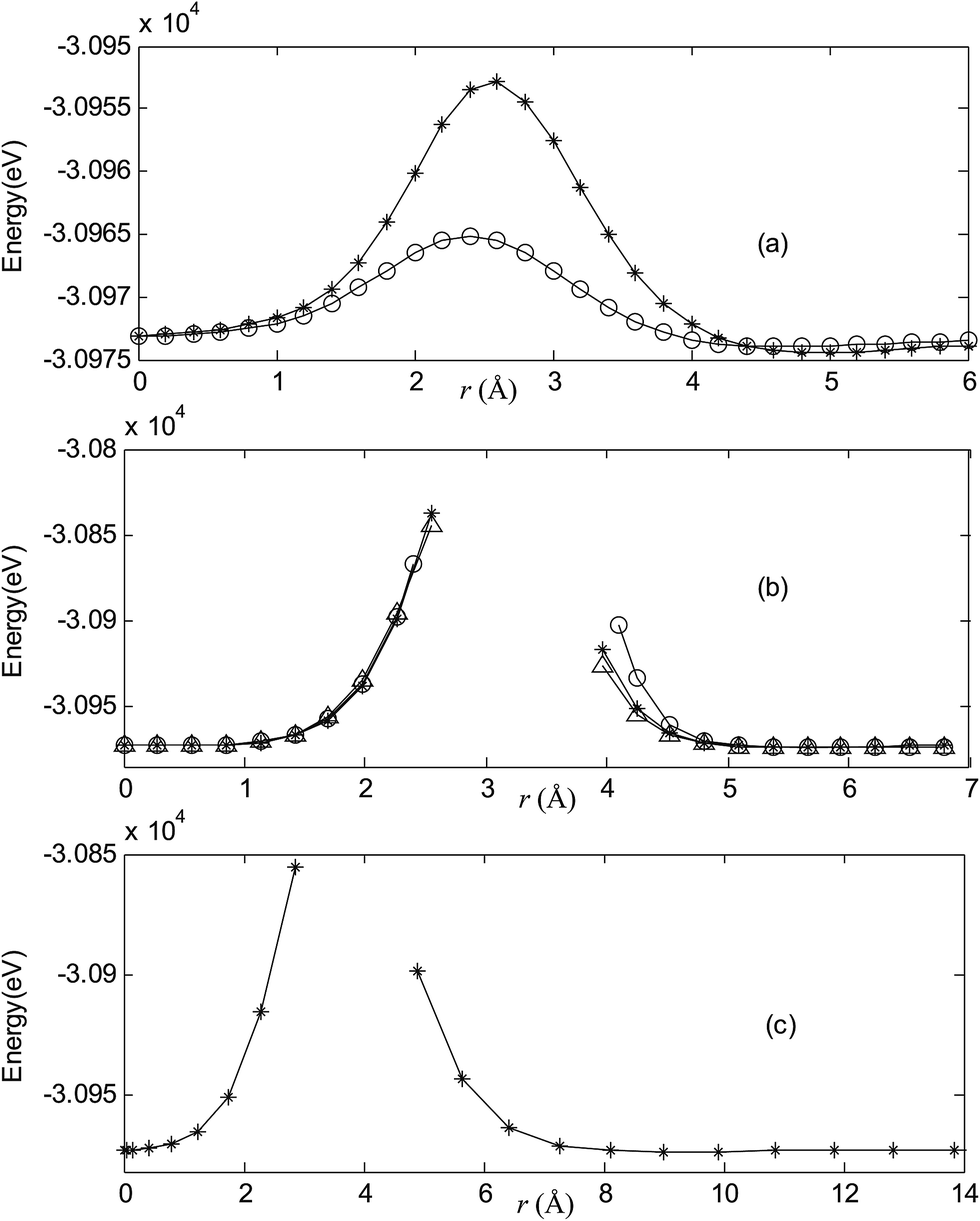
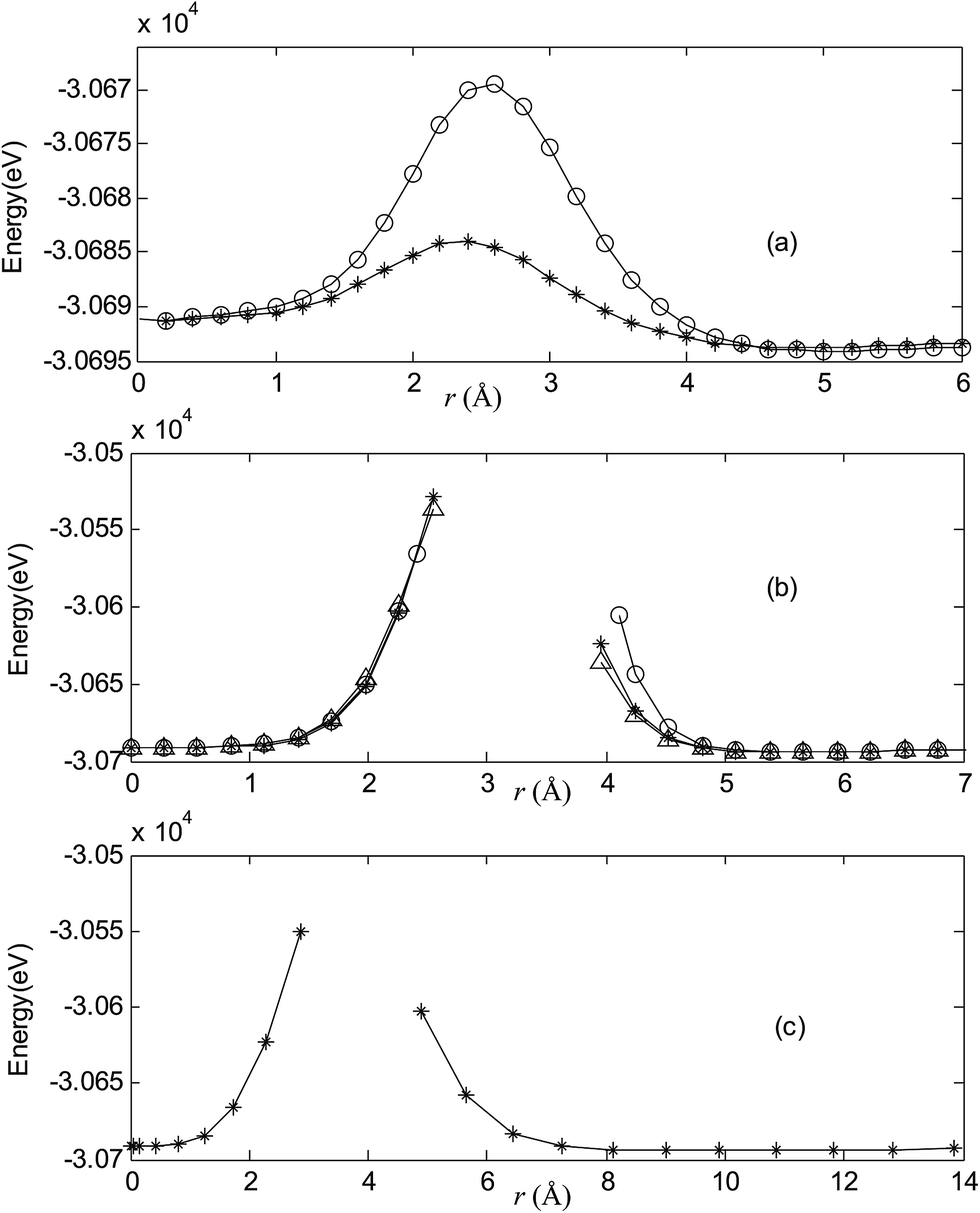
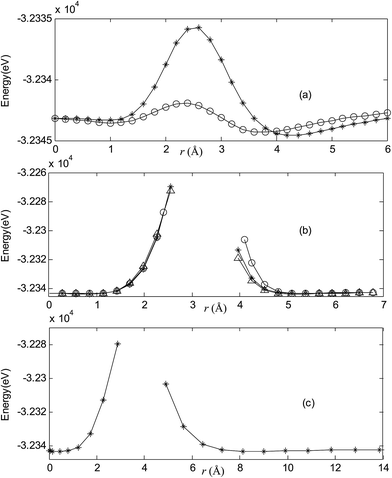
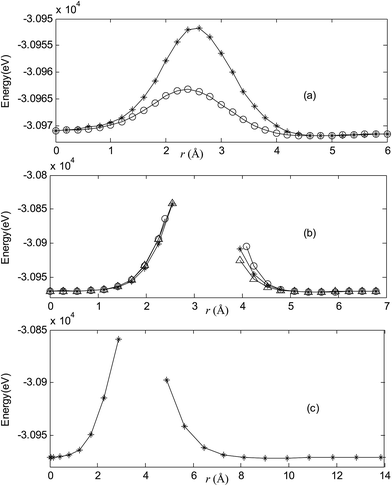
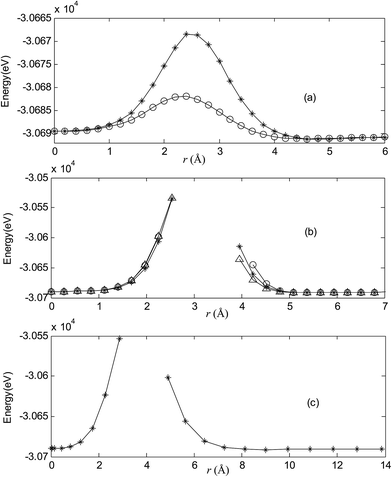
Fig. 2–7 are results of potential energy scan by moving the metal dopant from the cage center through different paths while keeping the cage intact. The open location of each curve is just cage surface in the presence of boron atoms. The results indicate that these potential energy curves exhibit two local minima: one corresponds to the endohedral structure, whereas another corresponds to the exohedral structure. We also notice that the exohedral minimum is lower in energy than the endohedral minimum. For endohedral Ag@B40, Ag@B40− and Au@B40, when the dopant is at the center of cage, endohedral structure is local minimum. However, for both Cu@B40 and Cu@B40−, endohedral structure which the dopant is at the off-center location within the cage is local minimum. In addition, endohedral Au@B40− which the dopant is at the slightly off-center location within the cage is local minimum.
 |
| | Fig. 2 Potential energy scan by moving the metal dopant Cu from the cage center through different paths while keeping the cage intact for CuB40. r represents the distance between the dopant Cu and the cage center. (a) Asterisk represents the path Lz, circle represents the path Ly, (b) triangle represents the path Lyz, asterisk represents the path Lxy, circle represents the path Lxz, (c) the path Lxyz. | |
 |
| | Fig. 3 Potential energy scan by moving the metal dopant Cu from the cage center through different paths while keeping the cage intact for CuB40−. r represents the distance between the dopant Cu and the cage center. (a) Asterisk represents the path Lz, circle represents the path Ly, (b) triangle represents the path Lyz, asterisk represents the path Lxy, circle represents the path Lxz, (c) the path Lxyz. | |
 |
| | Fig. 4 Potential energy scan by moving the metal dopant Ag from the cage center through different paths while keeping the cage intact for AgB40. r represents the distance between the dopant Ag and the cage center. (a) Asterisk represents the path Lz, circle represents the path Ly, (b) triangle represents the path Lyz, asterisk represents the path Lxy, circle represents the path Lxz, (c) the path Lxyz. | |
 |
| | Fig. 5 Potential energy scan by moving the metal dopant Ag from the cage center through different paths while keeping the cage intact for AgB40−. r represents the distance between the dopant Ag and the cage center. (a) Asterisk represents the path Lz, circle represents the path Ly, (b) triangle represents the path Lyz, asterisk represents the path Lxy, circle represents the path Lxz, (c) the path Lxyz. | |
 |
| | Fig. 6 Potential energy scan by moving the metal dopant Au from the cage center through different paths while keeping the cage intact for AuB40. r represents the distance between the dopant Au and the cage center. (a) Asterisk represents the path Lz, circle represents the path Ly, (b) triangle represents the path Lyz, asterisk represents the path Lxy, circle represents the path Lxz, (c) the path Lxyz. | |
 |
| | Fig. 7 Potential energy scan by moving the metal dopant Au from the cage center through different paths while keeping the cage intact for AuB40−. r represents the distance between the dopant Au and the cage center. (a) Asterisk represents the path Lz, circle represents the path Ly, (b) triangle represents the path Lyz, asterisk represents the path Lxy, circle represents the path Lxz, (c) the path Lxyz. | |
For all metalloborospherenes MB0/−40 (M = Cu, Ag, and Au), as illustrated in Fig. 2–7, the energy rapidly increases near the cage surface and exhibits a maximum at the cage surface. In addition, the energy rapidly increases near the hexagonal and heptagonal rings and exhibits a maximum at the center of the hexagonal and heptagonal ring, respectively. The energy barriers for the Cu, Ag, and Au dopants are 1.54 eV (CuB40), 1.61 eV (CuB40−), 7.72 eV (AgB40), 7.92 eV (AgB40−), 7.55 eV (AuB40), and 7.29 eV (AuB40−) for their moving “in” through the heptagon ring, respectively. The energy barriers for the CuB0/−40, AgB0/−40, and AuB0/−40 dopants are 7.18 eV (CuB40), 7.70 eV (CuB40−), 19.09 eV (AgB40), 20.27 eV (AgB40−), 20.98 eV (AuB40), 21.79 eV (AuB40−) for their moving “in” through the hexagon ring, respectively. The larger the ionic radius, the higher is the energy barrier. The large barrier height found for Ag and Au indicates that the atom cannot escape from B40 once encapsulated. In addition, for a dopant, the energy barrier is smaller for the heptagon ring, indicating stronger interaction for the hexagon ring. The results can be understood by comparing the size of the hexagonal and heptagonal ring.63 The hexagonal ring radius is smaller compared with the heptagonal ring radius, but smaller radius leads to stronger interaction to pass through the hexagonal ring with closer touching the electrons responsible for the B–B bond. The heptagonal ring radius is already larger than the hexagonal ring radius, where the energy barrier is smaller for heptagonal ring.
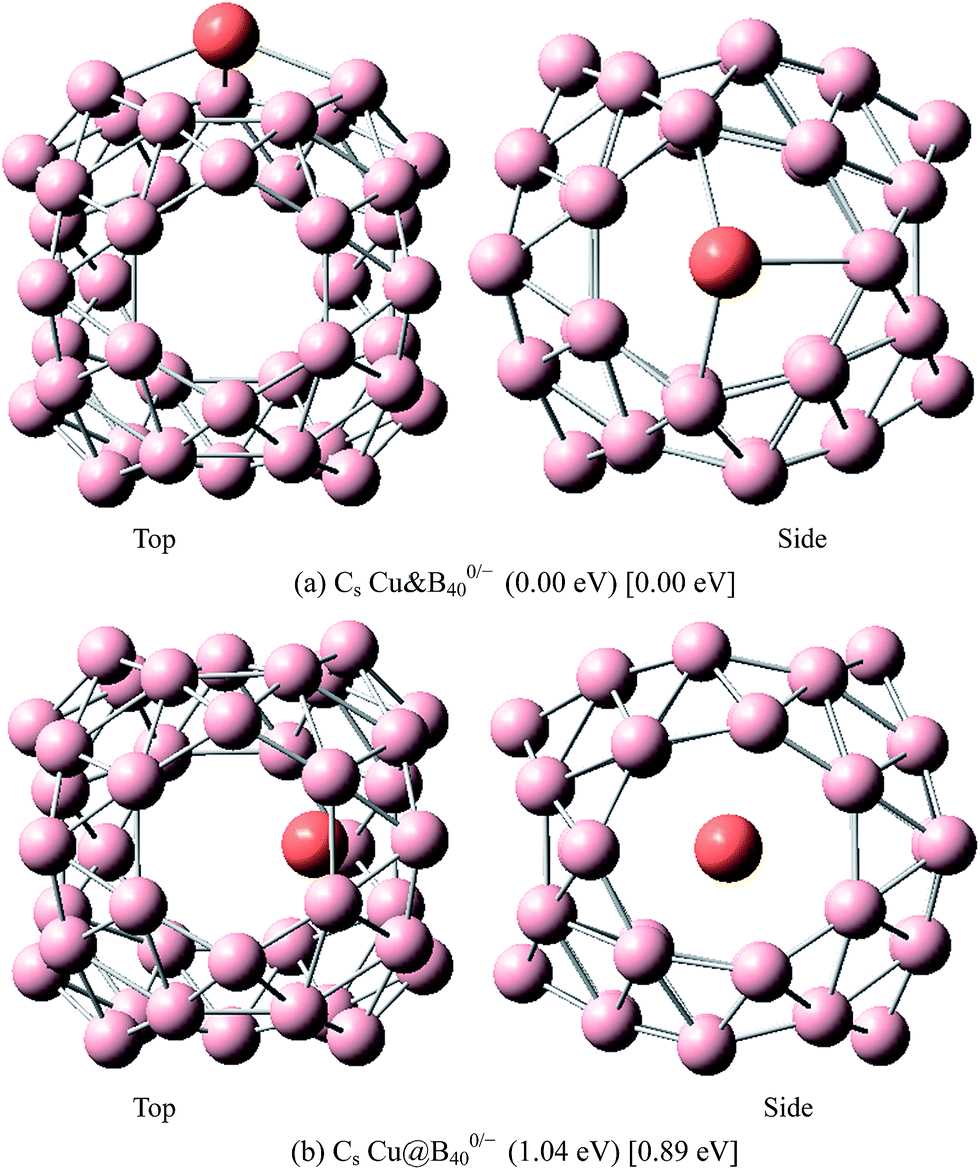
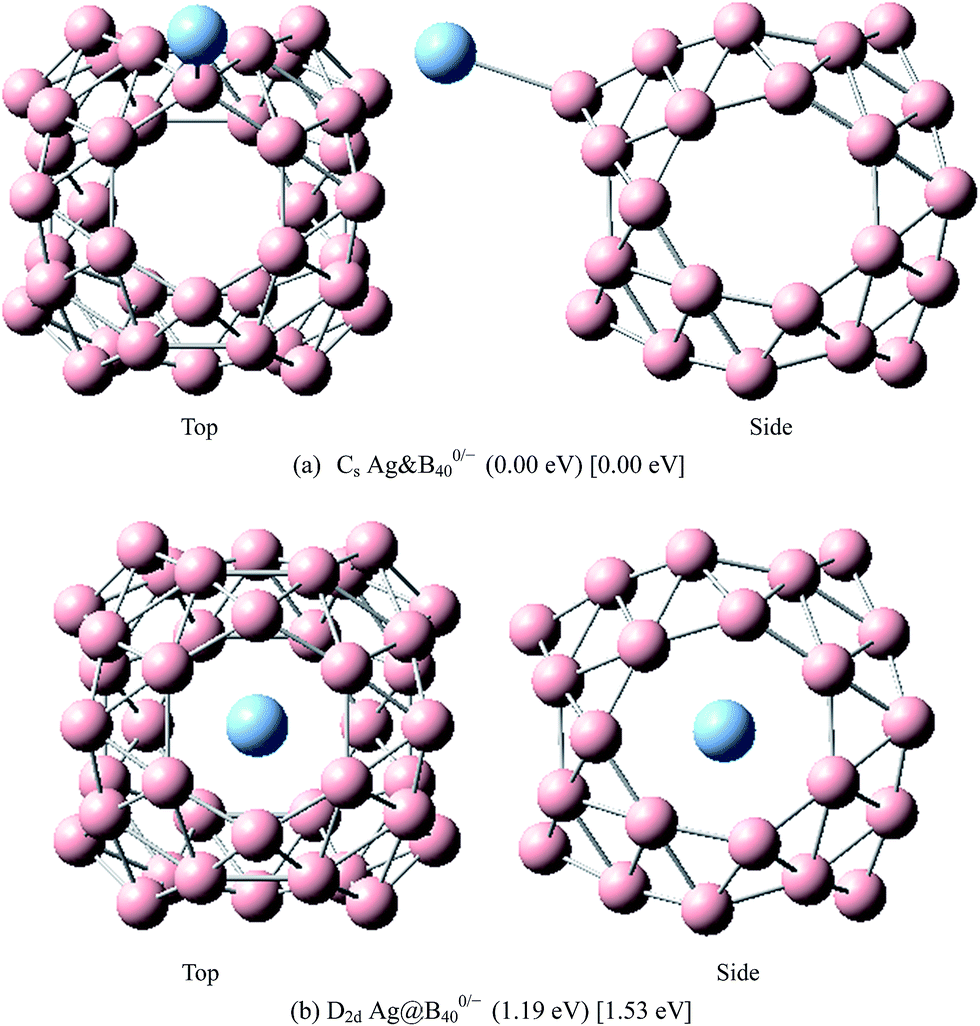
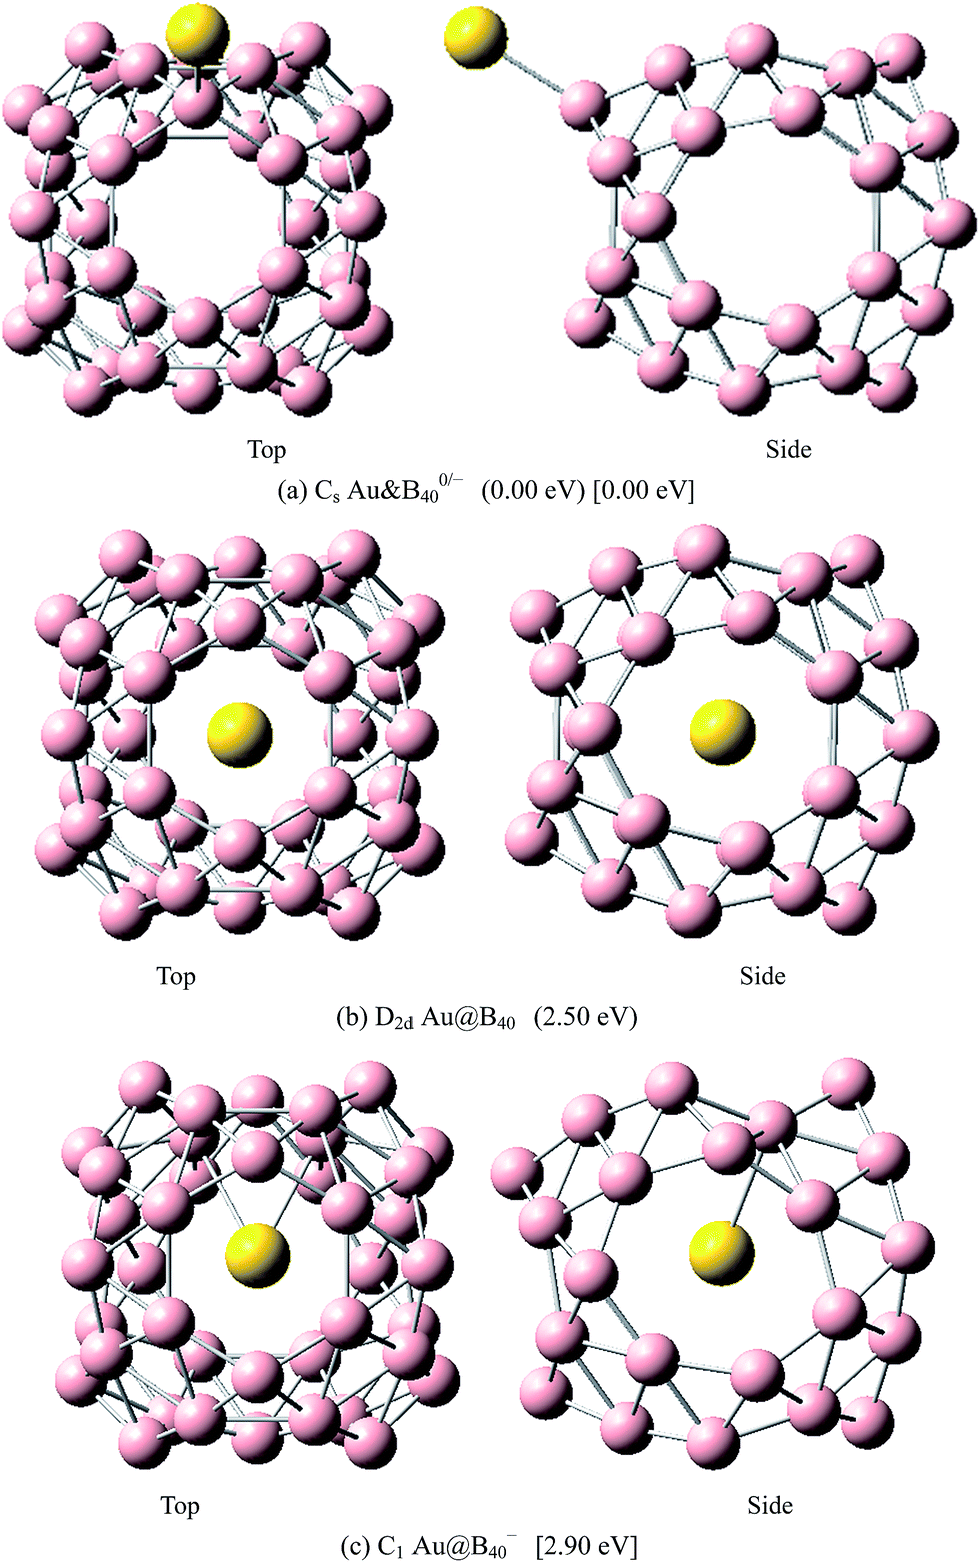
The above results indicate that the exohedral minimum is lower in energy than the endohedral minimum. To gain the further understanding of relative stabilities between the endohedral and exohedral structures of metalloborospherenes MB0/−40 (M = Cu, Ag, and Au), geometry optimizations and frequency calculations were performed for the two local minima in the six paths. Optimized structures of metalloborospherenes MB0/−40 (M = Cu, Ag, and Au) are depicted in Fig. S1–S3 (ESI†). Relative energy values of neutral and corresponding anionic metalloborospherenes MB0/−40 indicate that the exohedral minimum is lower in energy than the endohedral minimum. The results also reveal that Cu, Ag and Au atoms favor the exohedral configuration. For neutral and anionic metalloborospherenes CuB0/−40, the isomer (see Fig. S1(a)†) with Cu capping a heptagon (η7-Cu) is lower in energy than another exohedral and endohedral isomers. The results are same with the found that MB40 (M = Be, Mg, Li, and K) favor the exohedral geometries with the dopant face-capping a heptagon on the side surface (η7-M). For neutral and anionic metalloborospherenes MB0/−40 (M = Ag and Au), the isomer (see Fig. S2(a) or S3(a)†) with dopant bonding the side boron atom of the hexagonal ring is lower in energy than another exohedral and endohedral isomers. This isomer with Cs symmetry is predicted after the relaxation in the path Lyz. The result further proves the research results that single-molecule device Au–B40–Au which electrode is connected to the hexagonal ring is the most stable configuration.60 For most stable endohedral metalloborospherenes M@B0/−40, the calculated results indicate that Cu atom in Cu@B40− and Cu@B40 are off the molecular center and near the heptagonal ring. However, Ag atom in Ag@B0/−40 and Au atom in Au@B40 are at the molecular center. In addition, Au atom in Au@B40− is slightly off the molecular center. It's worth noting that configuration of Au@B40− has obvious changes and symmetry of Au@B40− reduces to C1. Frequency calculations confirm the stabilities of these most stable endohedral and exohedral metalloborospherenes by showing no imaginary frequencies. We will focus on the most stable endohedral and exohedral metalloborospherenes. The most stable endohedral and exohedral metalloborospherenes are depicted in Fig. 8–10, ground-state parameters are summarized in Table 1. As shown in Table 1, HOMO–LUMO energy gaps of metalloborospherenes MB40− (with closed-shell electronic structure) are smaller than HOMO–LUMO energy gap of borospherene B40 (3.13 eV).23 It indicates that the addition of metal atom (Cu, Ag, or Au) can reduce the HOMO–LUMO energy gap and improve the chemical activity of borospherene B40. In addition, dipole moments of Ag@B0/−40 and Au@B40 are zero among all the metalloborospherenes because of the highly symmetric structures (D2d), this indicates that they do not render far-infrared pure rotation spectrum. For each neutral metalloborospherene, the addition of metal with odd electrons introduces spin density into the boron framework (see Fig. S4†). For metalloborospherenes Cu&B40 and Cu&B40, the spin components are mainly distributed in the surface of the cage. For metalloborospherenes Ag&B40 and Au&B40, the spin components are mainly localized on metal and boron atoms in close proximity to metal. For metalloborospherenes Ag@B40 and Au@B40, the spin components are mainly localized on metal (or cage centers). Especially, for metalloborospherenes AgB40 and AuB40, the up-spin components are mainly contributed by the metal. These characteristics are expected to lead to interesting magnetic properties and potential application in metalloborospherene molecular devices.
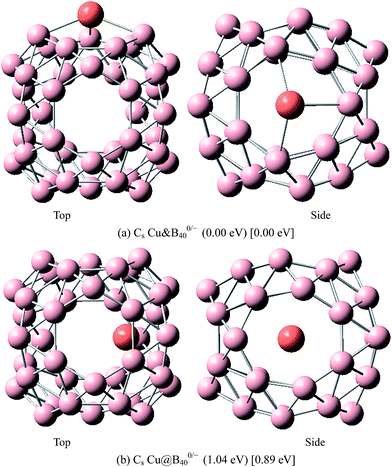 |
| | Fig. 8 The most stable endohedral and exohedral metalloborospherenes CuB0/−40. The round brackets denote the relative energies of neutral metalloborospherenes CuB40 (the energy of exohedral Cu&B40 is set to be zero) and the square brackets denote the relative energies of anionic metalloborospherenes CuB40− (the energy of exohedral Cu&B40− is set to be zero). | |
 |
| | Fig. 9 The most stable endohedral and exohedral metalloborospherenes AgB0/−40. The round brackets denote the relative energies of neutral metalloborospherenes AgB40 (the energy of exohedral Ag&B40 is set to be zero) and the square brackets denote the relative energies of anionic metalloborospherenes AgB40− (the energy of exohedral Ag&B40− is set to be zero). | |
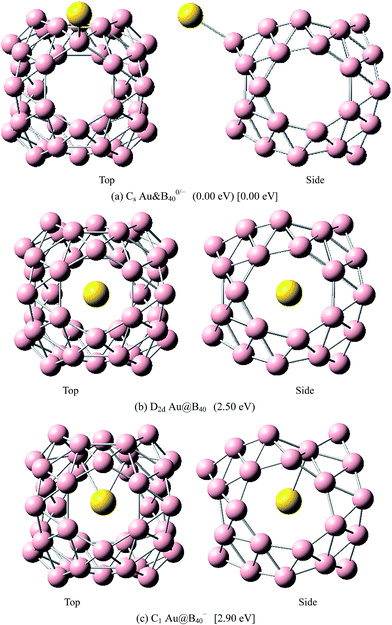 |
| | Fig. 10 The most stable endohedral and exohedral metalloborospherenes AuB0/−40. The round brackets denote the relative energies of neutral metalloborospherenes AuB40 (the energy of exohedral Au&B40 is set to be zero) and the square brackets denote the relative energies of anionic metalloborospherenes AuB40− (the energy of exohedral Au&B40− is set to be zero). | |
Table 1 The symmetries, relative energies (neutral CuB40: the energy of Cu&B40 is set to be zero, anionic CuB40−: the energy of Cu&B40− is set to be zero, neutral AgB40: the energy of Ag&B40 is set to be zero, anionic AgB40−: the energy of Ag&B40− is set to be zero, neutral AuB40: the energy of Au&B40 is set to be zero, anionic AuB40−: the energy of Au&B40− is set to be zero), energy gaps (Eg), dipole moments (μ), lowest frequencies, and states of metalloborospherenes MB0/−40 (M = Cu, Ag, and Au). The superscripts a and b denote the alpha electron and beta electron, respectively
| |
Symmetry |
Relative energy/eV |
Eg/eV |
μ/Debye |
State |
Lowest frequency/cm−1 |
| Cu&B40 |
Cs |
0.00 |
1.40a |
0.82 |
2A′ |
116 |
| 3.00b |
| Cu&B40− |
Cs |
0.00 |
1.21 |
0.68 |
1A′ |
107 |
| Cu@B40 |
Cs |
1.04 |
1.53a |
0.39 |
2A′ |
89 |
| 2.88b |
| Cu@B40− |
Cs |
0.89 |
1.52 |
0.56 |
1A′ |
92 |
| Ag&B40 |
Cs |
0.00 |
2.12a |
3.78 |
2A′ |
25 |
| 2.52b |
| Ag&B40− |
Cs |
0.00 |
1.83 |
3.49 |
1A′ |
36 |
| Ag@B40 |
D2d |
1.19 |
1.44a |
0.00 |
2B2 |
47 |
| 2.99b |
| Ag@B40− |
D2d |
1.53 |
1.51 |
0.00 |
1A1 |
52 |
| Au&B40 |
Cs |
0.00 |
2.45a |
0.65 |
2A′ |
34 |
| 2.21b |
| Au&B40− |
Cs |
0.00 |
2.20 |
4.76 |
1A′ |
44 |
| Au@B40 |
D2d |
2.50 |
1.80a |
0.00 |
2A1 |
25 |
| 3.14b |
| Au@B40− |
C1 |
2.90 |
2.30 |
2.46 |
1A |
67 |
Photoelectron spectra
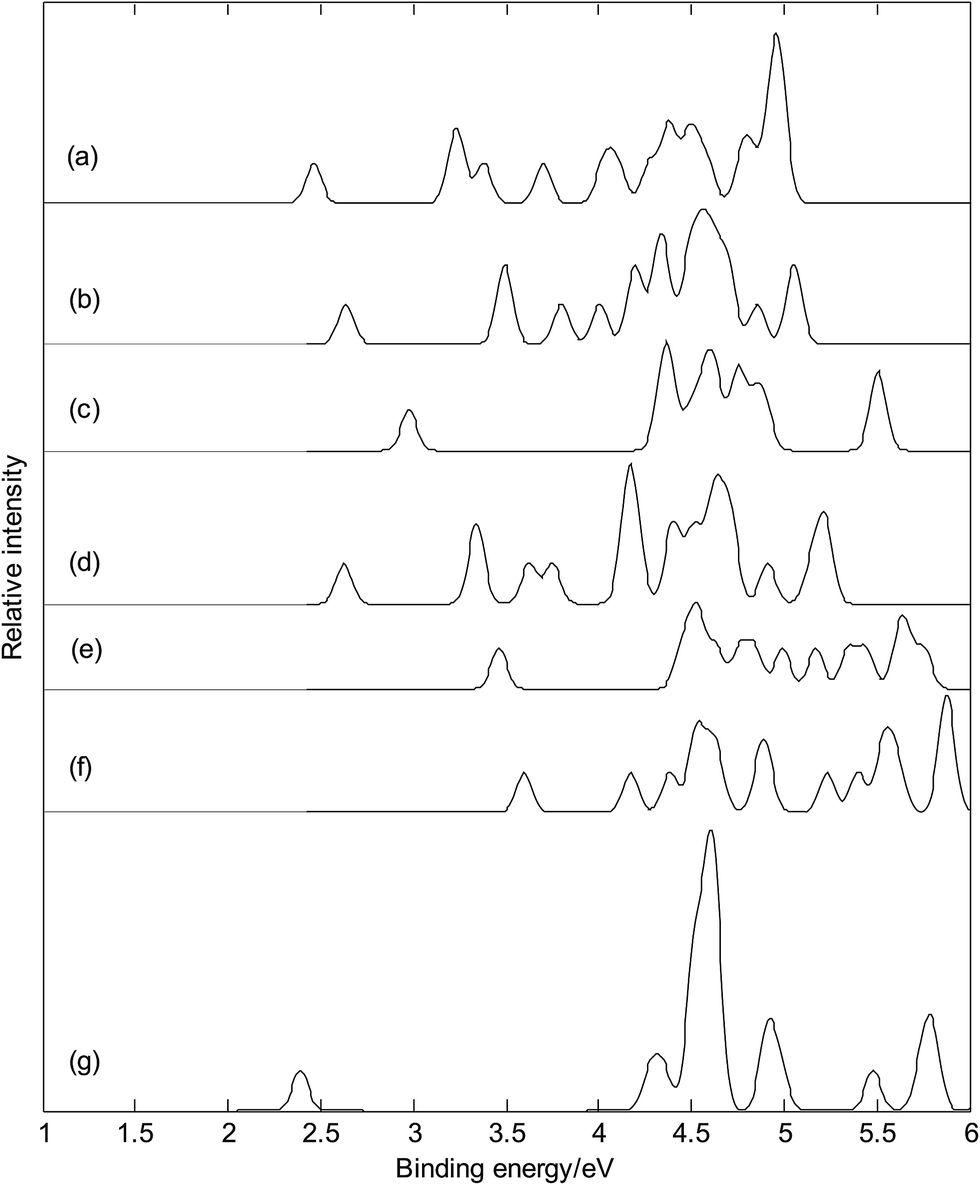
Photoelectron spectroscopy is powerful experimental technique to probe the electronic structure of cluster. It can be viewed as an electronic fingerprint for the underlying cluster. Photoelectron spectroscopy in combination with theoretical calculations has been used to understand and identify the structures of size-selected boron clusters.23,24 To facilitate future identifications of MB40− (M = Cu, Ag, and Au), the adiabatic detachment energies (ADEs) for metalloborospherenes MB40− (M = Cu, Ag, and Au) were calculated at the PBE0 level, then we calculated the vertical detachment energies (VDEs) and simulated the photoelectron spectra for metalloborospherenes MB40− (M = Cu, Ag, and Au), using the time-dependent DFT (TD-DFT) method.23,24,64 Adiabatic detachment energy of MB40− (M = Cu, Ag, and Au) represents the electron affinity (EA) of corresponding neutral metalloborospherenes MB40 (M = Cu, Ag, and Au). The larger EA can lead to the stronger probability of capturing an electron, i.e., the neutral MB40 with larger EA is easier to capture an electron. Metalloborospherenes MB40− (M = Cu, Ag, and Au) give the ground-state ADEs of 2.38(Cu&B40−), 2.53(Cu@B40−), 2.87(Ag&B40−), 2.53(Ag@B40−), 3.34(Au&B40−) and 2.94(Au@B40−) eV, respectively. Among the metalloborospherenes MB40− (M = Cu, Ag, and Au), Au&B40− has the largest ADE (3.34 eV), which is larger than the ADE (2.29 eV)23 of cage B40− and less than the ADE (3.51 eV)23 of quasi-planar B40−. The calculated results indicate that ground-state ADEs of metalloborospherenes MB40− (M = Cu, Ag, and Au) are larger than the ADE (2.29 eV)23 of cage B40− and less than the ADE (3.51 eV)23 of quasi-planar B40−, it suggests that doping of metal atom in B40 can increase the ADE.
Fig. 11 presents the photoelectron spectra (calculated VDEs were tabulated in Table S1†) of metalloborospherenes MB40− (M = Cu, Ag, and Au). The predicted photoelectron spectra show that Cu&B40− has the lowest first vertical detachment energy (VDE) and Ag&B40− has the largest energy gap (about 1.36 eV) between the first and second bands. The first several bands of photoelectron spectra were used to identify boron clusters,23,24 so we will focus on the bands at the low binding energy side. The first peaks of these photoelectron spectra come from the calculated ground-state VDEs of Cu&B40−, Cu@B40−, Ag&B40−, Ag@B40−, Au&B40− and Au@B40− at 2.46, 2.64, 2.98, 2.63, 3.46 and 3.60 eV, respectively. The calculated ground-state VDEs of metalloborospherenes MB40− (M = Cu, Ag, and Au) originate from the detachment of the electron from the molecular orbital (HOMO). The second peak of Cu&B40− comes from the second and third calculated VDEs at 3.22 and 3.25 eV which originate from detaching the electrons from HOMO−1 and HOMO−2. The second peaks of Cu@B40− come from the second and third calculated VDEs at 3.49 and 3.50 eV. The second peak of Ag&B40− comes from the second to fourth calculated VDEs at 4.34, 4.37, and 4.39 eV, respectively. The second to fourth calculated VDEs of metalloborospherene Ag&B40− originate from detaching the electrons from HOMO−1 to HOMO−3. The second peak of Ag@B40− comes from the second and third calculated VDEs, interestingly, the second and third calculated VDEs of metalloborospherene Ag@B40− are overlapped. The second peak of Au&B40− comes from the second to fourth calculated VDEs at 4.45, 4.52, and 4.54 eV, respectively. The second to fourth calculated VDEs of metalloborospherene Au&B40− originate from detaching the electrons from HOMO−1 to HOMO−3. The second and third peaks of Au@B40− come from the second and third calculated VDEs at 4.17 and 4.38 eV, respectively. Fig. 11 indicates that metalloborospherenes MB40− (M = Cu, Ag, and Au) have different spectral features, especially the endohedral and corresponding exohedral metalloborospherenes have different spectral bands at the low binding energy side. These features can be used to distinguish the metalloborospherenes MB40− (M = Cu, Ag, and Au).
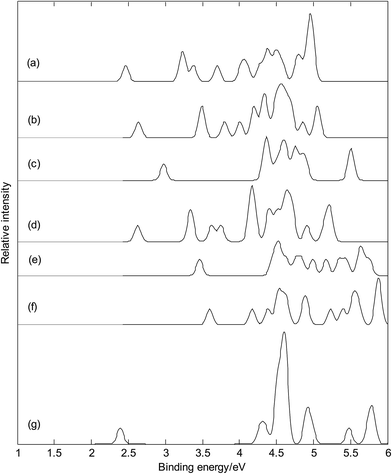 |
| | Fig. 11 Simulated photoelectron spectra of metalloborospherenes MB40− (M = Cu, Ag, and Au) and borospherene B40−. (a): Cs Cu&B40−, (b): Cs Cu@B40−, (c): Cs Ag&B40−, (d): D2d Ag@B40−, (e): Cs Au&B40−, (f): C1 Au@B40−, (g): D2d B40−. The simulations were done by fitting the distributions of calculated vertical detachment energies at the PBE0 level with unit-area Gaussian functions of 0.05 eV half-width. | |
Fig. 11(a–f) and photoelectron spectra of borospherene B40− (see Fig. 11(g))23 indicate that the addition of metal atom modifies the photoelectron spectra of borospherene B40− since the addition of extra atom modifies the electronic structure. The calculated results indicate that doping of metal atom in borospherene can increase the first VDE compared to the first VDE of B40−. The predicted photoelectron spectra in Fig. 11 provide important information for the identification of metalloborospherenes MB40− (M = Cu, Ag, and Au). It is worth to note that the structures of atomic clusters cannot directly be identified by common analytical experimental methods, but they can indirectly be determined by using combined theoretical and experimental studies. As the discovery of B40, if the photoelectron spectra of metalloborospherenes MB40− (M = Cu, Ag, and Au) are obtained in experiments, these calculated characteristic bands may be used as theoretical basis for the identification of metalloborospherenes MB40− (M = Cu, Ag, and Au).
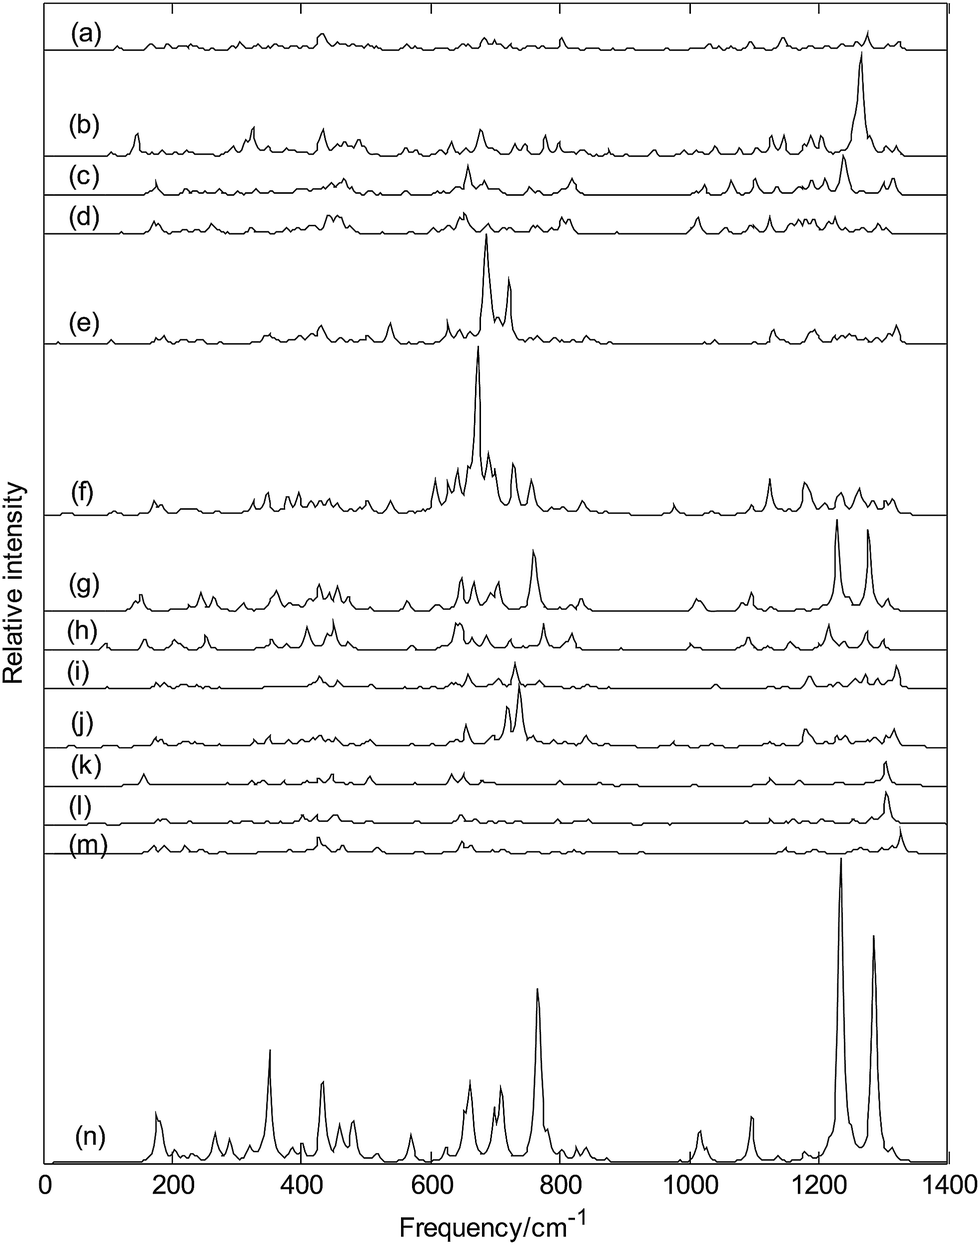
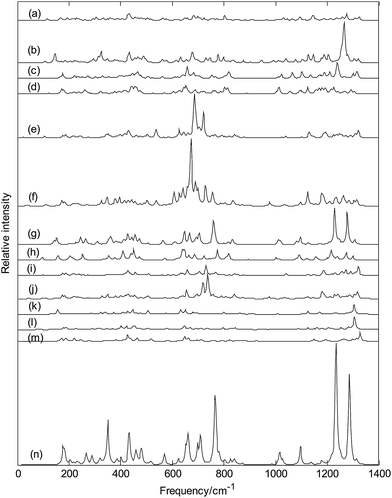
Infrared spectra
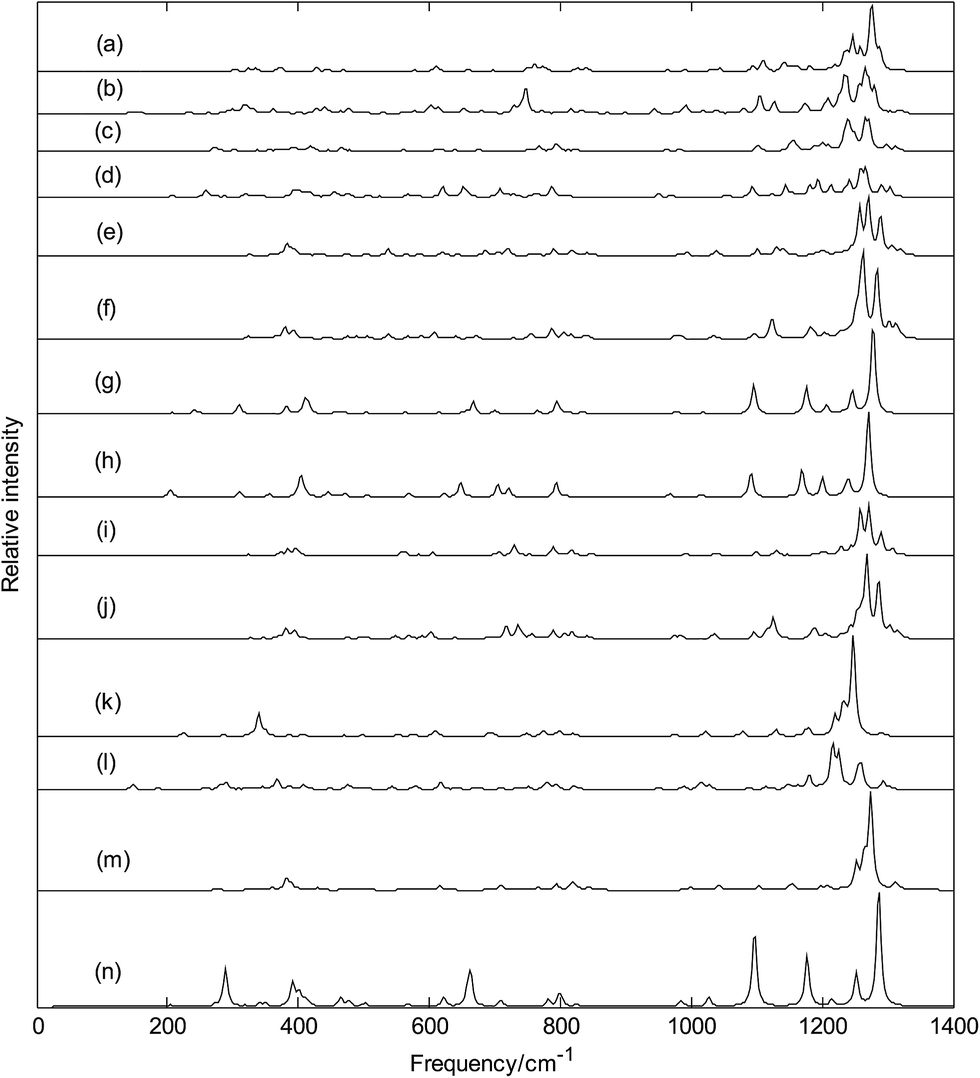
Infrared spectra of metalloborospherenes MB0/−40 (M = Cu, Ag, and Au) are given in Fig. 12 (spectral data were tabulated in Tables S2–S13†), these infrared peaks distribute in three regions: low frequency region (from 0 cm−1 to 500 cm−1), middle frequency region (from 500 cm−1 to 1000 cm−1) and high frequency region (from 1000 cm−1 to 1400 cm−1), and the main strong infrared peaks are located in the high frequency region (from 1000 cm−1 to 1400 cm−1). The highest frequency is 1323 cm−1 for Cu&B40, 1319 cm−1 for Cu&B40−, 1314 cm−1 for Cu@B40, 1305 cm−1 for Cu@B40−, 1320 cm−1 for Ag&B40, 1314 cm−1 for Ag&B40−, 1307 cm−1 for Ag@B40, 1299 cm−1 for Ag@B40−, 1320 cm−1 for Au&B40, 1316 cm−1 for Au&B40− 1304 cm−1 for Au@B40, and 1306 cm−1 for Au@B40−. These vibrational modes are formed by stretching vibrations of boron atoms. In addition, they are close to the highest vibrational frequency of D2d B40 (1327 cm−1). The lowest vibrational frequency is 116 cm−1 for Cu&B40, 107 cm−1 for Cu&B40−, 89 cm−1 for Cu@B40, 92 cm−1 for Cu@B40−, 25 cm−1 for Ag&B40, 36 cm−1 for Ag&B40−, 47 cm−1 for Ag@B40, 52 cm−1 for Ag@B40−, 34 cm−1 for Au&B40, 44 cm−1 for Au&B40−, 25 cm−1 for Au@B40, and 67 cm−1 for Au@B40−. These vibrational modes are formed by vibrations of metal atoms. Unlike the highest frequencies of metalloborospherenes MB0/−40 (M = Cu, Ag, and Au), these lowest vibrational frequencies of metalloborospherenes MB0/−40 (M = Cu, Ag, and Au) are much lower than the lowest vibrational frequency of borospherene B40 (170 cm−1).
 |
| | Fig. 12 Predicted infrared spectra of metalloborospherenes MB0/−40 (M = Cu, Ag, and Au) and borospherenes B0/−40. (a): Cs Cu&B40, (b): Cs Cu&B40−, (c): Cs Cu@B40, (d): Cs Cu@B40−, (e): Cs Ag&B40, (f): Cs Ag&B40−, (g): D2d Ag@B40, (h): D2d Ag@B40−, (i): Cs Au&B40, (j): Cs Au&B40−, (k): D2d Au@B40, (l): C1 Au@B40−, (m): D2d B40, (n): D2d B40−. | |
The sharpest peaks of Cu&B40, Cu&B40−, Cu@B40, Cu@B40−, Ag&B40, Ag&B40−, Ag@B40, Ag@B40−, Au&B40, Au&B40−, Au@B40 and Au@B40− are at 1275, 1265, 1265, 1266, 1270, 1262, 1278, 1271, 1271, 1268, 1247 and 1217 cm−1, respectively. These vibrational modes are formed by stretching vibrations of boron atoms. Note that the most sharpest peaks of metalloborospherenes MB0/−40 (M = Cu, Ag, and Au) are located at about 1270 cm−1 and almost same with the location (at 1274 cm−1) of sharpest peak for borospherene B40.40 Owing to the high symmetry (D2d) of Ag@B40, Ag@B40−, and Au@B40, there are doubly degenerate vibrational modes. However, the other structures have only non-degenerate vibrational modes. Like the infrared spectra of borospherene B40,39,40 some vibrational modes of endohedral Ag@B0/−40 and Au@B40 are infrared inactive. However, all the vibrational modes of other structures are infrared active modes, it suggest that doping of metal atom can add the spectra active modes.
It's worth noting that Fig. 12(e and i) show that exohedral Ag&B40 and Au&B40 have similar infrared spectra, and Fig. 12(f and j) show that exohedral Ag&B40− and Au&B40− have similar infrared spectra. In addition, Fig. 12(g and h) show that endohedral Ag@B40 and Ag@B40− have similar infrared spectra, but the main peaks of anionic Ag@B40− are redshifted somewhat since the extra electron modifies the electronic structures. It's worth noting that the infrared spectra of endohedral Ag@B0/−40 are quite similar to that of dianion B40− (see Fig. 12(n)).40 However, Fig. 12(k) shows that the infrared spectra of endohedral Au@B40 is similar to that of B40 (see Fig. 12(m)). Except for Ag@B0/−40 and Au@B40, infrared spectra of other metalloborospherenes are different from that of B0/−40,40 the metal dopant in B40 changes the IR spectra of B40 such as some weakened vibrational modes and some enhanced characteristic peaks. These spectral characteristics suggest that location of dopant and charge of metalloborospherene play an important role in infrared spectra. The predicted infrared spectra also provide some information for the identification of metalloborospherenes MB0/−40 (M = Cu, Ag, and Au), these different characteristic peaks also provide a theoretical basis for the identification and confirmation of metalloborospherenes MB0/−40 (M = Cu, Ag, and Au).
Raman spectra
Fig. 13 depicts the Raman spectra of metalloborospherenes MB0/−40 (M = Cu, Ag, and Au), the sharpest peaks of Cu&B40, Cu&B40−, Cu@B40, Cu@B40−, Ag&B40, Ag&B40−, Ag@B40, Ag@B40−, Au&B40, Au&B40−, Au@B40 and Au@B40− are at 435, 1265, 1238, 654, 685, 672, 1229, 775, 1320, 737, 1304 and 1306 cm−1, respectively. Unlike the infrared spectra of MB0/−40 (M = Cu, Ag, and Au), the sharpest Raman peaks of metalloborospherenes MB0/−44 (M = Li, Na, and K) are at middle or high frequency region. Among the Raman active modes, the typical radial breathing modes of Cu&B40, Cu&B40−, Cu@B40, Cu@B40−, Ag&B40, Ag&B40−, Ag@B40, Ag@B40−, Au&B40, Au&B40− and Au@B40 are at 166, 145, 166, 181, 175, 171, 153, 158, 175, 173 and 157 cm−1, respectively, which are similar to the typical radial breathing mode of B40 at 170 cm−1.66 The breathing modes are used to identify the hollow structures in nanotubes. These typical radial breathing modes are close to the location of B40, it suggests that the addition of metal atoms just lead to small change of B40 configuration. However, Au@B40− has not the radial breathing mode near the frequency of 170 cm−1 which further indicates that Au@B40− has obvious changes. The calculated results indicate that all the vibrational modes of exohedral MB0/−40 (M = Cu, Ag, and Au) and endohedral Cu@B0/−40 and Au@B40− are infrared active and Raman active. However, like the borospherene B40,39,40 there are some silent modes in endohedral Ag@B0/−40 and Au@B40, which means that these vibrational modes are Raman inactive and infrared inactive.
 |
| | Fig. 13 Predicted Raman spectra of metalloborospherenes MB0/−40 (M = Cu, Ag, and Au) and borospherenes B0/−40. (a): Cs Cu&B40, (b): Cs Cu&B40−, (c): Cs Cu@B40, (d): Cs Cu@B40−, (e): Cs Ag&B40, (f): Cs Ag&B40−, (g): D2d Ag@B40, (h): D2d Ag@B40−, (i): Cs Au&B40, (j): Cs Au&B40−, (k): D2d Au@B40, (l): C1 Au@B40−, (m): D2d B40, (n): D2d B40−. | |
Fig. 13(g and h) show that endohedral Ag@B40 and Ag@B40− have the similar Raman spectra, however, the addition of an electron weakens the main characteristic peaks. It's worth noting that the Raman spectra of endohedral Ag@B0/−40 are some similar to that of dianion B40− (see Fig. 13(n)) and Raman spectra of endohedral Au@B40 are some similar to that of B40 (see Fig. 13(m)).34 Except for Ag@B0/−40 and Au@B40, Fig. 13 indicates that doping of metal atom in B40 also changes the Raman peaks of B40 such as some weakened vibrational modes and some enhanced characteristic peaks.40 In addition, Raman spectra of endohedral metalloborospherenes are different from that of corresponding exohedral metalloborospherenes, these spectral characteristics can be used to identify the endohedral and exohedral configurations.
Raman spectra, as the supplement of infrared spectra, can be used for the basis of identification of metalloborospherenes MB0/−40 (M = Cu, Ag, and Au). From the infrared and Raman spectra of each metalloborospherene, we can find, at some frequencies, infrared absorption peaks are strong, but the Raman peaks are very weak. However, at some frequencies, infrared absorption peaks are very weak (or infrared inactive), but the Raman peaks are strong. In addition, at some frequencies, both the infrared and Raman peaks are strong. Infrared intensity is proportional to |∂![[small mu, Greek, vector]](https://www.rsc.org/images/entities/i_char_e0e9.gif) /∂Qi|2,67,68 where is the electric dipole moment and Qi is the normal-mode coordinate. A vibrational mode of molecular with no change of dipole moment is infrared inactive, we can't obtain the normal mode frequency from the infrared spectral data in experiments. However, this vibrational mode may lead to the change of polarizability, this indicates that the vibrational mode is Raman active. The calculated Raman spectra can be useful for analytical purposes and contribute significantly to spectral interpretation and vibrational assignments, also can provide technical guidance for future synthesis.
/∂Qi|2,67,68 where is the electric dipole moment and Qi is the normal-mode coordinate. A vibrational mode of molecular with no change of dipole moment is infrared inactive, we can't obtain the normal mode frequency from the infrared spectral data in experiments. However, this vibrational mode may lead to the change of polarizability, this indicates that the vibrational mode is Raman active. The calculated Raman spectra can be useful for analytical purposes and contribute significantly to spectral interpretation and vibrational assignments, also can provide technical guidance for future synthesis.
Electronic absorption spectra
Finally, we calculated electronic absorption spectra of exohedral metalloborospherenes M&B0/−40 (M = Cu, Ag, and Au), as shown in Fig. 14. The previous research results show that B40 has only UV-Vis absorption bands (see Fig. 14(g)),39,40 however, one can observe several near infrared (NIR) absorption bands of metalloborospherenes M&B40− (M = Cu, Ag, and Au) from 780 to 3000 nm. It suggests that doping of metal atom in B40 can redshift the electronic spectra. Fig. 14(a) presents the electronic spectra of Cu&B40, the largest excitation wavelength (first excited state) is 2175 nm. The absorption band in region NIR from 1500 to 2500 nm comes from the first three excited states which originate from the electron transitions from α-HOMO to α-LUMO/α-LUMO+1/α-LUMO+2. Fig. 14(b) presents the electronic absorption spectra of Cu&B40−, the largest excitation wavelength is 2701 nm. The absorption band in region NIR from 2500 to 3000 nm comes from the first excited state which originates from the electron transitions from HOMO to LUMO. Fig. 14(a and b) indicate that electronic spectra of Cu&B40− are apparently red-shifted comparing with Cu&B40. Fig. 14(c) presents the electronic spectra of the Ag&B40. The largest excitation wavelength is 898 nm. The absorption band in region NIR from 800 to 1000 nm comes from the first two excited states which originate from the electron transitions of α-HOMO → α-LUMO/α-LUMO+1 coupled with β-HOMO/β-HOMO−1/β-HOMO−2/β-HOMO−7 → β-LUMO. Fig. 14(d) presents the electronic spectra of the Ag&B40−. The largest excitation wavelength is 1054 nm. The absorption band in region NIR from 1000 to 1200 nm comes from the first excited state which originates from the electron transitions from HOMO to LUMO/LUMO+2. Fig. 14(e) presents the electronic absorption spectra of the Au&B40, the largest excitation wavelength is 988 nm. The weak absorption band in region NIR from 800 to 1000 nm comes from the first four excited states which originate from the electron transitions of α-HOMO → α-LUMO+1 coupled with β-HOMO/β-HOMO−1/β-HOMO−2/β-HOMO−3/β-HOMO−4 → β-LUMO. Fig. 14(f) presents the electronic absorption spectra of the Au&B40−, the largest excitation wavelength is 828 nm. The absorption band in region NIR from 780 to 900 nm comes from the first excited state which originates from the electron transitions from HOMO to LUMO. Other NIR absorption bands of metalloborospherenes MB0/−40 (M = Cu, Ag, and Au) come from the higher excited states which originate from the electron transitions of corresponding orbits.
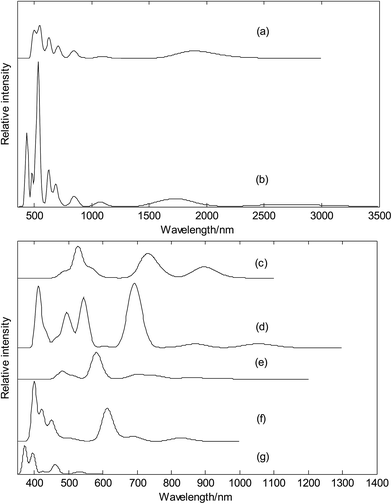 |
| | Fig. 14 Predicted electronic absorption spectra of exohedral metalloborospherenes MB0/−40 (M = Cu, Ag, and Au) and borospherene B40. (a): Cs Cu&B40, (b): Cs Cu&B40−, (c): Cs Ag&B40, (d): Cs Ag&B40−, (e): Cs Au&B40, (f): Cs Au&B40−, (g): D2d B40. | |
For the metalloborospherenes M&B40− (M = Cu, Ag, and Au) with closed-shell electronic structure, the minimum excitation energy (the largest excitation wavelength) mainly comes from the electron transition from HOMO to LUMO. HOMO–LUMO energy gap reflects the probability of the molecules jumping from ground state to excited state. Generally speaking, the larger energy gap can lead to the larger electron excitation energy, i.e., the smaller the probability of electronic transition. On the contrary, the molecule with smaller energy gap is easier to jump to the excited state. According to the previous results, the HOMO–LUMO energy gaps are 1.2113, 1.8272 and 2.1975 eV for Cu&B40−, Ag&B40−, and Au&B40−, respectively. Although the energy gap of ground state does not represent the minimum excitation energy, the increasing HOMO–LUMO energy gaps just reflect the decreasing largest excitation wavelengths 2701, 1054 and 828 nm for Cu&B40−, Ag&B40−, and Au&B40−, respectively. The calculated electronic spectra may be used for the structural analysis in conjunction with other techniques.
Conclusions
In a summary, the structures, stabilities, photoelectron spectra, infrared spectra, Raman spectra, and electronic absorption spectra of metalloborospherenes MB40− (M = Cu, Ag, and Au) have been studied at the level of density functional theory (DFT) and time-dependent density functional theory (TD-DFT). Potential energy scan confirms that there are two possible ground state geometries where dopant can exist outside or inside cage. In addition, potential energy scan confirms metalloborospherenes MB40− (M = Ag and Au) have a very high energy barrier around the surface of B40 and the energy barrier can confine dopant inside B40. The further calculated results suggest that Cu, Ag, and Au atoms can form stable exohedral metalloborospherenes M&B0/−40 (M = Cu, Ag, and Au) and endohedral metalloborospherenes M@B0/−40 (M = Cu, Ag, and Au). In addition, relative energies of these metalloborospherenes reveal that the Cu, Ag, and Au atoms favor the exohedral configuration. The calculated photoelectron spectra show that metalloborospherenes MB40− (M = Cu, Ag, and Au) have different and meaningful photoelectron spectra which can be used as theoretical basis for the identification of metalloborospherenes MB40− (M = Cu, Ag, and Au). The calculated infrared spectra suggest that location of dopant and charge of metalloborospherenes play an important role in infrared spectra. In addition, the calculated electronic spectra indicate that metalloborospherenes MB40− (M = Cu, Ag, and Au) have obvious near-IR absorption peaks. These spectral features are readily compared with future spectroscopy measurements and can be used as fingerprints to identify and distinguish the metalloborospherenes MB0/−40 (M = Cu, Ag, and Au). The metalloborospherenes MB0/−40 (M = Cu, Ag, and Au) have provided an important clue for the development of new boron-based materials such as molecular device.
Conflict of interest
There are no conflicts of interest to declare.
Acknowledgements
This work was supported by the Growth Foundation for Young Scientists of Education Department of Guizhou Province, China (Grant No. QJH KY[2016]217), and the International Science & Technology Cooperation Program of China (Grant No. 2014DFA00670).
Notes and references
- H. W. Kroto, J. R. Heath, S. C. Obrien, R. F. Curl and R. E. Smalley, Nature, 1985, 318, 162 CrossRef CAS.
- H. J. Zhai, B. Kiran, J. Li and L. S. Wang, Nat. Mater., 2003, 2, 827 CrossRef CAS PubMed.
- I. A. Popov, Z. A. Piazza, W. L. Li, L. S. Wang and A. I. Boldyrev, J. Chem. Phys., 2013, 139, 144307 CrossRef PubMed.
- Z. A. Piazza, H. S. Hu, W. L. Li, Y. F. Zhao, J. Li and L. S. Wang, Nat. Commun., 2014, 5, 3113 Search PubMed.
- A. P. Sergeeva, D. Y. Zubarev, H. J. Zhai, A. I. Boldyrev and L. S. Wang, J. Am. Chem. Soc., 2008, 130, 7244 CrossRef CAS PubMed.
- W. L. Li, Q. Chen, W. J. Tian, H. Bai, Y. F. Zhao, H. S. Hu, J. Li, H. J. Zhai, S. D. Li and L. S. Wang, J. Am. Chem. Soc., 2014, 136, 12257 CrossRef CAS PubMed.
- E. Oger, N. R. Crawford, R. Kelting, P. Weis, M. M. Kappes and R. Ahlrichs, Angew. Chem., Int. Ed., 2007, 46, 8503 CrossRef CAS PubMed.
- A. N. Alexandrova, A. I. Boldyrev, H. J. Zhai and L. S. Wang, Coord. Chem. Rev., 2006, 250, 2811 CrossRef CAS.
- A. P. Sergeeva, I. A. Popov, Z. A. Piazza, W. L. Li, C. Romanescu, L. S. Wang and A. I. Boldyrev, Acc. Chem. Res., 2014, 47, 1349 CrossRef CAS PubMed.
- N. G. Szwacki, A. Sadrzadeh and B. I. Yakobson, Phys. Rev. Lett., 2007, 98, 166804 CrossRef PubMed.
- X. L. Sheng, Q. B. Yan, Q. R. Zheng and G. Su, Phys. Chem. Chem. Phys., 2009, 11, 9696 RSC.
- L. Wang, J. J. Zhao, F. Y. Li and Z. F. Chen, Chem. Phys. Lett., 2010, 501, 16 CrossRef CAS.
- C. Özdoğan, S. Mukhopadhyay, W. Hayami, Z. B. Güvenç, R. Pandey and I. Boustani, J. Phys. Chem. C, 2010, 114, 4362 Search PubMed.
- L. J. Cheng, J. Chem. Phys., 2012, 136, 104301 CrossRef PubMed.
- H.-G. Lu and S. D. Li, J. Chem. Phys., 2013, 139, 224307 CrossRef PubMed.
- J. Lv, Y. C. Wang, L. Zhu and Y. M. Ma, Nanoscale, 2014, 6, 11692–11696 RSC.
- H. T. Pham, L. V. Duong and M. T. Nguyen, J. Phys. Chem. C, 2014, 118, 24181 CAS.
- L. V. Duong, H. T. Pham, N. M. Tam and M. T. Nguyen, Phys. Chem. Chem. Phys., 2014, 16, 19470 RSC.
- T. B. Tai, L. V. Duong, H. T. Pham, D. T. T. Maia and M. T. Nguyen, Chem. Commun., 2014, 50, 1558 RSC.
- H. Tang and S. Ismail-Beigi, Phys. Rev. Lett., 2007, 99, 115501 CrossRef PubMed.
- D. L. V. K. Prasad and E. D. Jemmis, Phys. Rev. Lett., 2008, 100, 165504 CrossRef PubMed.
- D. L. V. K. Prasad and E. D. Jemmis, Appl. Phys. Lett., 2010, 96, 023108 CrossRef.
- H. J. Zhai, Y. F. Zhao, W. L. Li, Q. Chen, H. Bai, H. S. Hu, Z. A. Piazza, W. J. Tian, H. G. Lu, Y. B. Wu, Y. W. Mu, G. F. Wei, Z. P. Liu, J. Li, S. D. Li and L. S. Wang, Nat. Chem., 2014, 6, 727 CAS.
- Q. Chen, W. L. Li, Y. F. Zhao, S. Y. Zhang, H. S. Hu, H. Bai, H. R. Li, W. J. Tian, H. G. Lu, H. J. Zhai, S. D. Li, J. Li and L. S. Wang, ACS Nano, 2015, 9, 754 CrossRef CAS PubMed.
- G. Martínez-Guajardo, J. L. Cabellos, A. Díaz-Celaya, S. Pan, R. Islas, P. K. Chattaraj, T. Heine and G. Merino, Sci. Rep., 2015, 5, 11287 CrossRef PubMed.
- H. L. Dong, T. J. Hou, S. T. Lee and Y. Y. Li, Sci. Rep., 2015, 5, 09952 CrossRef CAS PubMed.
- I. A. Popov, T. Jian, G. V. Lopez, A. I. Boldyrev and L. S. Wang, Nat. Commun., 2015, 6, 8654 CrossRef CAS PubMed.
- T. Jian, W. L. Li, I. A. Popov, G. V. Lopez, X. Chen, A. I. Boldyrev, J. Li and L. S. Wang, J. Chem. Phys., 2016, 144, 154310 CrossRef PubMed.
- Y. J. Wang, Y. F. Zhao, W. L. Li, T. Jian, Q. Chen, X. R. You, T. Ou, X. Y. Zhao, H. J. Zhai, S. D. Li, J. Li and L. S. Wang, J. Chem. Phys., 2016, 144, 064307 CrossRef PubMed.
- H. R. Li, T. Jian, C. Q. Miao, Y. J. Wang, Q. Chen, X. M. Luo, K. Wang, H. J. Zhai, S. D. Li and L. S. Wang, Phys. Chem. Chem. Phys., 2016, 18, 29147 RSC.
- W. L. Li, R. Pal, Z. A. Piazza, X. C. Zeng and L. S. Wang, J. Chem. Phys., 2015, 142, 204305 CrossRef PubMed.
- T. B. Tai and M. T. Nguyen, Chem. Commun., 2016, 52, 1653 RSC.
- S. X. Li, Z. P. Zhang, Z. W. Long and S. J. Qin, Sci. Rep., 2017, 7, 40081 CrossRef CAS PubMed.
- T. B. Tai and M. T. Nguyen, RSC Adv., 2017, 7, 22243 RSC.
- T. B. Tai and M. T. Nguyen, Chem. Commun., 2015, 51, 7677 RSC.
- S. G. Xu, Y. J. Zhao, J. H. Liao and X. B. Yang, J. Chem. Phys., 2015, 142, 214307 CrossRef PubMed.
- N. Karmodak and E. D. Jemmis, Chem.–Asian J., 2016, 11, 3350 CrossRef CAS PubMed.
- H. L. Dong, B. Lin, K. Gilmore, T. J. Hou, S. T. Lee and Y. Y. Li, Curr. Appl. Phys., 2015, 15, 1084 CrossRef.
- R. X. He and X. C. Zeng, Chem. Commun., 2015, 51, 3185 RSC.
- S. X. Li, Z. P. Zhang, Z. W. Long, G. Y. Sun and S. J. Qin, Sci. Rep., 2016, 6, 25020 CrossRef CAS PubMed.
- S. Bosi, R. T. Da, G. Spalluto and M. Prato, Eur. J. Med. Chem., 2003, 38, 913 CrossRef CAS PubMed.
- R. Bakry, R. M. Vallant, M. Najam-ul-Haq, M. Rainer, Z. Szabo, C. W. Huck and G. K. Bonn, Int. J. Nanomed., 2007, 2, 639 CAS.
- P. W. M. Blom, V. D. Mihailetchi, L. J. A. Koster and D. E. Markov, Adv. Mater., 2007, 19, 1551 CrossRef CAS.
- B. Liu, R. Q. Png, L. H. Zhao, L. L. Chua, R. H. Friend and P. K. Ho, Nat. Commun., 2012, 3, 1321 CrossRef PubMed.
- V. Buntar and H. W. Weber, Supercond. Sci. Technol., 1996, 9, 599 CrossRef CAS.
- Y. Chai, T. Guo, C. M. Jin, R. E. Haufler, L. P. F. Chibante, J. Fure, L. H. Wang, J. M. Alford and R. E. Smalley, J. Phys. Chem., 1991, 95, 7564 CrossRef CAS.
- D. S. Bethune, R. D. Johnson, J. R. Salem, M. S. Vries and C. S. Yannoni, Nature, 1993, 366, 123 CrossRef CAS.
- T. Hirata, R. Hatakeyama, T. Mieno and N. Sato, J. Vac. Sci. Technol., A, 1996, 14, 615 CAS.
- M. N. Chaur, F. Melin, A. L. Ortiz and L. Echegoyen, Angew. Chem., Int. Ed., 2009, 48, 7514 CrossRef CAS PubMed.
- H. Bai, Q. Chen, H. J. Zhai and S. D. Li, Angew. Chem., Int. Ed., 2015, 54, 941 CrossRef CAS PubMed.
- P. Jin, Q. H. Hou, C. C. Tang and Z. F. Chen, Theor. Chem. Acc., 2015, 134, 13 CrossRef.
- W. Fa, S. Chen, S. Pande and X. C. Zeng, J. Phys. Chem. A, 2015, 119, 11208 CrossRef CAS PubMed.
- Q. Chen, T. Gao, W. J. Tian, H. Bai, S. Y. Zhang, H. R. Li, C. Q. Miao, Y. W. Mu, H. G. Lu, H. J. Zhai and S. D. Li, Phys. Chem. Chem. Phys., 2015, 17, 19690 RSC.
- Q. Chen, H. R. Li, C. Q. Miao, Y. J. Wang, H. G. Lu, Y. W. Mu, G. M. Ren, H. J. Zhai and S. D. Li, Phys. Chem. Chem. Phys., 2016, 18, 11610 RSC.
- Q. Chen, H. R. Li, W. J. Tian, H. G. Lu, H. J. Zhai and S. D. Li, Phys. Chem. Chem. Phys., 2016, 18, 14186 RSC.
- W. J. Tian, Q. Chen, H. R. Li, M. Yan, Y. W. Mu, H. G. Lu, H. J. Zhai and S. D. Li, Phys. Chem. Chem. Phys., 2016, 18, 9922 RSC.
- P. Jin, L. Yang, C. Liu, Q. H. Hou and L. L. Li, Theor. Chem. Acc., 2017, 136, 56 CrossRef.
- W. Wang, Y. D. Guo and X. H. Yan, RSC Adv., 2016, 6, 40155 RSC.
- Y. P. An, M. J. Zhang, D. P. Wu, Z. M. Fu, T. T. Wang and C. X. Xia, Phys. Chem. Chem. Phys., 2016, 18, 12024 RSC.
- Z. Yang, Y. L. Ji, G. Q. Lan, L. C. Xu, X. G. Liu and B. S. Xu, Solid State Commun., 2015, 217, 38 CrossRef CAS.
- M. Moradi, Z. Bagheri and A. Bodaghi, Phys. E, 2017, 89, 148 CrossRef CAS.
- M. Moradi, V. Vahabi and A. Bodaghi, J. Mol. Liq., 2016, 223, 315 CrossRef CAS.
- Y. Noguchi, O. Sugino, H. Okada and Y. Matsuo, J. Phys. Chem. C, 2013, 117, 15362 CAS.
- R. Bauernschmitt and R. Ahlrichs, Chem. Phys. Lett., 1996, 256, 454 CrossRef CAS.
- M. J. Frisch, et al., Gaussian 09, Revision A.02, Gaussian Inc., Wallingford, CT, 2009 Search PubMed.
- Q. Chen, S. Y. Zhang, H. Bai, W. J. Tian, T. Gao, H. R. Li, C. Q. Miao, Y. W. Mu, H. G. Lu, H. J. Zhai and S. D. Li, Angew. Chem., Int. Ed., 2015, 54, 8160 CrossRef CAS PubMed.
- Y. Bai, X. Y. Zhao, T. W. Li, Z. L. Lv, S. J. Lv, H. Han, Y. F. Yin and H. Wang, Carbon, 2014, 78, 70 CrossRef CAS.
- D. Porezag and M. R. Pederson, Phys. Rev. B: Condens. Matter Mater. Phys., 1996, 54, 7830 CrossRef CAS.
Footnote |
| † Electronic supplementary information (ESI) available. See DOI: 10.1039/c7ra05932a |
|
| This journal is © The Royal Society of Chemistry 2017 |
Click here to see how this site uses Cookies. View our privacy policy here. 
 Open Access Article
 This Open Access Article is licensed under a Creative Commons Attribution-Non Commercial 3.0 Unported Licence
 *ab,
Zheng-Ping Zhang*b,
Zheng-Wen Longc and
Shui-Jie Qind
*ab,
Zheng-Ping Zhang*b,
Zheng-Wen Longc and
Shui-Jie Qind