 Open Access Article
Creative Commons Attribution 3.0 Unported Licence
Separation of main and satellite droplets in a deterministic lateral displacement microfluidic device†
Naotomo Tottori a,
Takeshi Hatsuzawab and
Takasi Nisisako
 *b
*b
aDepartment of Mechanical Engineering, School of Engineering, Tokyo Institute of Technology, Yokohama, Japan
bLaboratory for Future Interdisciplinary Research of Science and Technology (FIRST), Institute of Innovative Research, Tokyo Institute of Technology, Yokohama, Japan. E-mail: nisisako.t.aa@m.titech.ac.jp; Fax: +81-45-924-5092; Tel: +81-45-924-5092
First published on 18th July 2017
Abstract
A microfluidic droplet generator (MFDG) normally produces satellite droplets through break-off from the main droplet because of the Plateau–Rayleigh instability, resulting in contamination and/or poor size distribution of the products. Thus, we herein demonstrate the continuous, passive, and size-based separation of main and satellite droplets using the deterministic lateral displacement (DLD) array method. For the purpose of this study, we designed and employed microfluidic devices comprised of an upstream symmetric flow-focusing MFDG and a downstream DLD array composed of polydimethylsiloxane (PDMS). Initially, we produced water-in-oil (W/O) droplets containing main droplets of ∼61.1 μm diameter in addition to satellite droplets of 1–30 μm diameter in a hydrophobic MFDG, and we report the successful separation of the main and satellite droplets through a single-step DLD array with a critical diameter (Dc) of 37.1 μm. Furthermore, we demonstrated the generation and separation of single-phase or biphasic (i.e. Janus or core–shell) oil-in-water (O/W) main and satellite droplets using a hydrophilic MFDG and a DLD array. Finally, in addition to the removal of main and satellite W/O droplets, we also fractionated satellite droplets of different sizes into three groups (i.e., 21.4, 10.1, and 4.9 μm average diameter) using a device with three-step DLD arrays each having different Dc values (i.e., 37.1, 11.6, and 7.0 μm).
1. Introduction
Microfluidic droplet-generating technology is used in a growing number of applications such as droplet-based bioassays1–3 including digital polymerase chain reaction (PCR)4 and single-cell analysis,5,6 and functional microparticles production7–10 because it offers unprecedented fine control over size, structural and/or chemical compositions, and spatio-temporal arrangement of the produced droplets. To date, a number of studies have been conducted using a microfluidic droplet generator (MFDG) such as T-shaped and flow focusing microchannels on a chip or three-dimensional coaxial microcapillary configurations.11 MFDGs have hydrophobic or hydrophilic surface for generation of different types of droplets. Regardless of their geometrical and wetting-property differences, however, MFDGs tend to produce minute droplets (i.e., satellite droplets) simultaneously with the primary droplets. These satellite droplets, which are normally unwanted byproducts, tend to deteriorate the monodispersity of the primary droplets and are considered impurities in biochemical analyses. In contrast, the fractionation of polydisperse satellite droplets for the production of monodisperse droplets can be useful, since the generation of monodispersed submicron emulsions is difficult, due to the high energy required to produce such small droplets.Recently, various active and passive microfluidic techniques have been reported for droplet sorting and separation. For example, active droplet sorting techniques, which can be classified according to concepts such as acoustic, electric, magnetic, thermal, and pneumatic actuation, have been widely studied.12 In addition, several passive methods for the size-dependent separation of droplets have been reported, which employ asymmetric bifurcating junctions,13–18 pinched flow fractionation (PFF),19 hydrodynamic size fractionation,20 microfluidic gravity-driven systems,21 and split-flow thin (SPLITT) fractionation.22 Furthermore, a few groups have reported the possibility of size-dependent separation of the main and satellite droplets using microfluidic devices. For example, Hung et al. demonstrated the separation of main and satellite droplets using optically induced dielectrophoresis,23 which is an active separation method. In contrast, the use of passive separation techniques has also been reported, with Nisisako et al. reporting the separation of main and satellite droplets generated from a T-junction MFDG through a diffuser channel,18 while the similar separation of main and satellite droplets generated from a T-junction MFDG was also demonstrated to produce monodisperse chitosan or alginate microparticles.16,17 Moreover, Tan et al. investigated the separation of main and satellite droplets generated from a flow-focusing MFDG using an asymmetric bifurcating geometries14,24 or asymmetric relative positions of the droplets after their break off.24,25 However, these passive separation methods need satellite droplets flowing close to the side wall or asymmetric bifurcating geometries. In addition, fractionation of satellite droplets based on their sizes has never been reported.
As an example of a passive particle separation method in a microfluidic device, deterministic lateral displacement (DLD) has recently attracted growing attention,26,27 likely due to its ability to separate particles based on their size with a tolerance of <10 nm.28 This method utilizes a periodically-arranged micropillar array to produce a specific streamline pattern. Particles larger than a critical diameter Dc are displaced laterally at each row and follow a deterministic path through the pillar array (displacement mode), while particles smaller than a Dc follow the laminar flow stream lines through the pillar array (zigzag mode). As a result, particles of different sizes can be successfully separated. To date, the microfluidic DLD method has been used to separate cell-containing droplets from empty droplets based on size differences.29,30 Gravitational-force driven DLD separation of millimeter-sized droplets has also been reported recently.31 To the best of our knowledge, however, the separation of main and satellite droplets using a DLD microfluidic device has not yet been reported.
Thus, we herein present a novel DLD microfluidic device for preparing satellite-free main droplets and monodispersed satellite droplets. Our microfluidic device consists of two components on a polydimethylsiloxane (PDMS) chip, namely an MFDG and a DLD array. We therefore propose that in the upstream MFDG, the main and satellite droplets are generated prior to their fractionation in the downstream DLD region. We applied this process to the attempted separation of water-in-oil (W/O) main and satellite droplets through the DLD. In addition, a hydrophilic PDMS chip was employed for the separation of oil-in-water (O/W) and biphasic (i.e. Janus and core–shell)10 O/W main and satellite droplets. Finally, the three-step DLD system exhibiting three different Dc was used for filtration of the satellite droplets from the main droplets prior to simultaneous collection of the monodispersed satellite droplets.
2. Experimental
2.1 Design of the microfluidic devices
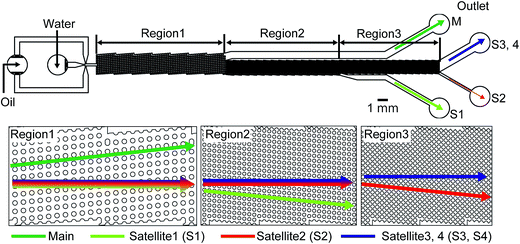
Three microfluidic devices were designed consisting of MFDG and DLD regions (i.e., device-1 (A, B), device-2, and device-3, see Fig. 1, 2, S1†). In these devices, the MFDG initially generates the W/O or O/W emulsion droplets comprised of the main and satellite droplets, which are located in the center of the drain channel. These droplets then enter the DLD region and are fractionated based on size using the DLD array. As shown in Fig. 1a, 2, S1† the three devices consist of the same cross-shaped MFDG design for producing the emulsion droplets in a flow-focusing regime. In all cases, channel widths of 100 μm were employed for the three input channels, in addition to a drain channel of 200 μm width, and a depth of 80 μm. In addition, the MFDG of device-2 has a Y-shaped channel for infusing two dispersed phases to produce biphasic droplets (Fig. S1†). Both device-1 and device-2 have a DLD region with a single Dc. Upon entering the DLD region from the center of the channel, the main droplets, which are larger than the Dc of the array, flow in displacement mode and migrate to the side wall in the downstream segment. In contrast, the satellite droplets, which are smaller than the Dc, move with the flow in a zigzag mode and are retained in the center. Thus, in device-1 and device-2, the main droplets are collected at outlet-M, whereas the satellite droplets are collected at outlet-S. In contrast, device-3 consists of an MFDG and three consecutive DLD regions each having different Dc values. Following separation of main droplets from the satellite droplets through region-1, the largest satellite droplets are separated from the smaller droplets in DLD region-2, and the second largest satellites are separated from further smaller droplets in region-3. Thus, in addition to separation of the main droplets from the satellite droplets, satellite droplets of different size are also fractionated in this continuous process.In this context, the Dc of the DLD array can be estimated according to eqn (1):26,27
| Dc = 1.4 × d × ε0.48 | (1) |
![[thin space (1/6-em)]](https://www.rsc.org/images/entities/char_2009.gif) ε. We determined these geometrical parameters based on droplet-formation experiments. More specifically, using an aqueous sodium alginate solution as the droplet phase and corn oil as the carrier phase, the mean diameters of the main and satellite droplets were 60–70 and ∼30 μm, respectively, when the flow rate of the droplet phase (Qd) and the carrier phase (Qc) were 0.05 and 3 mL h−1, respectively (Fig. 3).
ε. We determined these geometrical parameters based on droplet-formation experiments. More specifically, using an aqueous sodium alginate solution as the droplet phase and corn oil as the carrier phase, the mean diameters of the main and satellite droplets were 60–70 and ∼30 μm, respectively, when the flow rate of the droplet phase (Qd) and the carrier phase (Qc) were 0.05 and 3 mL h−1, respectively (Fig. 3).
The DLD array of device-1 and device-2 consist of micropillars having a diameter of 100 μm, ε of 0.1, and a gap of 80 μm, thus giving a Dc of 37.1 μm for separation of the main and satellite droplets. In addition, device-3 was designed to filter all satellite droplets from the main droplets and also for the separation of the differently-sized satellite droplets. As shown in Fig. 2, device-3 has three critical diameter segments. The DLD parameters of the first region are the same as those of device-1 and device-2, while the second region consists of micro pillars of 50 μm, ε of 0.1, and a 25 μm gap, thus giving a Dc of 11.6 μm. Furthermore, the gap parameter of the third region was 15 μm, which decreased the value of Dc to 7.0 μm.
2.2 Microfabrication
The microfluidic devices were prepared using a conventional soft lithographic technique.32 A Negative Photoresist SU8-3050 (Nippon Kayaku, Tokyo, Japan) was spin-coated at 1300 rpm for 30 s onto a silicon wafer to obtain a final layer thickness of 80 μm. After a prebake step at 95 °C over 40 min, the photoresist layer was exposed to UV light through a laser-printed polyethylene terephthalate (PET) photomask (thickness, 0.175 mm; resolution, 12![[thin space (1/6-em)]](https://www.rsc.org/images/entities/char_2009.gif) 700 dpi; Unno Giken, Tokyo, Japan) featuring the desired design. Subsequently, after a post-exposure bake at 95 °C for 15 min, the photoresist layer was developed to obtain the final positive replica of the design. The master molds were silanized using vaporized chlorotrimethylsilane (0.5 mL; Tokyo Chemical Industry, Tokyo, Japan) in a sealed disposable Petri dish to facilitate mold release. The polydimethylsiloxane (PDMS) prepolymer mixed with a curing agent (10
700 dpi; Unno Giken, Tokyo, Japan) featuring the desired design. Subsequently, after a post-exposure bake at 95 °C for 15 min, the photoresist layer was developed to obtain the final positive replica of the design. The master molds were silanized using vaporized chlorotrimethylsilane (0.5 mL; Tokyo Chemical Industry, Tokyo, Japan) in a sealed disposable Petri dish to facilitate mold release. The polydimethylsiloxane (PDMS) prepolymer mixed with a curing agent (10![[thin space (1/6-em)]](https://www.rsc.org/images/entities/char_2009.gif) :
:![[thin space (1/6-em)]](https://www.rsc.org/images/entities/char_2009.gif) 1 w/w ratio; Toray, Tokyo, Japan) was degassed, poured onto the SU-8 master mold, and cured at 80 °C on a hot plate for 1 h. Following removal of the cured PDMS replica from the mold, holes for inlets and outlets (diameter, 1.2 mm) were created using a punch (Harris Uni-Core, Ted Pella, CA, U.S.A.). The PDMS section was then irreversibly bonded to the planar substrate by oxygen plasma treatment (BP-1, Samco, Tokyo, Japan). To produce a hydrophilic device suitable for the separation of O/W droplets, we employed bare borosilicate glass slides (76 mm × 26 mm; thickness, 0.9–1.2 mm) as the substrate. In contrast, to produce a hydrophobic device suitable for the separation of W/O droplets, PDMS-coated borosilicate glass slides were used.
1 w/w ratio; Toray, Tokyo, Japan) was degassed, poured onto the SU-8 master mold, and cured at 80 °C on a hot plate for 1 h. Following removal of the cured PDMS replica from the mold, holes for inlets and outlets (diameter, 1.2 mm) were created using a punch (Harris Uni-Core, Ted Pella, CA, U.S.A.). The PDMS section was then irreversibly bonded to the planar substrate by oxygen plasma treatment (BP-1, Samco, Tokyo, Japan). To produce a hydrophilic device suitable for the separation of O/W droplets, we employed bare borosilicate glass slides (76 mm × 26 mm; thickness, 0.9–1.2 mm) as the substrate. In contrast, to produce a hydrophobic device suitable for the separation of W/O droplets, PDMS-coated borosilicate glass slides were used.
2.3 Surface modification
Following plasma treatment and assembly, the channel surfaces of both device-1B and device-2 were modified to render them hydrophilic using a layer-by-layer (LbL) surface coating protocol.33 Three solutions were prepared, namely a 0.1 M aqueous NaCl solution (NaCl, Wako Pure Chemicals, Tokyo, Japan), prepared using pure water, and 0.1% (w/v) poly(allylamine hydrochloride) (PAH, Mw 17![[thin space (1/6-em)]](https://www.rsc.org/images/entities/char_2009.gif) 500, Sigma-Aldrich, USA) and 0.1% (w/v) poly(sodium 4-styrenesulfonate) (PSS, Mw 70
500, Sigma-Aldrich, USA) and 0.1% (w/v) poly(sodium 4-styrenesulfonate) (PSS, Mw 70![[thin space (1/6-em)]](https://www.rsc.org/images/entities/char_2009.gif) 000, Sigma-Aldrich, USA) solutions, prepared by dissolving the raw materials in a 0.5 M aqueous NaCl solution. These prepared solutions were then introduced alternately into the device as segments of PAH and PSS solutions separated by aqueous NaCl washing solution segments. The residence times of the PAH and PSS solutions inside the microchannels were ∼30 min. This sequence of solution was introduced into the device three times, after which, a final washing step was performed using pure water to remove traces of salt from the channel wall.
000, Sigma-Aldrich, USA) solutions, prepared by dissolving the raw materials in a 0.5 M aqueous NaCl solution. These prepared solutions were then introduced alternately into the device as segments of PAH and PSS solutions separated by aqueous NaCl washing solution segments. The residence times of the PAH and PSS solutions inside the microchannels were ∼30 min. This sequence of solution was introduced into the device three times, after which, a final washing step was performed using pure water to remove traces of salt from the channel wall.
2.4 Materials
For the experiments for W/O droplets carried out using device-1A and device-3, the continuous phase consisted of corn oil (Wako Pure Chemicals, Tokyo, Japan) containing a surfactant (SY-Glyster CRS-75, Sakamoto Yakuhin Kogyo, Osaka, Japan, 1.0 wt%). For the dispersed phase, sodium alginate (Wako Pure Chemicals, Tokyo, Japan) was dissolved in pure water, to give a 1 wt% solution. For the experiments for O/W droplets carried out using device-1B, 1,6-hexanediol diacrylate (HDDA, dynamic viscosity ηm, 6.35 mPa s; density ρm, 1.02 g cm−3; Shin-Nakamura Kagaku, Tokyo, Japan) containing photoinitiator (Darocur 1173, BASF, Japan) at 3 wt% was used. In the device-2, silicone oil (SH200 10CS; Dow Corning Toray, Tokyo, Japan) was additionally used as the dispersed phases. In addition, an oil-soluble dye (Oil Red O, Sigma-Aldrich, MO, USA) was dissolved in the monomer to allow visual differentiation between the two organic phases. For the aqueous phase, either sodium dodecyl sulfate (SDS, Wako Pure Chemicals, Tokyo, Japan) or polyvinyl alcohol (PVA, Mw 300 g mol−1; degree of hydrolysis, 87–89%) was dissolved in pure water, to give a 0.3 or a 2.0 wt% solutions, respectively.2.5 Polymerization of particles
A UV light source (SUPERCURE-201S, SAN-EI ELECTRIC, Japan) was used for UV-induced polymerization. UV light from the light source was irradiated on the collected suspensions outside the microfluidic device at a distance of 10–15 cm to produce photocured particles. Both optical microscopy and scanning electron microscopy (SEM, JSM-6610LA, JEOL, Japan) were used for characterization.2.6 General equipment and procedures
Gastight glass syringes (1000 Series; Hamilton Company, Reno, NV, USA) filled with the desired liquids were linked to the PDMS microfluidic chip through polyethylene tubes (outer diameter, 1 mm; inner diameter, 0.5 mm). These liquids were infused into the microchannels using syringe pumps (KDS200, KD Scientific, USA), while images displaying droplet formation and the droplet trajectory in the DLD array were monitored and captured using an inverted optical microscope (CKX41, Olympus, Tokyo, Japan) equipped with a high-speed video camera (Fastcam Mini WX100 or Fastcam Mini AX50, Photron, Tokyo, Japan). Droplet sizes were measured manually by using ImageJ (NIH, NY, USA) software.3. Results and discussion
3.1 Measurement of droplet sizes for determination of the DLD geometrical parameters
We initially measured the sizes of the main and satellite droplets formed using an MFDG without DLD (Fig. S2†) to determine the geometrical parameters of the DLD array that affect the critical diameter Dc. Fig. 3a shows a snap-shot image taken by the high-speed camera, in which the main and satellite droplets can be seen immediately following their breakup. The flow rates of the continuous phase (Qc) and the dispersed phase (Qd) were 3.0 and 0.05 mL h−1, respectively, and a break-up rate of ∼110 drops per s was observed. In addition to the primary droplet, a series of satellite droplets formed from a thin liquid thread due to Rayleigh instability (Fig. 3a inset). Furthermore, Fig. 3b shows the size distributions of the main and satellite droplets in an MFDG, where the measured mean diameters ± standard deviation (s.d.) of the main droplets were 59.5 ± 2.0 μm with a coefficient variation (CV) of 3.4%. In contrast, the satellite droplets were classified according to their droplet size, namely, primary (S1, 24.0 ± 1.0 μm), secondary (S2, 13.8 ± 0.9 μm), tertiary (S3, 7.9 ± 0.6 μm), and quaternary (S4, 3.4 ± 1.1 μm).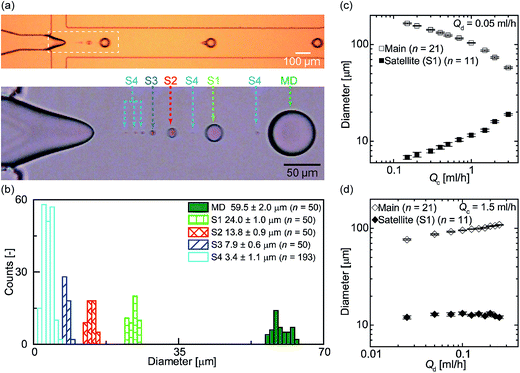 | ||
Fig. 3 Formation of the main and satellite droplets. (a) A snapshot showing the formation of water-in-oil (W/O) main and satellite droplets in an MFDG flow-focusing device without a DLD region (see Fig. S2†). The continuous (Qc) and disperse (Qd) flow rates were 3.0 and 0.05 mL h−1, respectively. The breakup rate of the main droplets was ∼110 drops per s. The dashed rectangle represents the magnified view of droplet formation, recorded at 20![[thin space (1/6-em)]](https://www.rsc.org/images/entities/char_2009.gif) 000 fps. Satellite droplets were classified into four groups based on their sizes (i.e., S1–S4). (b) Size distributions of the main and satellite droplets. (c) Effect of Qc on the diameters of the main and the largest satellite droplets (S1) at a fixed Qd value of 0.05 mL h−1. (d) Effect of Qd on the diameters of the main and satellite droplets at a fixed Qc value of 1.5 mL h−1. 000 fps. Satellite droplets were classified into four groups based on their sizes (i.e., S1–S4). (b) Size distributions of the main and satellite droplets. (c) Effect of Qc on the diameters of the main and the largest satellite droplets (S1) at a fixed Qd value of 0.05 mL h−1. (d) Effect of Qd on the diameters of the main and satellite droplets at a fixed Qc value of 1.5 mL h−1. | ||
As main droplets of uniform sizes are known to form when the flow conditions fall within a mountain-shaped region of a Qc–Qd phase diagram,34 we prepared a phase diagram illustrating this mountain-shaped region for uniform droplet formation in addition to other regions for different flow regimes (Fig. S3†) by varying the flow conditions. Indeed, within this mountain-shaped region, we controlled Qc and Qd to produce variation in droplet size. When Qd was fixed at 0.05 mL h−1 and Qc was varied between 0.15 and 3.0 mL h−1, the main and satellite droplet diameters were 57–164 and 7–19 μm, respectively (Fig. 3c). In contrast, when Qc was fixed at 1.5 mL h−1 and Qd was varied between 0.025 and 0.25 mL h−1, the main and satellite droplet diameters were 76–109 and 12–13 μm, respectively (Fig. 3d).
Based on the measured droplet sizes, we determined the geometrical parameters of the DLD arrays, as outlined in Table 1. The Dc values of device-1 and device-2 were set between the diameters of the main droplet and the satellite droplets, while those of device-3 were set between each droplet diameter when the Qc and Qd values were 3.0 and 0.05 mL h−1, respectively.
| Region | Dp (μm) | Δλ/λ (−) | d (μm) | Dc (μm) | Surface property | |
|---|---|---|---|---|---|---|
| Device-1A | — | 100 | 0.1 | 80 | 37.1 | Hydrophobic |
| Device-1B | — | 100 | 0.1 | 80 | 37.1 | Hydrophilic |
| Device-2 | — | 100 | 0.1 | 80 | 37.1 | Hydrophilic |
| Device-3 | 1st | 100 | 0.1 | 80 | 37.1 | Hydrophobic |
| 2nd | 50 | 0.1 | 25 | 11.6 | ||
| 3rd | 50 | 0.1 | 15 | 7.0 |
3.2 Separation of the main droplets from the satellite droplets
We then performed separation of the main and satellite W/O droplets using the device with a single DLD region (i.e., device-1A). Initially, we confirmed that the sizes of the main and satellite droplets immediately after their formation at the MFDG were similar to those shown in Fig. 3 under equal flow rates (Fig. S4†). We found that the main and satellite droplets maintained their positions on the centerline of the drainage channel and entered the DLD region at flow rates of Qd = 0.05 mL h−1 and Qc = 3.0 mL h−1. In the DLD region, we observed that the main droplets moved with a predetermined migration angle (5.71°) along the DLD array in displacement mode toward the sidewall, and were collected at outlet-M. In contrast, the satellite droplets followed a streamline path through the DLD array in zigzag mode and were collected at outlet-S (Fig. 4). Furthermore, we observed slight deformation of main droplets due to the increased shear between the posts. Although this deformation may slightly decrease the effective size of the main droplets for DLD separation, the droplet sizes remained greater than the Dc of the DLD array, resulting in displacement of the main droplets. No droplet fission caused by shear stress was observed in the DLD array.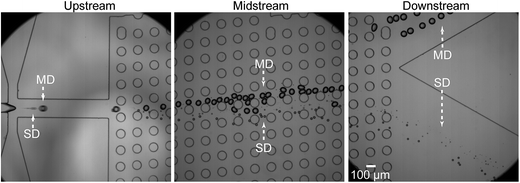 | ||
| Fig. 4 Separation of the W/O main droplets from satellite droplets through a single-step DLD array. Qc = 3.0 mL h−1 and Qd = 0.05 mL h−1. | ||
Fig. 5 shows the main and satellite droplets collected at two separate outlets. At outlet-M, droplets with diameters in the range of 54–67 μm (mean diameter, 60.9 μm, CV = 4.8%) were observed, with smaller droplets not being observed (Fig. 5a). As indicated in Fig. 3b, the sizes of the observed droplets corresponded to the main droplets. In contrast, at outlet-S, droplets that could be classified into at least three different sizes were observed (Fig. 5b). More specifically, the means and standard deviations of the three peaks present in Fig. 5b were 23.0 ± 0.8, 12.4 ± 0.7, and 6.6 ± 1.3 μm, which correspond to primary, secondary, and tertiary/quaternary satellite droplets, respectively (see Fig. 3b). These results therefore confirmed the successful separation of the main droplets from the satellite droplets with 100% purity and recovery.
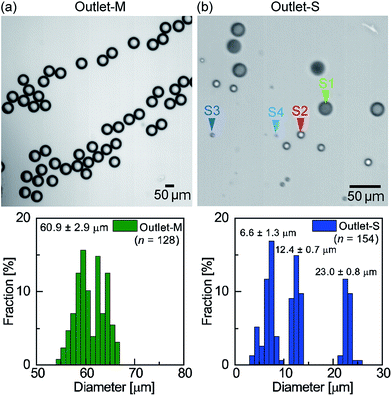 | ||
| Fig. 5 Separated and collected droplets. (a) The droplets collected at outlet-M and their size distributions. (b) The droplets collected at outlet-S and their size distributions. | ||
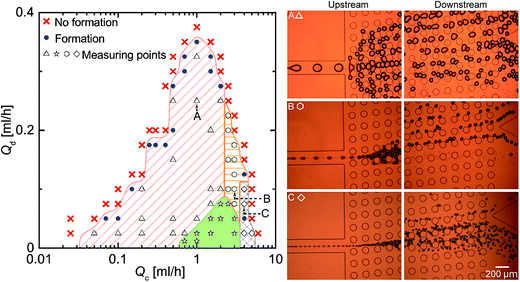
Moreover, Fig. 6 shows a Qc–Qd diagram illustrating where the main and satellite droplets can be separated through the DLD array; the green area with star symbols is the area where the main and satellite droplets can be separated completely. On the other hand, the inseparable area can be classified into three different sets of conditions. For example, the red shaded area represents the conditions under which the main droplets were split by the DLD pillars due to the droplets being larger than the gap (Fig. 6 inset A). In this context, two possible manners of expanding the separable area by preventing splitting of the main droplets can be envisaged. Firstly, the gap parameter can be increased through decreasing the angle of the DLD array according to eqn (1) while maintaining the critical diameter of the DLD array (Fig. S5†), and secondly, the height of the DLD array can be increased without significantly affecting Dc, thus resulting in the main droplets with diameters larger than the height of the channel becoming smaller than gap, thus preventing splitting. In addition, the orange shaded area in Fig. 6 represents the conditions under which main droplets with diameters larger than Dc are not collected at outlet-M due to overflowing of the main droplets by non-deterministic droplets collisions35 at the upstream DLD array (Fig. 6 inset B), which is caused by high flow-rate ratios of Qd/Qc and a sudden decrease in the flow velocity of the DLD region. This issue could be addressed either by employing a longer DLD array to ensure displacement of all main droplets toward the side wall and separation at outlet-M, or by infusing additional continuous phase buffer solution into the DLD array through a sheath flow focusing configuration, which should result in separation of the main droplets due to a lack of droplet overflow at the upstream DLD array. Furthermore, the blue grid area represents the conditions under which the diameters of the main droplets (e.g., mean diameter, 25.1 ± 0.9 μm; Qc, 4 mL h−1; Qd, 0.075 mL h−1) are smaller than the critical diameter (Dc, 37.1 μm, Fig. 6 inset C). In this area, both main and satellite droplets can flow in zigzag mode and cannot be separated.
Our device is not limited to the separation of W/O emulsion droplets. For example, we prepared a hydrophilic device for the formation and separation of O/W main and satellite droplets. Through the use of a photocurable acrylate monomer as the dispersed phase and a polyvinyl alcohol aqueous solution as the continuous phase, the O/W droplets were successfully generated (Fig. S6†), and the separation of main droplets of diameter 59.0 μm from smaller satellite droplets of 3–25 μm diameter was achieved through the DLD array (Fig. S7† and 7a). The collected droplets were then solidified by UV-initiated photopolymerization to give monodisperse polymer particles of 57.6 μm diameter with a CV of 5.0% from the main droplets, and polydisperse smaller particles from the satellite droplets (Fig. 7b and c). Furthermore, through the incorporation of a Janus droplet generator as the MFDG (Fig. S1†), we demonstrated the separation of main and satellite biphasic O/W droplets. Upon employing the acrylate monomer and 10 CS silicone oil as the two mutually immiscible dispersed phases, biphasic droplets with a Janus34 or core–shell36 geometry were produced, and the main and satellite droplets were successfully separated along the DLD array (Fig. S8–S10† and 7d).
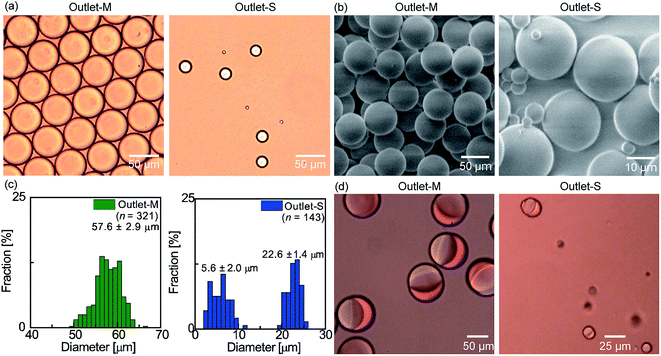 | ||
| Fig. 7 Separation of the oil-in-water (O/W) main and satellite droplets in a hydrophilic DLD device. (a) Bright-field optical microscopy images of the separated photopolymerizable monomer droplets. (b) SEM images of the polymer microparticles prepared by photopolymerization of the droplets in (a). (c) Size distributions of the particles. (d) Photomicrographs of the separated and collected biphasic Janus droplets in a DLD device with a biphasic droplet generator (see Fig. S1†). | ||
3.3 Effect of droplet-generating geometry on separation
We also investigated the effect of the initial droplet position in the drainage channel of MFDG on droplet separation in the DLD region. Initially, using the flow-focusing channel of the single DLD device as a double T-junction MFDG, we tested the separation of main and satellite W/O droplets. This experiment was performed by inverting the oil and water phases of device-1A. In the double T-junction MFDG, the main and satellite droplets are produced close to the side walls and they are not aligned exactly in the center of the channel geometry prior to entering the DLD array. This offset prevents these droplets from entering the DLD array in the center because the streamlines expand as shown in Fig. S11.† We also found that the inflow positions of the main droplets are closer to the center of the DLD array than the satellite droplets (Fig. S12a†). In addition, in the DLD array, the main droplets moved with a predetermined migration angle (5.71°) along the DLD array in displacement mode toward the side wall, while the satellite droplets flowed through the DLD array in zigzag mode, and maintained their position close to the side wall (Fig. S12b†). These results therefore confirm that the main and satellite droplets cannot be separated using the DLD device with a T-junction MFDG.We then examined the separation of main and satellite droplets using the device with a narrow drainage channel (i.e., 100 μm) (Fig. S13a†). When the Qd and Qc values are set as 0.05 and 1.0 mL h−1, respectively, main droplets with a diameter of 61.3 μm were generated. Following generation of the main and satellite droplets in the center of the drainage channel, the main droplets maintained their positions on the centerline of the drainage channel, while the satellite droplets moved toward the side wall prior to entering the DLD region from different positions (Fig. S13b†). This satellite motion in the drainage channel may be due to the convective flow between the main droplets. After passing through the DLD array, we observed that separation of the main and satellite droplets did not occur (Fig. S13c†), thus indicating that the successful separation of main and satellite droplets using this system requires the satellite droplets to be in the center of the drainage channel.
3.4 Multi-step fractionation of main and satellite droplets of different sizes
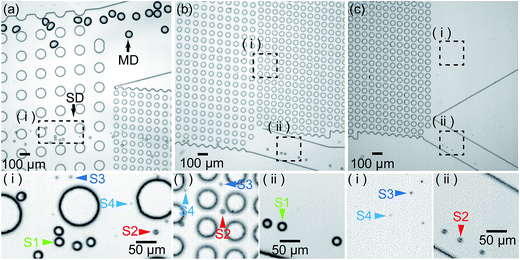
We subsequently performed separation experiments using device-3, i.e., the three-step DLD device (Fig. 2), and Fig. S14a† shows the formation of main and satellite droplets in an MFDG at a break-off frequency of 70 Hz, where the flow rates of the continuous and dispersed phases were 3.0 and 0.05 mL h−1, respectively. The main droplets measured 71.5 ± 1.6 μm with a CV of 2.2%, while the primary, secondary, tertiary, and quaternary satellite droplets measured 22.5 ± 0.4, 11.4 ± 0.4, 6.3 ± 0.3, and 3.0 ± 0.9 μm, respectively (Fig. S14b†).Fig. 8 shows the main and satellite droplets flowing through the DLD array. In DLD region-1 (Dc, 37.1 μm), the main droplets moved with a predetermined migration angle (5.71°) along the DLD array toward the side wall and were collected at outlet-M, while the satellite droplets followed a streamline path and flowed through the DLD array to enter DLD region-2 (Fig. 8a). Subsequently, in DLD region-2 (Dc, 11.6 μm), the primary satellite droplets moved with a slight angle (5.71°) along the DLD array, and were collected at outlet-S1, while the secondary and subsequent satellite droplets travelled straight along the fluid stream (Fig. 8b). Later, in DLD region-3 (Dc, 7.0 μm), the secondary satellite droplets moved with a slight angle (5.71°) along the DLD array and were collected at outlet-S2, while the tertiary and subsequent satellite droplets migrated in the zigzag mode and were collected at outlet-S3,4 (Fig. 8c). In each DLD region, the main and satellite droplets trajectories correspond with the trajectories (displacement mode or zigzag mode) given by the critical diameter calculated using eqn (1).
Finally, Fig. 9 shows the results obtained following separation of the main droplets and the differently sized satellite populations. At outlet-M, the mean diameter of collected droplets was 72.6 ± 2.4 μm with a CV of 3.3% (Fig. 9a), which corresponds to the main droplets measured at the MFDG (Fig. S14b†). These results indicate that the capture efficiency and purity of the main droplet at outlet-M was 100%. In contrast, at outlets-S1, outlet-S2, and outlet-S3,4, the collected droplets measured 21.4 ± 0.6, 10.1 ± 0.5, and 4.9 ± 0.9 μm, respectively (Fig. 9b–d). Based on the size distributions of the droplets in the MFDG, these droplet diameters were assumed to correlate to the primary, secondary, and tertiary/quaternary populations, respectively, indicating that primary and secondary satellite droplets are fractionated from the smaller satellite droplets with 100% purity and capture efficiency. As such, we concluded that fractionation of the main droplets and the different satellite droplet populations was successful using our developed system.
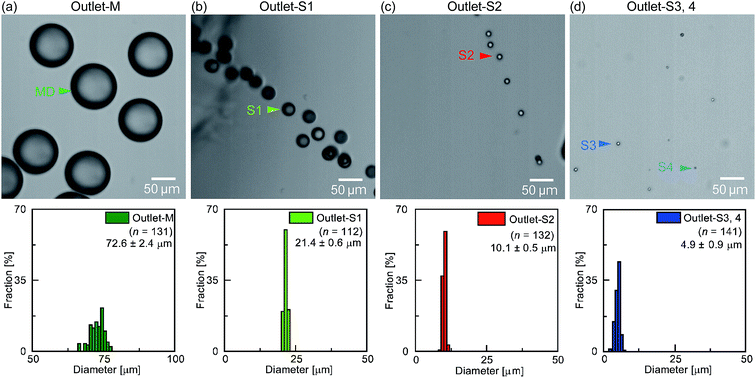 | ||
| Fig. 9 Photographic images and size distributions of the droplets collected at each of the four outlets of the three-step separation device. | ||
4. Conclusion
We herein reported the generation of satellite-free main droplets and monodispersed satellite droplets in both water-in-oil and oil-in-water systems using a deterministic lateral displacement (DLD) array. This was achieved through the design and preparation of a microfluidic device, in which a microfluidic droplet generator and a DLD region are coupled in series on a chip. Indeed, we successfully demonstrated the separation of main and satellite droplets, in addition to the separation of primary, secondary, and tertiary/quaternary satellite droplets continuously with 100% purity and recovery efficiency, indicating that small monodispersed droplets were generated simultaneously using a relatively large microchannel in comparison to the droplet size. In addition, we present the separation of biphasic (i.e., Janus and core shell) main droplets and satellite droplets, again with 100% purity and recovery efficiency. We therefore believe that this method is useful for the production of monodispersed droplets of different sizes without the requirement for any external sources or filtration process outside the channel. As such, our system demonstrates clear potential for use in industrial production and chemical/biochemical analyses.Conflicts of interest
There are no conflicts of interest to declare.Acknowledgements
This work was supported by JSPS KAKENHI Grant Number 16K04916 and 17J10441.References
- A. K. Price and B. M. Paegel, Anal. Chem., 2016, 88, 339–353 CrossRef CAS PubMed.
- N. Shembekar, C. Chaipan, R. Utharala and C. A. Merten, Lab Chip, 2016, 16, 1314–1331 RSC.
- T. S. Kaminski, O. Scheler and P. Garstecki, Lab Chip, 2016, 16, 2168–2187 RSC.
- Y.-Q. Fan, M. Wang, F. Gao, J. Zhuang, G. Tang and Y.-J. Zhang, Chin. J. Anal. Chem., 2016, 44, 1300–1307 CAS.
- A. Rakszewska, J. Tel, V. Chokkalingam and W. T. Huck, NPG Asia Mater., 2014, 6, e133 CrossRef CAS.
- D. J. Collins, A. Neild, A. deMello, A.-Q. Liu and Y. Ai, Lab Chip, 2015, 3439–3459 RSC.
- D. Dendukuri and P. S. Doyle, Adv. Mater., 2009, 21, 4071–4086 CrossRef CAS.
- J. H. Kim, T. Y. Jeon, T. M. Choi, T. S. Shim, S. H. Kim and S. M. Yang, Langmuir, 2014, 30, 1473–1488 CrossRef CAS PubMed.
- K. D. Seo, D. S. Kim and S. Sánchez, Lab Chip, 2015, 15, 3622–3626 RSC.
- T. Nisisako, Curr. Opin. Colloid Interface Sci., 2016, 25, 1–12 CrossRef CAS.
- S.-Y. Teh, R. Lin, L.-H. Hung and A. P. Lee, Lab Chip, 2008, 8, 198–220 RSC.
- H. Xi, H. Zheng, W. Guo, A. M. Gañán-Calvo, Y. Ai, C.-W. Tsao, J. Zhou, W. Li, Y. Huang, N.-T. Nguyen and S. H. Tan, Lab Chip, 2017, 17, 751–771 RSC.
- Y.-C. Tan, Y. L. Ho and A. P. Lee, Microfluid. Nanofluid., 2008, 4, 343–348 CrossRef CAS.
- Y.-C. Tan, J. S. Fisher, A. I. Lee, V. Cristini and A. P. Lee, Lab Chip, 2004, 4, 292–298 RSC.
- M. Chabert and J.-L. Viovy, Proc. Natl. Acad. Sci. U. S. A., 2008, 105, 3191–3196 CrossRef CAS PubMed.
- C.-H. Yang, Y.-S. Lin, K.-S. Huang, Y.-C. Huang, E.-C. Wang, J.-Y. Jhong and C.-Y. Kuo, Lab Chip, 2009, 9, 145–150 RSC.
- K.-S. Huang, Y.-S. Lin, C.-H. Yang, C.-W. Tsai and M.-Y. Hsu, Soft Matter, 2011, 7, 6713–6718 RSC.
- T. Nisisako, T. Torii and T. Higuchi, Proc. Micro Total Anal. Syst., 2004, vol. 2, pp. 312–314 Search PubMed.
- H. Maenaka, M. Yamada, M. Yasuda and M. Seki, Langmuir, 2008, 24, 4405–4410 CrossRef CAS PubMed.
- L. Mazutis and A. D. Griffiths, Appl. Phys. Lett., 2009, 95, 204103 Search PubMed.
- D. Huh, J. H. Bahng, Y. Ling, H.-H. Wei, O. D. Kripfgans, J. B. Fowlkes, J. B. Grotberg and S. Takayama, Anal. Chem., 2007, 79, 1369–1376 CrossRef CAS PubMed.
- C. B. Fuh and J. C. Giddings, J. Microcolumn Sep., 1997, 9, 205–211 CrossRef CAS.
- S.-H. Hung, Y.-H. Lin and G.-B. Lee, J. Micromech. Microeng., 2010, 20, 45026 CrossRef.
- Y.-C. Tan and A. P. Lee, Lab Chip, 2005, 5, 1178–1183 RSC.
- Y.-C. Tan, V. Cristini and A. P. Lee, Sens. Actuators, B, 2006, 114, 350–356 CrossRef CAS.
- N. Tottori, T. Nisisako, J. Park, Y. Yanagida and T. Hatsuzawa, Biomicrofluidics, 2016, 10, 14125 CrossRef.
- J. McGrath, M. Jimenez and H. Bridle, Lab Chip, 2014, 14, 4139–4158 RSC.
- L. R. Huang, E. C. Cox, R. H. Austin and J. C. Sturm, Science, 2004, 304, 987–990 CrossRef CAS PubMed.
- H. N. Joensson, M. Uhlén and H. A. Svahn, Lab Chip, 2011, 11, 1305–1310 RSC.
- T. Jing, R. Ramji, M. E. Warkiani, J. Han, C. T. Lim and C. H. Chen, Biosens. Bioelectron., 2015, 66, 19–23 CrossRef CAS PubMed.
- T. Bowman, J. Frechette and G. Drazer, Lab Chip, 2012, 12, 2903–2908 RSC.
- D. C. Duffy, J. C. McDonald, O. J. A. Schueller and G. M. Whitesides, Anal. Chem., 1998, 70, 4974–4984 CrossRef CAS PubMed.
- W.-A. C. Bauer, M. Fischlechner, C. Abell and W. T. S. Huck, Lab Chip, 2010, 10, 1814–1819 RSC.
- T. Nisisako and T. Torii, Adv. Mater., 2007, 19, 1489–1493 CrossRef CAS.
- R. Vernekar and T. Krüger, Med. Eng. Phys., 2015, 37, 845–854 CrossRef CAS PubMed.
- T. Nisisako and T. Hatsuzawa, Sens. Actuators, B, 2016, 223, 209–216 CrossRef CAS.
Footnote |
| † Electronic supplementary information (ESI) available. See DOI: 10.1039/c7ra05852g |
| This journal is © The Royal Society of Chemistry 2017 |


