 Open Access Article
Upconversion luminescence and temperature-sensing properties of Ho3+/Yb3+-codoped ZnWO4 phosphors based on fluorescence intensity ratios
Xiaona Chai ,
Jun Li,
Xusheng Wang*,
Yanxia Li and
Xi Yao
Key Laboratory of Advanced Civil Engineering Materials of the Ministry of Education, Functional Materials Research Laboratory, School of Materials Science and Engineering, Tongji University, 4800 Cao'an Road, Shanghai 201804, China. E-mail: xs-wang@tongji.edu.cn
First published on 16th August 2017
Abstract
Ho3+/Yb3+-codoped ZnWO4 phosphors were synthesized using a solid state reaction method and their structures, upconversion (UC) luminescence, and temperature-sensing properties were investigated. The obtained ZnWO4:0.01Ho3+/xYb3+ phosphors crystallized in the monoclinic phase with space group P2/c. Under 980 nm excitation, bright green [(5F4, 5S2) → 5I8], weak red (5F5 → 5I8), and near-infrared emissions [(5F4, 5S2) → 5I7] were observed. The optimal Ho3+ and Yb3+ doping concentrations in ZnWO4 were 0.01 and 0.15, respectively. The near-infrared-green (I757/I540) and red-green (I641,665/I540,549) fluorescence intensity ratios (FIRs) were studied as a function of temperature at 83–503 K. The sensitivity of the ZnWO4:0.01Ho3+/0.15Yb3+ phosphors was also discussed and their potential application as thermal sensors in luminescence thermometry was analyzed using a four-level system and the intensity ratio of the red and green emissions. ZnWO4:0.01Ho3+/0.15Yb3+ phosphors could potentially be applied as optical temperature-sensing materials.
1. Introduction
Noncontact temperature measurement has recently attracted much interest for its ability to measure high temperatures and characterize moving surfaces, even in the presence of strong electromagnetic fields, without interference.1 Rare earth elements exhibit narrow emission and absorption lines, and relatively long emission lifetimes. Therefore, rare-earth-doped materials have been applied in temperature sensors using luminescent thermometry techniques. Among rare earths, Ho3+ has been verified as a promising candidate in addition to Er3+. The thermally coupled levels of Ho3+ ions, namely 5F4 and 5S2, 5F3 and 3K8, and 5F2,3/3K8 and 5G6/5F1, have been investigated in temperature sensing.2–9 Yb3+ ions coupled to Ho3+ are usually used as sensitizers due to their larger absorption cross-section in the near-infrared region and the efficient energy transfer from Yb3+ to Ho3+.Compared with conventional contact temperature measurement methods, the noncontact fluorescence intensity ratio (FIR) technique is considered a promising approach to temperature sensing because it can reduce the dependence on measurement conditions and improve accuracy.10–12 Therefore, noncontact optical sensors based on FIR thermometry are particularly suitable for monitoring temperature under harsh conditions, such as electrical, magnetic, and electromagnetic fields, and flammable situations. In general, the FIR method can be used for temperature measurement if the FIR varies monotonically with temperature in rare-earth-doped materials.
Tungstates with monoclinic structures, which possess high chemical and physical stability and superior intrinsic luminescent properties, are considered good luminescent hosts. Among them, ZnWO4 has shown good properties as a scintillator crystal,13 while phosphors, such as ZnWO4 materials doped with rare earth ions (Er, Dy, Ho, Eu), showed excellent fluorescence properties.14–20 Furthermore, ZnWO4 has other advantages that benefit upconversion (UC), such as a low phonon threshold energy (199.5 cm−1).21,22 Therefore, ZnWO4 is a potential luminescent material. However, the upconversion luminescence and temperature-sensing capabilities of Ho3+ ion-doped ZnWO4 systems have not been studied.
In this context, ZnWO4:0.01Ho3+/xYb3+ phosphors were prepared using a typical solid-state reaction method and their room-temperature UC emission properties and energy transfer (ET) mechanism were analyzed. The near-infrared-green FIR (I757/I540) and red-green FIR (I641,665/I540,549) were studied as a function of temperature from 83 K to 503 K. For the near-infrared-green FIR (I757/I540), the four-level FIR system was used to analyze the optical temperature sensing of ZnWO4:0.01Ho3+/xYb3+ phosphors, while for the red-green FIR (I665,641/I540,549), we explored using the intensity ratio of red and green emissions generated from linked electronic states, which provided a new route for temperature measurement.
2. Experimental
Ho3+/Yb3+ codoped ZnWO4 phosphors (ZnWO4:0.01Ho3+/xYb3+) were synthesized using a conventional solid state reaction method. The Ho3+ ion concentration was fixed at 1 mol%, while the Yb3+ concentration was varied (x = 0.01, 0.02, 0.04, 0.06, 0.08, 0.10, 0.15, 0.20). High-purity ZnO, WO3, Er2O3, and Ho2O3 powders were weighed and ground thoroughly for 2 h using an agate mortar. The mixed powders were then calcined at 750 °C for 5 h. The calcined powders were reground for 1 h, an mixed thoroughly with PVA binder solution (10 wt%), and then pressed into pellets (diameter, 10 mm; thickness, approx. 2 mm). Finally, the samples were sintered at 1100 °C for 4 h in an alumina crucible in air. To ensure the luminescence measurements were accurate, the sintered pellets were ground to the same thickness.The basic crystal structures of ZnWO4:0.01Ho3+/xYb3+ phosphors were examined using X-ray diffraction (XRD; D/MAX 2550, Rigaku, Japan) with Cu Kα radiation at room temperature. Sample XRD profiles were collected in the 2θ range of 10–90° with a scanning speed of 5° min−1. UC photoluminescence emission spectra were measured using a fluorescence spectrofluorometer (F-7000, Hitachi, Japan) under excitation by a 980 nm diode laser. The phosphor temperatures were controlled in the range 83–583 K using a TP94 temperature controller (Linkam Scientific Instruments Ltd, Surrey, UK).
3. Results and discussion
3.1 XRD analysis
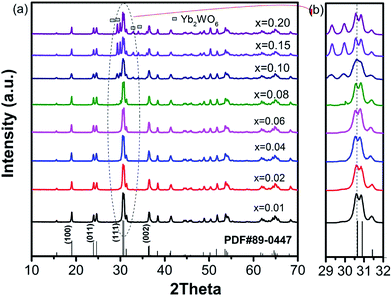
The XRD patterns of the ZnWO4:0.01Ho3+/xYb3+ samples are shown in Fig. 1(a). The main peaks were easily matched and indexed based on the standard diffraction data for ZnWO4 with a monoclinic structure (PDF#89-0447). This observation indicated that, as desired, the Ho3+/Yb3+ ions may have diffused into the A site of the ZnWO4 host structure. Codoping with 1 mol% Ho3+ and 1 mol% Yb3+ did not change the crystal structure of the material. With increasing Yb3+ concentration (x ≤ 0.08), the samples still showed a single-phase monoclinic structure. However, a second phase of Yb2WO6 was observed when the Yb3+ concentration exceeded 8 mol%. These results indicated that the solid solubility limit of Yb3+ ions in ZnWO4:0.01Ho3+ materials was 8 mol%. Furthermore, sample diffraction peaks near the (111) peaks gradually shifted to lower angles with increasing Yb3+ doping concentration (Fig. 1(b)). These shifts were clearly attributed to differences among the ionic radii of Ho3+/Yb3+ (CN = 6, 0.901 Å and 0.868 Å),23 Zn2+ (CN = 6, 0.74 Å),24 and W6+ (CN = 6, 0.60 Å),24 resulting in an increase in unit cell volume and diffraction peak shift.3.2 Upconversion luminescence properties
Under excitation with a 980 nm near-infrared laser, all Ho3+/Yb3+-codoped ZnWO4 phosphors exhibited strong green UC emissions at room temperature (Fig. 2). The emission bands at around 520–580 nm, 630–680 nm, and 735–775 nm were assigned to (5F4, 5S2) → 5I8, 5F5 → 5I8, and (5F4, 5S2) → 5I7 transitions, respectively. All emission bands were in good agreement with previous reports on other Ho3+-doped materials.7,25–27 Among the three emission bands, the green emission originating from the (5F4, 5S2) → 5I8 transition was the strongest, resulting in a strong green emission observed in Ho3+/Yb3+-codoped ZnWO4 phosphors. As shown in Fig. 2, when the concentration of Ho3+ was fixed at 1 mol%, the UC emission intensity increased gradually with increasing Yb3+ concentration, reaching a maximum value when the Yb3+ concentration (x = 0.15) was 15 times that of Ho3+. The emission intensity decreased if the Yb3+ concentration exceeded this critical value (x = 0.15). Yb3+ ion is known as a highly efficient sensitizer of Ho3+ ions due to its larger near-infrared absorption cross-section. The Yb3+ to Ho3+ energy transfer (ET) process was enhanced by increasing the Yb3+ concentration from 0.01 to 0.15, yielding a higher UC emission intensity. However, the distance between neighboring Yb3+ ions became shorter with increasing Yb3+ concentration. This resulted in stronger interactions between neighboring Yb3+ ions, which led to concentration-dependent quenching.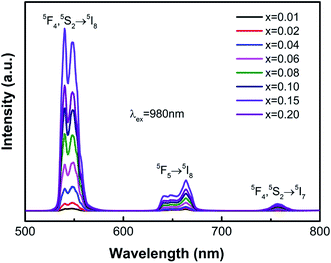 | ||
| Fig. 2 Upconversion emission (λex = 980 nm) spectra of ZnWO4:0.01Ho3+/xYb3+ phosphors at room temperature. | ||
Fig. 3 shows the schematic energy level diagram of Ho3+ and Yb3+ ions. Under 980 nm laser excitation, Yb3+ ions absorbed an infrared photon (980 nm), transited from ground state 2F7/2 (GSA) to excited state 2F5/2, and then transferred the energy to Ho3+ ions, populating the 5I6 state of Ho3+ ions. Subsequently, Ho3+ ions excited to 5I6 might be further excited to the (5F4, 5S2) coupling state by ET (5I6 + 2F5/2 → 5F4, 5S2 + 2F7/2) or excited state absorption (ESA; 5I6 + hν → 5F4, 5S2). The transition from (5F4, 5S2) to 5I8 states produced a strong green emission. However, the red emission was attributed to the transition from 5F5 to 5I8. Three processes might contribute to populating the 5F5 state. The first involved the intermediary level 5I6 of Ho3+ relaxing to 5I7 by nonradiative transition and then populating the 5F5 state by absorbing another photon via ESA. The second involved a nonradiative relaxation process from the 5F4, 5S2 state to the 5F5 state. The last process involved cross-relaxation between two Ho3+ ions (5F4, 5S2 + 5I7 → 5F5 + 5I6). At lower Ho3+ ion concentrations, the third process had a low probability in the UC process. Therefore, the first two processes were dominant in populating the 5F5 level. The near-infrared UC luminescence emission was due to 5F4, 5S2 → 5I7 transitions.
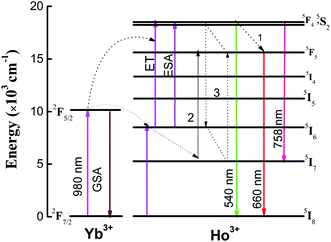 | ||
| Fig. 3 Energy level schematic diagram of Ho3+ and Yb3+ ions, and the proposed upconversion luminescence mechanism in ZnWO4. | ||
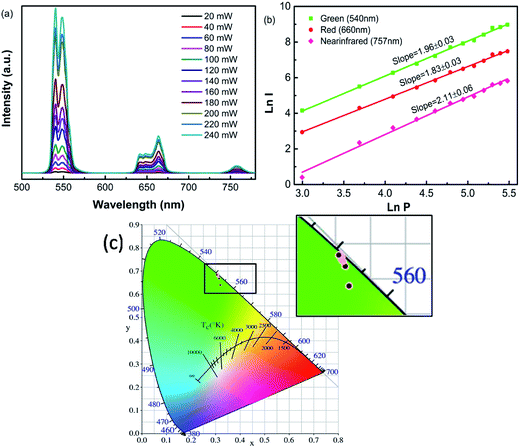
To better understand the UC emission process of Ho3+/Yb3+-codoped ZnWO4 phosphors, the dependence of the UC emission spectra of ZnWO4:0.01Ho3+/0.15Yb3+ ceramic on pump power was examined, as shown in Fig. 4(a). The peak values of all peaks increased gradually with increasing power in the range 80–240 mW. For the UC process, the emission band intensity (I) was proportional to the exponent (n) of pump power (P), with their relationship described by the formula,  ,28,29 where n denotes the number of photons involved in the pumping mechanism, which can be determined from the slope of the straight line obtained by plotting ln(I) vs. ln(P). Fig. 4(b) shows experimental data and fitting curves for ZnWO4:0.01Ho3+/0.15Yb3+ ceramic. The plots of ln(I) vs. ln(P) showed n values of 1.96, 1.83, and 2.11 for green, red, and near-infrared emissions, respectively. The slope values were near 2, which indicated that a two-photon UC mechanism was involved in all three emission processes. Fig. 4(c) shows the CIE chromaticity diagram, which is used to study color perception in terms of mathematically defined color spaces. The relevant boxed section in Fig. 4(c) has been enlarged. A yellowish-green color perception with coordinates of (0.32, 0.64) was obtained using a low laser power (20 mW) emission, and the color coordinates moved toward the pure green region with increasing excitation power. However, the color coordinates were almost unchanged when increasing the excitation power continuously from 40 mW (0.31, 0.67) to 240 mW (0.31, 0.68), indicating that the sample emission color was not meaningfully affected by the pump power.
3.3 Optical temperature-sensing properties
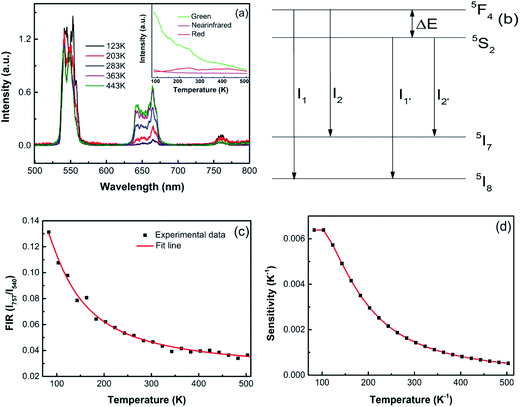
Optical temperature sensing is among the most important applications of UC emission materials. Herein, the optical temperature-sensing properties of ZnWO4:0.01Ho3+/0.15Yb3+ were analyzed using the FIR technique. For this purpose, the UC emission spectra of the ZnWO4:0.01Ho3+/0.15Yb3+ ceramic in the temperature range 83–503 K were investigated. Fig. 5(a) shows the UC emission spectra for ZnWO4:0.01Ho3+/0.15Yb3+ ceramic at 123, 203, 363, 443, and 523 K, with the spectra normalized to the most intense emission peak at 540 nm. No significant shift was observed for all UC emission bands. With increasing temperature, the green UC emissions decreased due to thermal quenching effect (see Fig. 5(a) inset). Based on previous reports, thermalization between the 5S2 and 5F4 levels was analyzed using a four-level FIR system. This system consists of four levels, namely 5I8 (level 1), 5I7 (level 2), 5S2 (level 3), and 5F4 (level 4), and was introduced by Haro-González et al.,30 as shown in Fig. 5(b). The energy gap between the 5F4 and 5S2 levels (ΔE) is about 120 cm−1.30 Therefore, populating the 5F4 level from the 5S2 level can be achieved by thermal excitation. Accordingly, the ratio of the bands at 540 nm and 757 nm (FIR) followed a Boltzmann-type distribution. The FIR can be described using eqn (1):31
 | (1) |
Fig. 5(c) showed the dependence of FIR on absolute temperature for the ZnWO4:0.01Ho3+/0.15Yb3+ phosphor. The FIR value decreased gradually with increasing temperature, reaching the minimum value at the maximum measured temperature. The solid line represents FIR obtained by fitting the experiment data. The curves matched well with the experimental data for ZnWO4 crystals. From Fig. 5(b), the fitted values of C1, C2, C3, C4, and energy gap ΔE were −0.10, 0.66, 2.08, 3.88, and 168.3 cm−1, respectively.
For optical thermometry applications, it is important to know the sensitivity (S). Similar to the three-level system, S can be defined using eqn (2):
 | (2) |
The calculated sensitivity as a function of temperature is shown in Fig. 5(d). The sensitivities decreased continuously with increasing temperature within the experimental temperature range. The maximum S value of about 0.0064 K−1 was obtained at 83 K. Therefore, Ho3+/Yb3+-codoped ZnWO4 crystals were better suited to low-temperature optical sensors. For comparison, the optical temperature-sensing performances of Ho3+-doped materials based on the FIR technique are listed in Table 1. The sensitivity of the materials (In–Zn–Sr–Ba glass, Y2O3, BCT and ZnWO4) was analyzed using the four-level system (5F4/5S2 → 5I8, 5I7) in entries at the top of Table 1, while other results were based on the three-level system. Compared to other materials based on the three-level system, the maximum S value based on the four-level system was obtained at a relatively low temperature. These results showed the Ho3+-doped materials were better suited to low temperature applications using this method.
| Materials | Temperature (K) | Excitation wavelength (nm) | Transitions | Smax (K−1) | References |
|---|---|---|---|---|---|
| Ho:In–Zn–Sr–Ba glass | 20–300 | 473 | 5F4/5S2 → 5I8, 5I7 | 0.0036 (59 K) | 30 |
| Ho, Yb:Y2O3 | 10–300 | 978 | 5F4/5S2 → 5I8, 5I7 | 0.097(536/772) (85 K) | 4 |
| 0.065(536/764) (84K) | |||||
| 0.046(536/758) (90K) | |||||
| Ho/Yb:BCT | 93–300 | 980 | 5F4/5S2 → 5I8, 5I7 | 0.0053 (93 K) | 31 |
| Ho, Yb:ZnWO4 | 83–503 | 980 | 5F4/5S2 → 5I8, 5I7 | 0.0064 (83 K) | This work |
| Ho:TeO2 glass | 265–440 | 890 | 5F4, 5S2 → 5I8 | 0.0098 (130 K) | 2 |
| Ho:LiTeO2 glass | 265–383 | 890 | 5F4, 5S2 → 5I8 | 0.0063 (265 K) | 3 |
| Ho/Yb:PbF2 | 303–643 | 980 | 5F2,3/3K8, 5G6/5F1 | 0.007 (643 K) | 7 |
| Ho/Yb:CaWO4 | 303–923 | 980 | 5F2,3/3K8, 5G6/5F1 | 0.005 (923 K) | 8 |
| Ho/Yb:NaLuF4 | 390–780 | 980 | 5F2,3/3K8, 5G6/5F1 | 0.0083 (500 K) | 9 |
| Ho/Yb/Zn:Y2O3 | 299–673 | 980 | 5F3, 3K8 → 5I8 | 0.003 (673 K) | 5 |
| Ho/Yb/Mg:CaMoO4 | 303–543 | 980 | 5F3, 3K8 → 5I8 | 0.0066 (353 K) | 6 |
The versatility of this material offered different strategies for temperature measurement using upconversion emission spectra. Fig. 5(a) shows a clear increase in red emission intensity with increasing temperature. However, the 5F4/5S2 level (attributed to green emission) and 5F5 level (attributed to red emission) were located far apart, with electronic populations that did not follow the Boltzmann-type distribution. Therefore, the FIR technique (three-level system or four-level system) is invalid. Fortunately, analysis of the schematic energy level diagram (Fig. 3) showed that the population of the 5F5 level mainly occurred through three pathways, among which the nonradiative relaxation process from the 5F4/5S2 level to 5F5 level was the most effective at low Ho3+ doping concentrations. The process was temperature dependent, as demonstrated by the faster increase in relative intensity of the red emission with increasing temperature (Fig. 5(a)).
Based on this analysis, we considered all of these levels to be electronically coupled, and that the temperature could be measured using the ratio of red and green light.32–34 This electronic coupling of Ho3+ is expressed in the plot of Ired/Igreen thermal evolution depicted in Fig. 6. Four lines were present, based on the different peaks of 5F4/5S2 → 5I8 (540 nm, 549 nm) and 5F5 → 5I8 (641 nm, 665 nm) transitions. Solid lines, obtained by fitting the experimental data, were linear. The R2 (coefficient of determination for linear fitting) value was close to 1, which indicated that the linear fitting of experiment data was reasonable. The sensitivity, determined from the slope of the fitting curve, was 0.00153, 0.00158, 0.00109, and 0.00113 K−1 for 5F4/5S2 → 5I8 (540 nm, 549 nm) and 5F5 → 5I8 (641 nm, 665 nm) transitions, respectively. Our research group has also studied the optical temperature sensing of Ho3+/Yb3+-codoped SrBi4Ti4O15 (ref. 33) and NaBi4Ti4O15 (ref. 34) using the intensity ratio of red and green emissions, resulting in sensitivities of 0.000493 and 0.0007 K−1, respectively. In comparison, Ho3+/Yb3+-codoped ZnWO4 showed higher sensitivities, implying that this is a versatile material for multiple thermal-sensing applications.
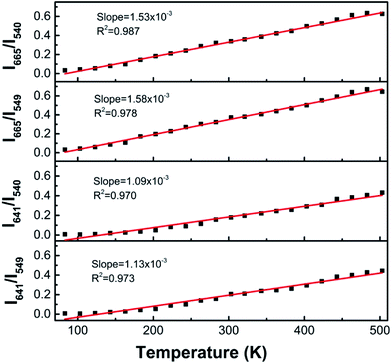 | ||
| Fig. 6 Ratio of red and green emission bands as functions of temperature for ZnWO4:0.01Ho3+/0.15Yb3+. | ||
4. Conclusion
Ho3+/Yb3+-codoped ZnWO4 phosphors were prepared using a high-temperature solid state method. The ZnWO4:0.01Ho3+/xYb3+ samples were found to crystallize in the polar monoclinic phase with space group P2/c by XRD analysis. The upconversion emissions were investigated under 980 nm excitation, with the optimal doping concentrations of Ho3+ and Yb3+ in the ZnWO4 host determined to be 1 mol% and 15 mol%, respectively. A possible upconversion emission mechanism was proposed, taking into consideration the dependence of emission intensities on the pumping power, and that the green and red emissions were both related to two-photon absorption processes. Furthermore, the near-infrared-green FIR (I757/I540) and red-green FIR (I641, 665/I540,549) were studied as a function of temperature from 83 K to 503 K. The optical temperature-sensing properties were discussed based on a four-level FIR system and the ratio of red and green band intensities. The FIR (four-level system) method results showed that the highest sensitivity occurred at low temperature. However, the ratio of the red and green peak intensities showed a linear dependence on temperature. Sensitivity was constant over the thermal range tested, which allowed more precise measurements at high temperatures.Acknowledgements
This work was supported by the National Science Foundation of China (Grant no. 51572195).References
- K. T. V. Grattan and Z. Y. Zhang, Fiber Optic Fluorescence Thermometry, Chapman and Hall, London, 1995 Search PubMed.
- A. K. Singh, Ho3+:TeO2 glass, a probe for temperature measurements, Sens. Actuators, BSens. Actuators, B, 2007, 136(1), 173–177 CrossRef CAS.
- A. K. Singh and S. B. Rai, Upconversion and optical thermometry in Ho3+:TeO2 glass, effect of addition of PbO2 and BaCO3, Appl. Phys. B: Photophys. Laser Chem.Appl. Phys. B, 2007, 86(4), 661–666 CrossRef CAS.
- V. Lojpur, M. Nikolic and L. Mancic, et al., Y2O3: Yb,Tm and Y2O3:Yb,Ho powders for low-temperature thermometry based on up-conversion fluorescence, Ceram. Int.Ceram. Int., 2013, 39, 1129–1134 CrossRef CAS.
- A. Pandey and V. K. Ray, Improved Luminescence and Temperature Sensing Performance of Ho3+,Yb3+,Zn2+:Y2O3 Phosphor, Dalton Trans.Dalton Trans., 2013, 42, 11005–11011 RSC.
- R. Dey, A. Kumari and A.K Soni, et al., CaMoO4:Ho3+–Yb3+–Mg2+ upconverting phosphor for application in lighting devices and optical temperature sensing, Sens. Actuators, BSens. Actuators, B, 2015, 210, 581–588 CrossRef CAS.
- W. Xu, X. Y. Gao, L. J. Zhang, Z. G. Zhang and W. W. Cao, Short-wavelength upconversion emissions in Ho3+/Yb3+ codoped glass ceramic and the optical thermometry behavior, Opt. ExpressOpt. Express, 2012, 20, 18127–18137 CrossRef CAS PubMed.
- W. Xu, H. Zhao, Y. X. Li, L. J. Zheng, Z. G. Zhang and W. W. Cao, Optical temperature sensing through the upconversion luminescence from Ho3+/Yb3+ codoped CaWO4, Sens. Actuators, BSens. Actuators, B, 2013, 188, 1096–1100 CrossRef CAS.
- S. S. Zhou, S. Jiang and X. T. Wei, Optical thermometry based on upconversion luminescence in Yb3+/Ho3+ co-doped NaLuF4, J. Alloys Compd.J. Alloy. Compd, 2014, 588, 654–657 CrossRef CAS.
- S. A. Wade, S. F. Collins and G. W. Baxter, Fluorescence intensity ratio technique for optical fiber point temperature sensing, J. Appl. Phys., 2003, 94, 4743–4756 CrossRef CAS.
- L. H. Fischer, G. S. Harms and O. S. Wolfbeis, Upconverting nanoparticles for nanoscale thermometry, Angew. Chem., Int. Ed., 2011, 50, 4546–4551 CrossRef CAS PubMed.
- A. Sedlmeiter, D. E. Achatz, L. H. Fischer, H. H. Gorris and O. S. Wolfbeis, Photon upconverting nanoparticles for luminescent sensing of temperature, Nanoscale, 2012, 4, 7090–7096 RSC.
- V. Nagirnyi, E. Feldbach and L. Jonsson, Energy transfer in ZnWO4 and CdWO4 scintillators, Nucl. Instrum. Methods Phys. Res., Sect. ANucl. Instrum. Methods Phys. Res., Sect. A, 2002, 486, 395–398 CrossRef CAS.
- F. G. Yang, C. Y. Tu, J. F. Li, G. H. Jia, H. Y. Wang, Y. P. Wei, Z. Y. You, Z. J. Zhu, Y. Wang and X. A. Lu, Growth and optical property of ZnWO4:Er3+ crystal, J. Lumin.J. Lumin., 2007, 126(2), 623–628 CrossRef CAS.
- F. G. Yang, C. Y. Tu, H. Y. Wang, Y. P. Wei, Z. Y. You, G. H. Jia, J. F. Li, Z. J. Zhu, X. A. Lu and Y. Wang, Growth and spectroscopy of Dy3+ doped in ZnWO4 crystal, Opt. Mater., 2007, 29(12), 1861–1865 CrossRef CAS.
- F. G. Yang, C. Y. Tu, H. Y. Wang, Y. P. Wei, Z. Y. You, G. H. Jia, J. F. Li, Z. J. Zhu, X. A. Lu and Y. Wang, Growth and spectroscopy of ZnWO4:Ho3+ crystal, J. Alloys Compd., 2008, 455(1–2), 269–273 CrossRef CAS.
- N. Van Minh, N. Manh Hung, D. T. Xuan Thao, M. Roeffaers and J. Hofkens, Structural and optical properties of ZnWO4:Er3+ crystals, J. Spectrosc.J. Spectrosc, 2013, 2013, 424185 Search PubMed.
- Q. Dai, H. Song, X. Bai, G. Pan, S. Lu, T. Wang, X. Ren and H. Zhao, Photoluminescence properties of ZnWO4:Eu3+ nanocrystals prepared by a hydrothermal method, J. Phys. Chem. C, 2007, 111(21), 7586–7592 CAS.
- X. P. Chen, F. Xiao, S. Ye, X. Y. Huang, G. P. Dong and Q. Y. Zhang, ZnWO4:Eu3+ nanorods: A potential tunable whitelight-emitting phosphors, J. Alloys Compd., 2011, 509(5), 1355–1359 CrossRef CAS.
- L. L. Wang, Q. L. Wang, X. Y. Xu, J. Z. Li, L. B. Gao, W. K. Kang, J. S. Shi and J. Wang, Energy transfer from Bi3+ to Eu3+ triggers exceptional long-wavelength excitation band in ZnWO4:Bi3+, Eu3+ phosphors, J. Mater. Chem. CJ. Mater. Chem. C Mater. Opt. Electron. Devices, 2013, 1(48), 8033–8040 RSC.
- X. X. Luo and W. H. Cao, Upconversion luminescence properties of Li+-doped ZnWO4:Yb, Er, J. Mater. Res., 2008, 23(8), 2078–2083 CrossRef CAS.
- D. Xu and J. Zang, Progress of study on upconversion laser& luminescence materials, J. Synth. Cryst.J. Synth. Cryst, 2001, 30(2), 203–210 CAS.
- Q. H. Zuo, L. H. Luo and Y. J. Yao, High Dielectric, Piezoelectric, Upconversion Photoluminescence and Low-Temperature Sensing Properties in Ba0.7Sr0.3TiO3–BaZr0.2Ti0.8O3:Ho/Yb Ceramics, J. Electron. Mater., 2016, 45(2), 970–975 CrossRef CAS.
- E. Kim, C. Jeon and G. Clem, “Effects of crystal structure on the microwave dielectric properties of ABO4 (A = Ni, Mg, Zn and B = Mo, W) ceramics”, J. Am. Ceram. Soc., 2012, 95(9), 2934–2938 CrossRef CAS.
- D. Gao, X. Zhang and W. Gao, Formation of Bundle-Shaped β-NaYF4 Upconversion Microtubes via Ostwald Ripening, ACS Appl. Mater. Interfaces, 2013, 5, 9732–9739 CAS.
- F. He, P. P. Yang, D. Wang, C. X. Li, N. Niu, S. L. Gai and M. L. Zhang, Preparation and Up-Conversion Luminescence of Hollow La2O3:Ln (Ln = Yb/Er, Yb/Ho) Microspheres, Langmuir, 2011, 27, 5616–5623 CrossRef CAS PubMed.
- G. J. Ding, F. Cao, G. H. Wu and D. H. Bao, Bright up-conversion green photoluminescence in Ho3+-Yb3+ co-doped Bi4Ti3O12 ferroelectric thin films, J. Appl. Phys., 2011, 109, 123101 CrossRef.
- G. Y. Chen, G. Somesfalean, Y. Liu, Z. G. Zhang, Q. Sun and F.P Wang, Upconversion mechanism for two-color emission in rare-earth-ion-doped ZrO2 nanocrystals, Phys. Rev. BPhys. Rev. B, 2007, 75, 195204 CrossRef.
- D. He, C. F. Guo, S. Jiang, N. M. Zhang, A. C. K. Duan, M. Yin and T. Li, Optical temperature sensing properties of Yb3+–Er3+ co-doped NaLnTiO4 (Ln = Gd, Y) up-conversion phosphors, RSC Adv., 2015, 5, 1385–1390 RSC.
- P. Haro-González, S. F. León-Luis, S. González-Pérez and I. R. Martín, Analysis of Er3+ and Ho3+ codoped fluoroindate glasses as wide range temperature sensor, Mater. Res. Bull., 2011, 46, 1051–1054 CrossRef.
- P. Du, L. H. Luo and J. S. Yu, Low-temperature thermometry based on upconversion emission of Ho/Yb-codoped Ba0.77Ca0.23TiO3 ceramics, J. Alloys Compd., 2015, 632, 73–77 CrossRef CAS.
- H. Zou, J. Li, X. S. Wang, D. F. Peng, Y. X. Li and X. Yao, Color-tunable upconversion emission and optical temperature sensing behaviour in Er-Yb-Mo codoped Bi7Ti4NbO21 multifunctional ferroelectric oxide, Opt. Mater. Express, 2014, 4(8), 1545–1554 CrossRef CAS.
- Q. F. Cao, X. S. Wang, Y. X. Li and X. Yao, Up-conversion luminescence and optical thermometry characterization of Ho3+/Yb3+ co-doped SrBi4Ti4O15 ferroelectric ceramics (in Chinese), Sci Sin Tech, 2014, 44(12), 1254–1260 Search PubMed.
- X. W. Hui, Y. X. Li and X. S. Wang, Up-conversion luminescent, dielectric and ferroelectric properties of new Aurivillius oxide Na0.5Ho0.5−xYbxBi4Ti4O15 (in Chinese), Sci. Sin. Tech, 2014, 44(12), 1233–1237 Search PubMed.
| This journal is © The Royal Society of Chemistry 2017 |

