
 Open Access Article
 This Open Access Article is licensed under a
 Creative Commons Attribution 3.0 Unported Licence
Biological fate of food nanoemulsions and the nutrients they carry – internalisation, transport and cytotoxicity of edible nanoemulsions in Caco-2 intestinal cells†
Tim J. Wooster *a,
Sean C. Moorea,
Wei Chenb,
Helen Andrewsa,
Rama Addepallib,
Robert B. Seymourb and
Simone A. Osborne*b
*a,
Sean C. Moorea,
Wei Chenb,
Helen Andrewsa,
Rama Addepallib,
Robert B. Seymourb and
Simone A. Osborne*b
aCSIRO Agriculture and Food, 671 Sneydes Road, Werribee, Victoria 3030, Australia. E-mail: Timjwooster@gmail.com
bCSIRO Agriculture and Food, Queensland Bioscience Precinct, 306 Carmody Road, St Lucia, Queensland 4067, Australia. E-mail: Simone.Osborne@csiro.au
First published on 16th August 2017
Abstract
Edible nanoemulsions are promising delivery systems with the potential to enhance nutrient/drug solubilisation, digestibility, bioavailability and potentially facilitate direct cellular uptake. However, the high potential of edible nanoparticles has also led to concerns about their biological fate and whether these nanoparticles or the active ingredients they carry pose (new) toxicological risks. Here we outline the development of new sub 50 nm edible nanoemulsions that allow us to probe the duality of enhanced nutrient solubilisation and bioavailability with potential toxicological side effects. The toxicity and biological fate of the edible nanoemulsions was investigated using Caco-2 cells to facilitate cell viability assays, transport of nanoemulsions across an in vitro intestinal model and internalisation visualised by confocal microscopy. These experiments demonstrate that edible nanoemulsion toxicity is not just a function of surfactant composition, but more critically a synergistic effect between surfactants and their physical location. Critically the presence of reactive ingredients (β-carotene) leads to a dramatic increase in nanoemulsion toxicity that may counteract the benefits associated with enhanced solubilisation/cellular uptake. Such research into the biological fate of edible food nanoemulsions and the nutrients they carry is important not only because nanotechnology in food is an emotive topic, but also because these insights may inform public policy decisions.
1 Introduction
The past 20 years have seen a dramatic increase in our development and use of nanotechnology across all fields of science. Within the soft matter community there has been a focus on the development and understanding of both hard (e.g. quantum dots, gold nanoparticles etc.) and “soft” nanoparticles (e.g. microemulsions, micelles and nanoemulsions).1–5 There has been strong interest from pharma, food and cosmetic industries in “soft” colloidal nanoparticles such as micellar structures and nanoemulsions (which encompass solid lipid nanoparticles) because their small size gives optical transparency, unique texture/rheological properties,2,6,7 and high interfacial areas for functionalization/reactivity.1–4 Soft nanoparticles are seen as particularly promising for enhancing the uptake of poorly soluble drugs/nutrients.8–12 It is now well established that nanoparticles smaller than 100 nm can undergo direct absorption by intestinal cells;13–16 in addition the interfacial region of nanoemulsions/micelles can act to solubilise poorly soluble molecules,8 – combined, these two properties can act to dramatically enhance drug/nutrient absorption.8 However, the potential for wide application of nanoparticles has also lead to concerns about their safety.17,18 The concerns about nanoparticles centre on two questions, (i) “what is the biological fate of (soft) nanoparticles?” and (ii) what (new) risks do nanoparticles pose to human health?Discussions of nanoparticle safety focusses on two main topics; cell uptake and toxicity.3,13,15,16 It is now widely established that particles smaller than 400 nm are capable of undergoing internalisation by cells from the intestine, lungs,19 cartilage19 and can even be targeted to tumour cells. Nanoparticle uptake has generally been found to follow multiple endocytosis pathways occurring mainly by: (i) clathrin-mediated endocytosis; (ii) caveolae-lipid raft dependant endocytosis; and sometimes (iii) macropinocytosis.20–26 Both caveolae (50–80 nm) and clathrin (100–200 nm) mediated endocytosis occur via the formation of membrane pits which bud into the cell to create (coated) vesicles that internalise nutrients (nanoparticles) present in the luminal fluid.27,28 Nanoparticle endocytosis starts by interaction with the surface of the membrane pit, either by direct interaction, via the surfactant (i.e. electrostatic attraction), through receptor recognition or recognition of proteins adsorbed to the surface of the nanoparticle.29 The contents of the internalised vesicles then proceed through cellular metabolic pathways to late endosomes and lysosomes. It is clear that endocytosis of nanoparticles is governed by interactions with the cell membrane, in our current example of edible nanoemulsions stabilised by PEO based surfactants (which are unable to form specific ionic interactions with the cell membrane) a key question is do they undergo cell internalisation and via what mechanism?
The toxicity of nanoparticles is of increasing importance especially with regard to the potential bioaccumulation of nanomaterials in the environment30,31 and the (potential) use of edible nanoemulsions in medical, nutritional or skincare products.1–5 The toxicity of a nanomaterial might arise either from; (i) the inherent toxicity of the chemicals/ingredients used in its manufacture and/or (ii) increased toxicity of the active ingredients they carry due to increased cellular absorption and bioavailability. In the case of nanoemulsions (and also solid lipid nanoparticles – a solid nanoemulsion), there is strong potential for low toxicity because the ingredients (lipids and surfactants) used in their manufacture are: (i) biodegradable within the human digestive tract; and (ii) are often generally recognised as safe (GRAS) ingredients. However, one concern of nanoemulsions is that they are created with high amounts of surfactants and additives, some of which cause low grade toxicity even though they are GRAS (e.g. polyoxyethylene based surfactants like Tween 80).32,33 To date there has been approximately 200 studies on the toxicity of nanoemulsions/solid lipid nanoparticles.13,15,21,22 These studies have been conducted across a broad range of cell types, nanoemulsion/SLN composition and surfactant type34–39 and have generally found: (i) the surfactant appears to be the largest contributor to nanoemulsion toxicity; and (ii) no conclusion can be made (to date) on whether toxicity changes with decreasing nanoemulsion/SLN size. It has generally been found that nanoemulsion (and surfactant) toxicity correlates with their ability to interact with the cell membranes.13,15,21,22 Nonionic surfactants such as the poloxamers Tween 80 and pluronics have systematically been found to be non-cytotoxic,34–37 and in some cases had higher tolerability when bound to a nanoparticle than when free in solution.37 In contrast, cationic surfactants have been shown to have moderate-high toxicity, thought to arise from their greater ability to bind directly with cell membranes.40,41 Despite widespread use of excipients (i.e. alcohol/polyol co-solvents) in microemulsion/nanoemulsion formulation there is limited study of the cytotoxicity of such a combination. It is well known that alcohols such as ethanol are toxic, largely from membrane disruption effects.38,39 What is unknown is whether the use of such excipients (ethanol) in combination with PEO surfactants in nanoemulsion preparations alters the nanoemulsions' cytotoxic effects?
In the case of nanoemulsions or microemulsions/micelle based nutra/pharmaceuticals, a second potential source of toxicity can arise from the active ingredients carried within the nanoemulsion. Many nutrients/pharmaceuticals are highly reactive molecules which may break down (i.e. via oxidation, photoactivation) or be metabolised to create reactive intermediates that are capable of reacting with molecular oxygen to create reactive oxygen species (ROS).42 The ROS free radicals (e.g. ˙OH and H2O2) then interact with various components of the cell (DNA, lipids, proteins and enzymes), causing DNA damage, lipid peroxidation, enzyme inactivation and/or protein damage or aggregation.42 These effects can form a cascade leading to cell mutation, uncontrolled proliferation and/or apoptosis. Fortunately, cells possess a number of vehicles including small molecule antioxidants (vitamin E and selenium) and antioxidant enzymes (catalase and superoxide dismutase) which normally intercept the free radicals in order to prevent or minimise the cellular damage associated with ROS.42 However, if the ROS levels are too high, then the cellular defences are overrun and cellular damage occurs. Potentially leasing to increased cell death or mutation.42
A number of drugs/nutrients have been associated with induction of oxidative stress/ROS induced cellular toxicity (e.g. doxorubicin – lipid peroxidation, apoptosis, and chloropromazine – photodegradation producing single oxygen and superoxide, β-carotene…).43,44 The severity of the outcomes are a function of both the nutrient/API concentration, bioavailability and their reactivity.42 It is logical then that nanoemulsion/micellar based delivery systems whose purpose is to enhance oral bioavailability of nutrients/pharmaceutical active ingredients might in turn accentuate their toxicity through this increased bioavailability. Within food and nutrition there is growing interest in using biodegradable nanoparticles to enhance the oral bioavailability of lipophilic and/or poorly soluble nutrients.5,45,46 For example there is significant interest in β-carotene and other carotenoids as a nutritional supplement because they are powerful anti-oxidants, can be precursors to vitamin A, have negligible toxicity in their native form47 and have demonstrated potential to reduce the effects of aging.47 However, increased cancer rates have been observed in smokers and asbestos workers receiving high doses of β-carotene,48,49 which was linked to the toxicity of the oxidation products of β-carotene.47,50,51 Given our recent development of edible nanoemulsions,46 we now seek to understand how their size and composition impacts their safety and the safety of nutrients/APIs they carry. Our key questions were whether the use of PEO based surfactant limited cellular uptake and whether the combination of ethanol with the PEO surfactant altered cellular toxicity. As a model nutrient/API, β-carotene was chosen because it is readily soluble in oil and its known potential to undergo chemical and metabolic transformation to create ROS. Such research into the biological fate of edible food nanoemulsions and the nutrients they carry is important not only because nanotechnology in food is an emotive topic, but also because insights from such research may inform public policy decisions.
2 Materials and methods
2.1 Materials
Tween 80 (Tween 80, 98%), ethanol (absolute, 99.8), isopropanol (99.9%), were used as supplied by Sigma-Aldrich Australia (Clayton, Victoria, Australia). Canola oil was a conventional commercial pure canola oil (see supplement Table 1 for composition) manufactured by Crisco oils and used as obtained from a local supermarket. β-Carotene was sourced as Betatene (30% Soy, Cognis Nutrition and Health Australia), which is a suspension of 30% carotenoids (94.5% β-carotene, 3.5% alpha-carotene, 2% tocopherols) in soybean oil. For cell culture studies, Dulbecco's modified eagle's medium (DMEM) with high glucose (4500 mg mL−1), heat inactivated foetal bovine serum (FBS), non-essential amino acids (NEAA), Hank's balanced salt solution (HBSS), rhodamine phalloidin, TO-PRO®3 and penicillin/streptomycin were from Gibco/ThermoFisher Scientific (Waltham, MA, USA). Transwells with polycarbonate membranes (0.4 μm pore size; surface area 0.33 cm2) were from Corning/Sigma-Aldrich. Cell culture flasks and 96 well plates were from Nunc/Sigma-Aldrich.| Set size (nm) | Canola oil (% v/v) initial (final) | Tween 80 (% v/v) initial (final) | Tween 80 (mg mL−1) initial (final) | Ethanol (% v/v) initial (final) | Empty nanoemulsions Z-average diameter (nm) | Loaded nanoemulsions Z-average diameter (nm) |
|---|---|---|---|---|---|---|
| 45 | 15.3 (10) | 6.3 (4.2) | 63 (42) | 27.9 (18.3) | 45.4 ± 0.3 | 44.8 ± 0.3 |
| 80 | 15.3 (10) | 5.0 (4.2) | 50 (42) | 13.9 (18.3) | 80.0 ± 1.0 | 82.2 ± 0.4 |
| 120 | 15.3 (10) | 5.0 (4.2) | 50 (42) | 0.0 (18.3) | 123.7 ± 0.9 | 126.0 ± 1.0 |
| 200 | 15.3 (10) | 3.0 (4.2) | 30 (42) | 0.0 (18.3) | 185.7 ± 2.0 | 205.2 ± 0.8 |
| 380 | 15.3 (10) | 0.3 (4.2) | 3 (42) | 0.0 (18.3) | 378.1 ± 3.5 | 384.0 ± 4.7 |
| ∼1000 | 15.3 (10) | 0.08 (4.2) | 0.8 (42) | 0.0 (18.3) | 881.02 ± 35.0 | 1088 ± 150 |
2.2 Nanoemulsion preparations
Pre-emulsions were prepared by dissolving the Tween 80 (0.5 to 5.6 wt%) in distilled deionised water at 45 °C and then adding the oil (15 wt%, 15.3 vol%) using a Silverson rotor-stator mixer (2 mm mesh) on its lowest speed setting for 2 minutes. After mixing, different sized nanoemulsions were prepared using a Microfluidics M-110Y Microfluidizer™ (MFIC Corporation, Newton, MA, USA) with a F20 Y 75 μm interaction chamber and H30 Z 200 μm auxiliary chamber inline, with inline post homogenisation cooling (3–5 °C). The 45 nm was prepared by subjecting a pre-emulsion to 6 passes at 1250 bar, the 80 nm (5 passes) and 120 nm (2 passes) at 1000 bar, the 200 nm emulsion 2 passes at 200 bar, 380 nm 1 pass at 200 bar and 1 micron 1 pass at 50 bar. The reproducibility between preparations was typically 2–6 nm.Nanoemulsions containing the green fluorescent fatty acid BODIPY® FLC11, were prepared by first dissolving the BODIPY® FLC11 in isopropanol and then mixing this with the vegetable oil then evaporated to dryness under nitrogen to remove the isopropanol. Nanoemulsions of the required particle size were then prepared according to the above procedures for nanoemulsions without fluorescent label.
Nanoemulsions containing β-carotene were prepared first by mixing 25 g of Betatene with 75 g of canola oil and heating in the dark to 70 °C under nitrogen to ensure complete dissolution of the β-carotene. 15 wt% oil in water nanoemulsions of the required particle size were then prepared according to the above procedures for nanoemulsions without β-carotene. The final β-carotene nanoemulsion was diluted 1/3 with MilliQ water to a final oil concentration of 10 wt% and a final β-carotene concentration of 3 mg g−1. Particle size measurements confirmed that the nanoemulsions containing β-carotene had the same size as those without it.
After preparation, all nanoemulsions were diluted 1/3 (i.e. 10 wt% oil) to an ethanol concentration (EtOH) where they were physically stable to coalescence and Ostwald ripening for far greater than 100 days.45,46
2.3 Droplet diameter measurement
Nanoemulsion droplet diameters were measured using dynamic light scattering (Nano ZS, Malvern, Worcestershire, United Kingdom), at a scattering angle of 173° using a 633 nm laser with each measurement being the average of 16 runs, each of 10 second duration. All samples were measured in distilled de-ionised water to avoid change in droplet size during the measurement due to the presence of N-alcohol. Nanoemulsions were diluted to give a scattering intensity of less than 500 cps (approximately 0.0075 wt%) to avoid the effects of multiple scattering. Samples were measured after 5 minutes equilibration at 25 °C and results are reported as the average of 3 measurements. The intensity average emulsion diameter, and polydispersity of each sample was obtained from the Cumulant analysis of each sample's correlation function.52 The distribution of sizes was obtained using the CONTIN analysis of each samples correlation function.532.4 Simulated gastric and intestinal digestion
The gastric and intestinal digestibility of selected nanoemulsions was assessed using a two compartment static in vitro gastro-intestinal model. The digestions were conducted in thermostated glass vessels (37 °C) in a pH-STAT setup controlled by a TIM 856 bi-burette pH-STAT (Radiometer Analytical, France). Gastric digestions were conducted at pH 5.5 using conditions as per Sassene et al. (100 mM NaCl, 80 μM Na taurocholate, 2 mM Tris Malic acid buffer, 20 μM phospholipid (egg PC – lipoid)) using rabbit gastric lipase (18 TBU mL−1) to replicate the function of human gastric lipase.54 Intestinal digestion was conducted at pH 6.8, in the presence of 10 mM CaCl2, 14 mM mixed bile salts, and pancreatin (1500 U mL−1 of pancreatic lipase, 240 USP U amylase and 240 U mL−1 protease – trypsin, chymotrypsin and elastase) as per Wooster et al.55 Fatty acid release during the gastric phase was quantified by GC-FID using acid and base methylation (GC-FAME) as per Cruz-Hernandez et al.56 Fatty acid release during the intestinal phase was quantified direct titration using a degree of fatty acid protonation of 0.6 as per Bennett et al,57 the validity of this approach was confirmed by verifying the final extent of digestion using by GC-FAME analysis of the final digesta.2.5 Cytotoxicity of intact (undigested) nanoemulsions using Caco-2 cells
Caco-2 cells were routinely cultured in DMEM with 10% FBS, 1% w/v penicillin/streptomycin and 1% w/v NEAA at 37 °C in 5% CO2. For cytotoxicity studies, Caco-2 cells (passage 10–20) were seeded into 96 well plates at a density of 1 × 10⁴ cells per well (day 0). Cells were grown for 14–21 days with growth media changed every two to three days. On day 14 (for studies involving BODIPY® FLC11 containing nanoemulsions) or 21 (for studies involving β-carotene containing nanoemulsions), growth media was removed and replaced with HBSS containing mg mL−1 concentrations nanoemulsion preparations or Tween 80 control. Additional Tween 80-EtOH and EtOH only controls were also included. The EtOH concentration in these controls was: 4.4, 2.2, 1.1, 0.55, 0.275 and 0.1375% w/w.For studies involving BODIPY® FLC11 containing nanoemulsions, the cells were incubated for four hours before the nanoemulsion preparations or controls were removed and the cells carefully washed once with HBSS. For studies involving β-carotene containing nanoemulsions, the cells were incubated overnight (14–16 hours) before the nanoemulsion preparations or control were removed and the cells carefully washed once with HBSS. Cytoxicity was determined using the CellTiter 96® AQueous Non-Radioactive Cell Proliferation Assay (MTS) and the CellTiter-Blue® Cell Viability Assay (Promega, Alexandria, NSW, Australia). Briefly, 20 μL of the MTS or CellTiter-Blue® assay reagent was added to 100 μL of HBSS and incubated with the cells for one or two hours. Absorbance was measured at 492 nm for the MTS assay and at 573 nm for the CellTiter-Blue assay to determine cell viability. Cytoxicity was expressed as the percentage of viable cells compared to untreated (HBSS only) cells versus the mg mL−1 concentration of Tween 80 in the nanoemulsion preparations. Cytotoxicity assays were performed in duplicate or triplicate using triplicate repeats (n = 6 or n = 9).
2.6 Transport studies of intact (undigested) nanoemulsions
Caco-2 (human colorectal adenocarcinoma, ATCC) cells (passage 10–20) were seeded into transwell apparatus at a cell density of 1.2 × 10⁵ cell per cm2. Cells were grown for 21 days to facilitate cell differentiation and formation of an intact monolayer. During this period growth media was removed every 2–3 days and replaced with fresh media. On day 21, cell differentiation was measured by transepithelial electrical resistance (TEER) in an apical to basolateral direction using a Millicell-ERS Voltohmeter (Millipore, Darmstadt, Germany). TEER readings above 0.25 kΩ cm−2 and expression of rhodamine in cellular tight junctions (Fig. 6) indicated Caco-2 cell differentiation and formation of an intact cell monolayer suitable for transport studies.For transport of BODIPY® FLC11 containing nanoemulsions, growth media was removed and replaced with HBSS, or HBSS containing nanoemulsions or their constituents, for 4 hours. The amount of cellular transport of the BODIPY® FLC11 containing nanoemulsions with diameters between 45 and 200 nm, was assessed by measuring the fluorescence at emission λ = 518 nm (excitation λ = 490 nm) from the apical and basolateral layers. The amount of nanoemulsion in each layer was quantified from calibration plots of standard dilutions of each nanoemulsion size, which were linear (r2 ≥ 0.995) over two orders of magnitude in concentration (0.22 to 22 mg mL−1 Tween 80). All measured fluorescence values were within the bounds of the linear calibration plots. The amount of BODIPY® FLC11 containing nanoemulsions retained by the cells was determined as the difference between the applied amount and that quantified in the apical and basolateral layers. Distribution of the BODIPY® FLC11 containing nanoemulsions in the cells and in the apical and basolateral layer was expressed as a relative percentage ± standard% error from two independent experiments performed in triplicate (n = 6).
2.7 Confocal laser scanning microscopy
Following transport of Bodipy C11 containing nanoemulsions, the Caco-2 cells were washed with HBSS, fixed to the transwell membranes and stained with TO-PRO®-3 and rhodamine phalloidin to visualise the nuclei and cellular tight junctions (respectively).58 Stained cells were imaged on a Leica TCS SP5 confocal microscope (Leica Microsystems, Mannheim, Germany). A 488 nm argon laser was used to excite the Bodipy C11 (581/591) and emitted light was collected between 495 nm and 530 nm while 543 nm and 633 nm helium-neon lasers were used to excite the rhodamine labelled phalloidin with the emitted light collected between 560 nm and 600 nm and the TO-PRO®-3 with the emitted light collected between 640 nm and 710 nm respectively.2.8 Statistical analysis
All statistical comparisons were conducted using either a one-way ANOVA with Dunnett's comparison tests or an unpaired t test. These calculations were carried out using GraphPad Prism 6 Software for Windows. Significance was observed at P < 0.05. Inhibitor concentrations at 50% (IC50) were calculated from percentage inhibition using GraphPad Prism 6 (using variable slope response curves (four parameters)) and expressed as mean IC50 (with all R2 above 0.88) ± standard error.3 Results & discussion
3.1 Nanoemulsion creation
It is typically very difficult to create stabile nanoemulsions with particle sizes below 120 nm using edible triglyceride oils because of the extreme homogenisation energies required.45,59 However, we recently highlighted that using a combination of low energy microemulsion phase inversion composition approaches with high shear homogenisation facilitated the creation of sub 50 nm nanoemulsions.46 Fig. 1 presents the impact that ethanol addition had on nanoemulsion droplet diameter. At low contents (0–30 vol%), ethanol had a beneficial effect, reducing nanoemulsion droplet diameter from ∼120 nm at 0 vol% to ∼50 nm at 34–40 vol% ethanol in the aqueous phase. The addition of ethanol above 40 vol% lead to a dramatic increase in nanoemulsion average droplet diameter, which eventually lead to complete destabilisation and separation into layers of oil and water. It was possible to create nanoemulsions as small as Dh = 45 nm (Dv = 34 nm) because the partitioning of ethanol to the interfaces induces two effects; (i) a reduction in interfacial tension due to the (local) dilution of water and (ii) dehydration of Tweens PEO headgroups bending its spontaneous curvature (H0) towards (and even exceeding) the preferred curvature of the interface (i.e. the balance point).46 Nanoemulsions with average diameters, Dh of 45, 80 and 120 nm that were used for cytotoxicity and transport studies were made with compositions (i) (ii) and (iii) in Fig. 1. Nanoemulsions with larger sizes, Dh of 200, 380 nm and 1 micron were achieved by balancing the amount of surfactant available to stabilise the newly created interface during homogenisation and by controlling the shear applied during homogenisation. After preparation, all nanoemulsions were diluted to an ethanol concentration where they were physically stable to coalescence and Ostwald ripening for in excess of 100 days.45,46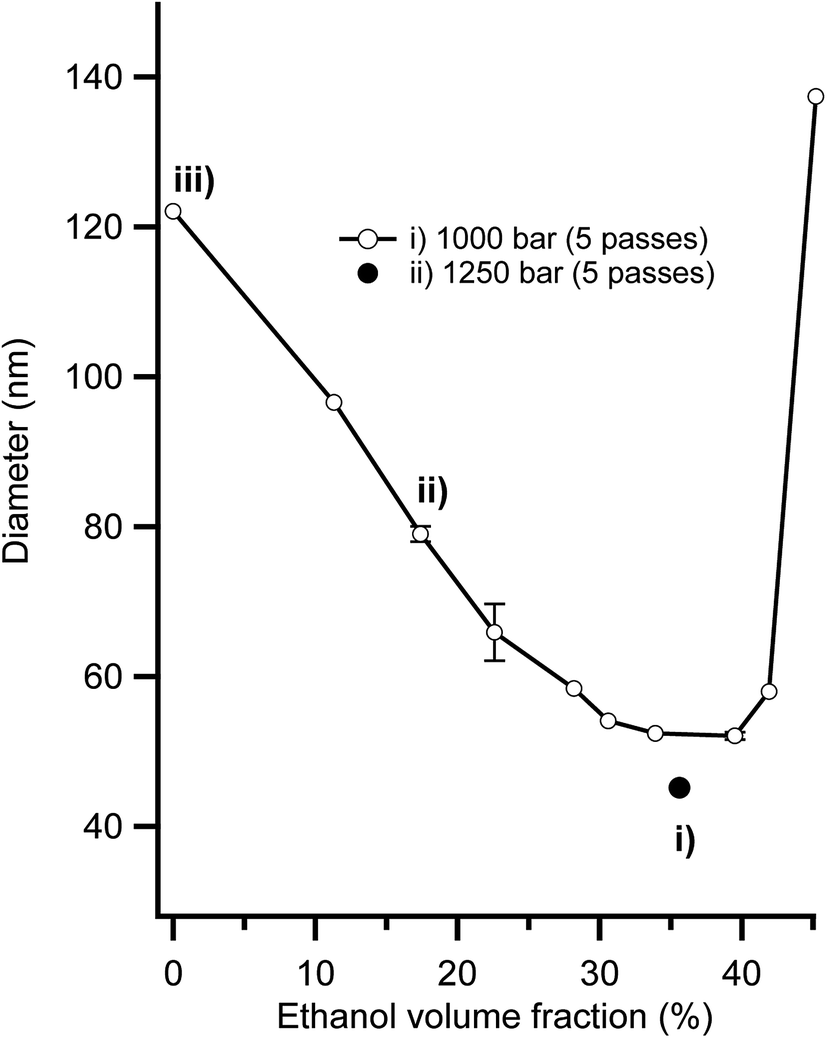 | ||
| Fig. 1 Impact of ethanol volume fraction (as% of aqueous phase) on the average hydrodynamic diameter of 15% v/v canola oil in water nanoemulsions stabilised by 6.3% v/v polyoxyethylene (20) sorbitan mono-oleate (Tween 80). Average hydrodynamic diameters are the average of four measures on two separate preparations of each emulsion formulation. Systems (i) 45 nm, (ii) 80 nm and (iii) 120 nm were used for assessment of cytotoxicity, and cellular uptake. System (i) was also used for beta-carotene cytotoxicity experiments. | ||
3.2 Digestion of nanoemulsions
The gastrointestinal digestibility of example edible nanoemulsions was compared to a control phospholipid emulsion (readily digestible) using a two-step static in vitro digestion model,8,55 which includes a validated mimic of gastric lipase.54,60 A pH of 5.5 was used for the gastric compartment as this is the post-prandial pH found after consumption of liquid protein beverages, and is in the pH range for maximal gastric lipase activity.61 Intralipid was chosen as the control emulsion as it is a certified parenteral emulsion known to be readily digestible and being extensively used as a model in lipedema. Fig. 2 presents the extent of lipolysis of the two emulsions during progression from gastric to intestinal conditions. Under gastric conditions, the lipolysis of the phospholipid stabilised emulsion steadily increased with time, being 6.3 ± 3.8% at 5 min, 9.5 ± 2.1% at 15 min, 15.1 ± 1.2% at 30 min and slowing moderately to 22.4 ± 8.8% at 60 min. In contrast, the 45 nm nanoemulsion did not undergo significant lipolysis during the first 60 minutes of gastric digestion. Under intestinal conditions, both emulsions underwent a very rapid initial rate of lipolysis (IL: 79.5 ± 0.5 μmol min−1, NE: 59.4 ± 2.2 μmol min−1) reaching ∼92% lipolysis within 10 min, and 95% within 60 min. The gastro-intestinal lipolysis of the control phospholipid stabilised emulsion is typical of a readily digestible emulsion undergoing digestion in adults, where typically 15–20% lipolysis occurs via gastric lipase within the stomach and the remainder via a combination of lipases within the intestine.61 The complete lack of lipolysis of the 45 nm nanoemulsion within the gastric compartment is similar behaviour to other surfactants (Triton X) and likely arises because the Tween surfactant inhibits adsorption of gastric lipase to the interface.62 Upon passage to the intestinal compartment, bile salts rapidly adsorb to the interface and overcome the inhibition of lipase adsorption thereby facilitating rapid digestion.55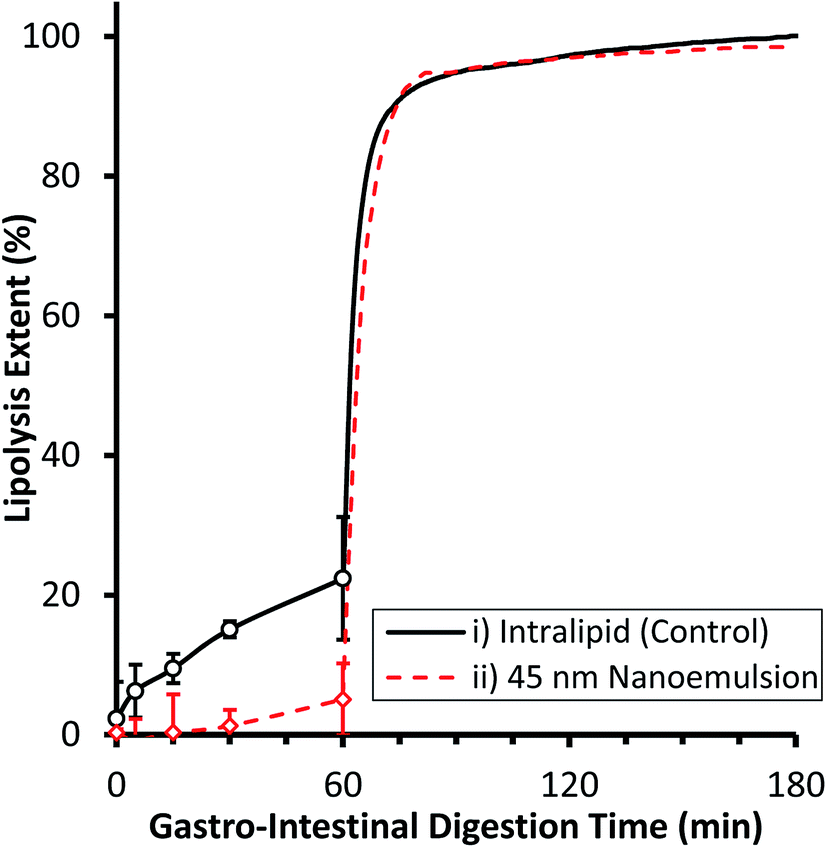 | ||
| Fig. 2 Extent of (in vitro) lipolysis as a function of time for two different emulsions: (i) a ∼200 nm Intralipid reference nanoemulsion stabilised by phosphatdylcholine; and (ii) a 50 nm edible nanoemulsion stabilised by polyoxyethylene(20)sorbitan monoleate (Tween 80) during two step simulated gastric and intestinal digestion. Lipolysis extent is measured by GC-FAME during the gastric phase and pH-STAT during the intestinal phase. Results are the mean of three independent digestions, error bars represent one standard deviation. | ||
3.3 Toxicity of edible triglyceride nanoemulsions
Cytotoxicity of edible nanoemulsions was assessed with the Caco-2 cell line using MTS and CellTiter-Blue cell viability assays. Fig. 3 presents the impact of varying concentrations of edible nanoemulsions, or their components, on the viability of differentiated Caco-2 cells, whilst Fig. 4 presents light microscopy images of selected Caco-2 cell layers that have been exposed to edible nanoemulsions or their components. It is apparent that cell viability decreases with increasing emulsion particle size. Nanoemulsions with a Dh of 45, 80 and 120 had 80–100% cell viability (with both cell viability assays) at Tween 80 concentrations ranging from 0.3125 to 10 mg mL−1 whereas cell viability decreased to 70 (CellTiter-Blue) and 35% (MTS) at 10 mg mL−1 when the nanoemulsion size increased to 200 nm. Caco-2 cell viability decreased dramatically (Fig. 3) when emulsion droplet size was increased further to 380 nm and 1 micron. Emulsions with a Dh of 380 nm had 100% viability up to a Tween 80 concentration of 0.5 mg mL−1; above this concentration there was clear evidence of extensive cell death with cell viabilities decreasing to 74% (CellTiter-Blue) and 40–55% (MTS). Increasing droplet size to 1 micron (1000 nm) increased cytotoxicity even further, with cell viability decreasing to 70% (CellTiter-Blue) and 40% from 0.2 mg mL−1 Tween 80 concentrations.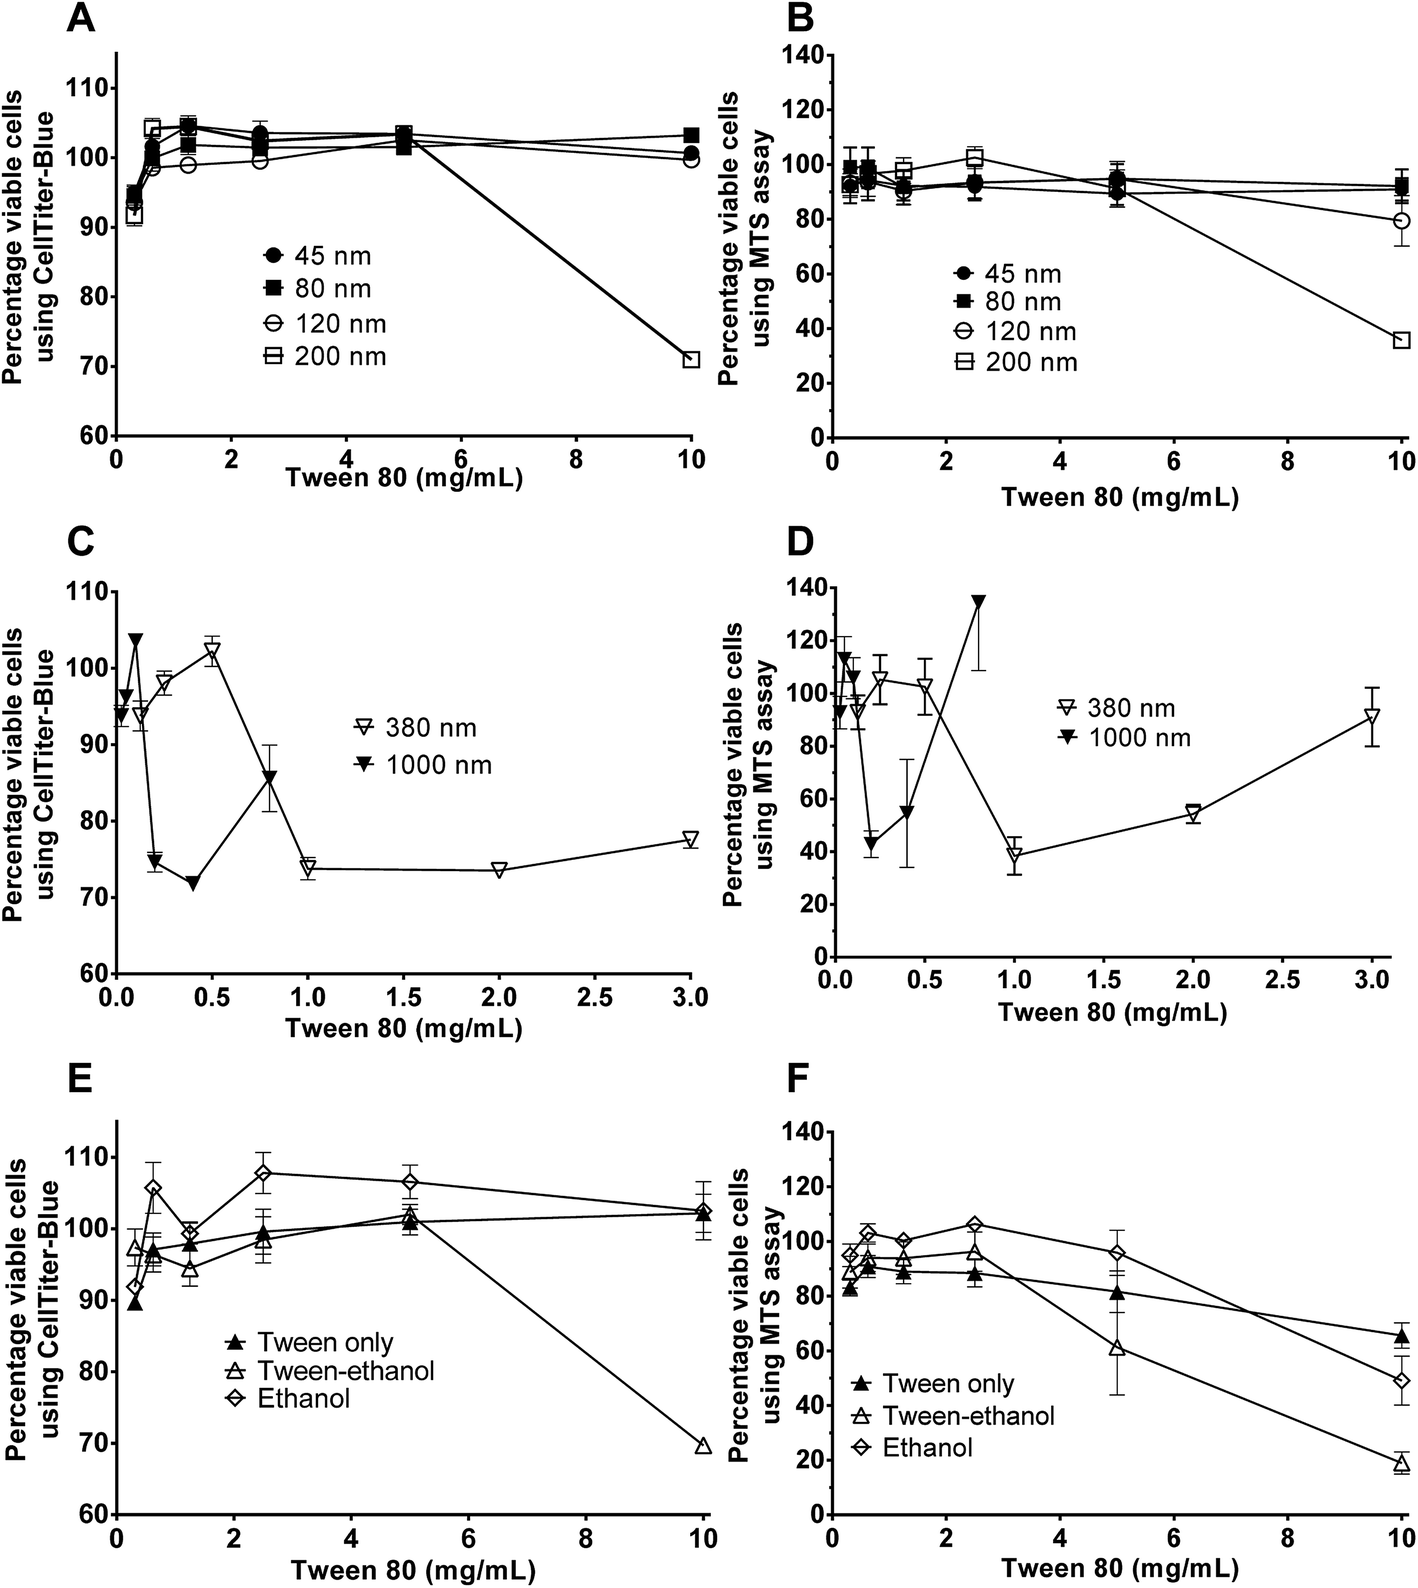 | ||
Fig. 3 Effect of different sized nanoemulsions or their constituents on Caco-2 cell viability determined in vitro using CellTiter-Blue® Cell Viability Assay (A, C and E) and CellTiter 96® AQueous Non-Radioactive Cell Proliferation Assay (MTS) (B, D and F). Cells were grown for 14 days prior to 4 hour treatment with different sized nanoemulsions in HBSS. Nanoemulsion sizes included (A and B) 45, 80![[thin space (1/6-em)]](https://www.rsc.org/images/entities/char_2009.gif) 120 and 200 nm and (C and D) 380 & 1000 nm. Constituents included (E and F) Tween, Tween-ethanol and ethanol (0.1375, 0.275, 0.55, 1.1, 2.2 and 4.4% v/v ethanol). 120 and 200 nm and (C and D) 380 & 1000 nm. Constituents included (E and F) Tween, Tween-ethanol and ethanol (0.1375, 0.275, 0.55, 1.1, 2.2 and 4.4% v/v ethanol). | ||
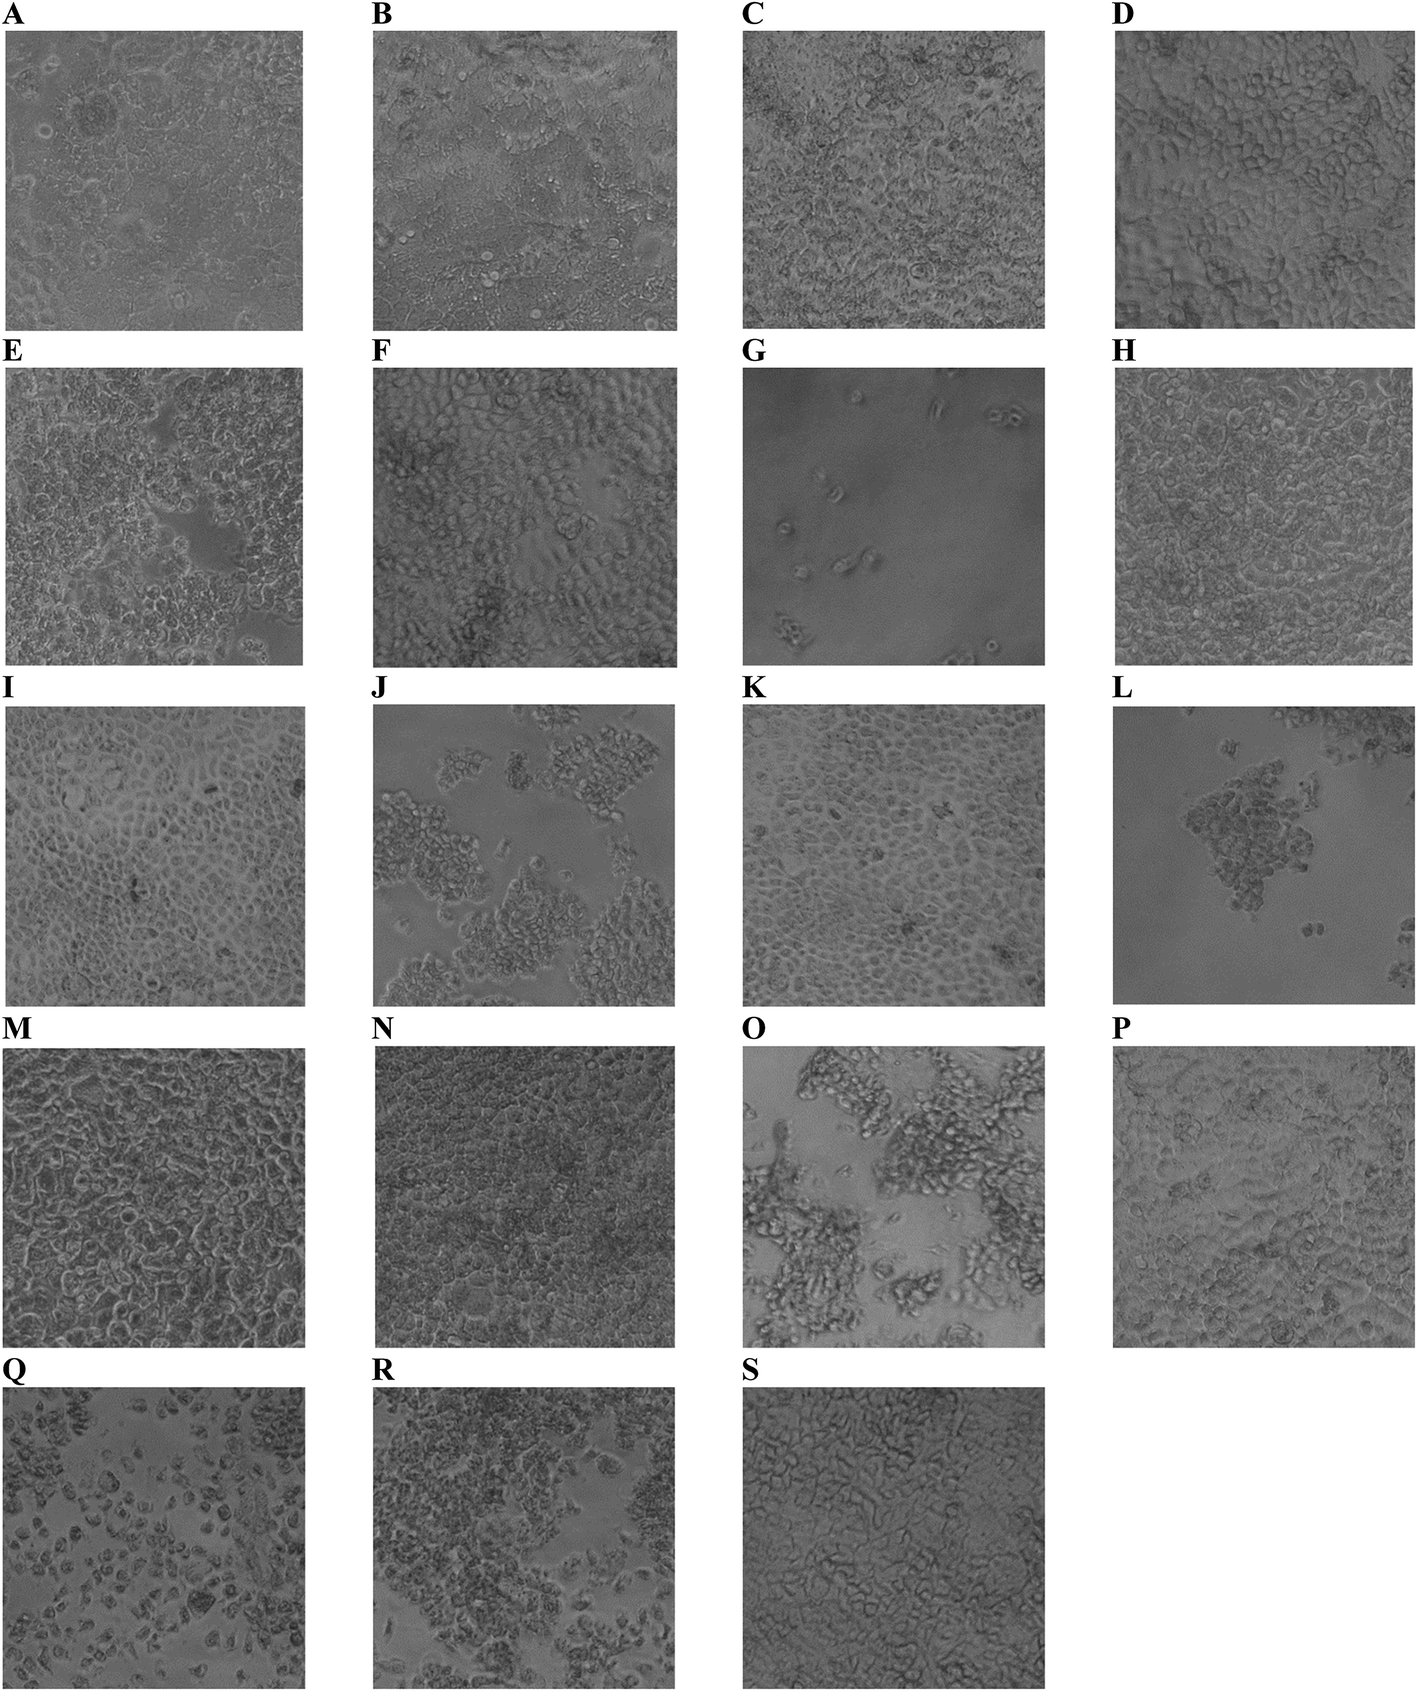 | ||
| Fig. 4 Light microscope images of Caco-2 cells grown in 96 well plates for 14 days before 4 hour exposure to different sized nanoemulsions: 10 and 5 mg mL−1 (respectively) (A and B) 45 nm, (C and D) 80 nm, (E and F) 120 nm, and (G and H) 200 nm nanoemulsions; 3 and 1 mg mL−1 (I and J) 380 nm; 0.8 and 0.2 mg mL−1 (K and L) 1000 nm; and their constituents 10 and 5 mg mL−1 (M and N) Tween 80; 4.4 and 2.2% v/v (O and P) ethanol; 10 and 5 mg mL−1 (Q and R) Tween 80-ethanol buffer and (S) HBSS buffer. | ||
It was also evident that increasing concentrations of 380 and 1000 nm nanoemulsions created false positive results in the cell viability assays (Fig. 3) shown by an increase in percentage of viable cells from 2.0 and 0.5 mg mL−1 (Tween 80 content) in 380 nm and 1000 nm nanoemulsions (respectively). This was possibly due to the light scattering effect of the nanoemulsions, either adhered to the cell layer or 96 well plate or taken up by cells, or by a fixative effect of those preparations. To visualise these false positive results, light microscope images were taken of the cells. In Fig. 4 panels A – H, images of cells exposed to 10 and 5 mg mL−1 45, 80, 120 and 200 nm nanoemulsions show confluent cell layers, except for panel G where cells were treated with 10 mg mL−1 200 nm nanoemulsions and produced obvious cell toxicity and death. All cell viability results in response to 45–200 nm nanoemulsions were indicative of the cell images captured. Fig. 4 panels I and K captured the false positive results measured in the cell viability assays in response to 380 and 1000 nm nanoemulsions and show smaller cuboid-like cells with a morphology different to the elongated Caco-2 cells observed in the HBSS control (Fig. 4 panel S). Compared to the smaller nanoemulsions (45–200 nm) that enter cells more easily, the larger nanoemulsions may aggregate on the cell surface displacing water from the cell surface as well as dehydrating the cells after entering causing the Caco-2 cells to appear fixed to the surface of the culture plate.
Fig. 3 also presents the impact of Tween 80, ethanol co-solvent and Tween 80-ethanol buffer on cell viability. Ethanol by itself appears to have a mild impact on cell viability, having no effect at concentrations up to 4.4% v/v in the CellTiter-Blue assay and decreasing cell viability in the MTS assay (to 50%) only at 4.4% v/v. Likewise, Tween 80 alone had only a mild effect on cell viability, with no impact on cell viability up to 4.4% v/v in the CellTiter-Blue assay and decreasing cell viability in the MTS assay (to 65%) only at 10 mg mL−1. The combination of Tween 80 with ethanol affect cell viability more than Tween 80 and EtOH alone. No changes in cell viability were observed in response to 0.3125 to 2.5 mg mL−1 Tween 80/ethanol (containing 0.1375–1.1% v/v EtOH), however, 5 and 10 mg mL−1 Tween 80/ethanol (containing 2.2 and 4.4% v/v ethanol) decreased cell viability to 60% and 20% in the MTS assay, and to 70% in the CellTiter-Blue assay at the highest concentration.
Fig. 4 visualises the cell viability trends measured by the MTS and CellTiter-blue assays showing some cell death in the highest ethanol concentration (Fig. 4 panel O) and marked cell death in the two highest Tween 80/ethanol treatments (Fig. 4 panels Q and R) compared to the HBSS control (Fig. 4 panel S). Exposure of the Caco-2 cell layers to ethanol alone did not appear to change monolayer confluency at 2.2% v/v, however, at 4.4% v/v the cell layers appeared as islands of cells mixed with free cells. Exposure of the cells to the Tween 80/ethanol mixture lead to complete disruption of the cell layers; at 10 mg mL−1 Tween 80/4.4% ethanol only free cells are observed, at 5 mg mL−1 Tween 80/2.2% v/v ethanol islands of cells and free cells are observed. From the cell viability results and the light microscope images it is clear that exposure to Tween 80 alone does not cause cell disruption (at the concentrations studied) whilst exposure to ethanol alone does cause cell disruption. Furthermore, mixtures of Tween and ethanol appear to cause more extensive cell disruption than the ingredients alone, pointing towards a synergistic interaction which is perhaps of similar nature to the one that was exploited to facilitate the creation of edible nanoemulsions.46
It is not surprising that the presence of ethanol and Tween 80 caused some decreases in cell viability. In vitro studies of the impact of ethanol on intestinal barrier function reveal that ethanol decreases cell viability via oxidative stress.63,64 Banan et al. found that the onset of ethanol cytotoxicity occurs between 1–2.5 vol% depending on the duration of exposure – a range that is consistent with the onset of cell death observed in the current study (i.e. onset at between 4.4 and 2.2 wt%). Tween surfactants are also known to exhibit a concentration dependant cytotoxicity on Caco-2 cell lines, albeit at concentrations typically ten times higher than anionic surfactants and bile salts.33,35,65,66 Tween surfactants decrease cell viability by interacting with or inserting into the cell membrane, which at high concentrations leads to solubilisation of the membrane.33,35,65,66 What is very unusual is the dramatic decrease in the onset concentration for cell death in the nanoemulsions when both Tween and ethanol are present, particularly when combined into nanoemulsions above 200 nm. Cell viability decreased by more than 50% in response to 1 mg mL−1 380 nm nanoemulsion and 0.2 mg mL−1 1 micron emulsions; concentrations approximately 10 and 50 times lower than the concentrations that produced toxicity following exposure to 200 nm nanoemulsions. Potential mechanisms behind this are discussed in the final section of this paper.
3.4 Cellular uptake & transport studies
The cellular uptake and transport of edible nanoemulsions was assessed by labelling the nanoemulsions with a fluorescent label (BODIPY 581/591) attached to a C11 fatty acid. Cellular transport was quantitatively assessed by measuring fluorescence in both the apical and basolateral layers (Fig. 5), whilst internalisation of the nanoemulsions (45 to 380 nm) was subjectively assessed using confocal microscopy (Fig. 6). The fluorescence transport measurements in Fig. 5 indicate that a considerable amount of nanoemulsion interacted with the Caco-2 cell layers. Measurements of nanoemulsion concentration (via fluorescence) in the apical layer after 4 hours of transport indicated that approximately 25 to 40% of nanoemulsions had been transported through or absorbed by the cell monolayer. There appears to be a systematic relationship between nanoemulsion size and the amount transported and absorbed by the Caco-2 cell layers. Small 45 nm nanoemulsion concentration decreased in the apical layer by 24.5 ± 0.97%; this increased to 30.8 ± 1.6% and 41.3 ± 1.8 as nanoemulsion size increased to 80 and 120 nm respectively. Above 120 nm, the amount of nanoemulsion in the apical layer decreased by 36.5 ± 2% for the 200 nm nanoemulsions and by 29.3 ± 3.5% for the 380 nm nanoemulsions suggesting that there is an optimum nanoemulsion size or composition for cellular transport and absorption.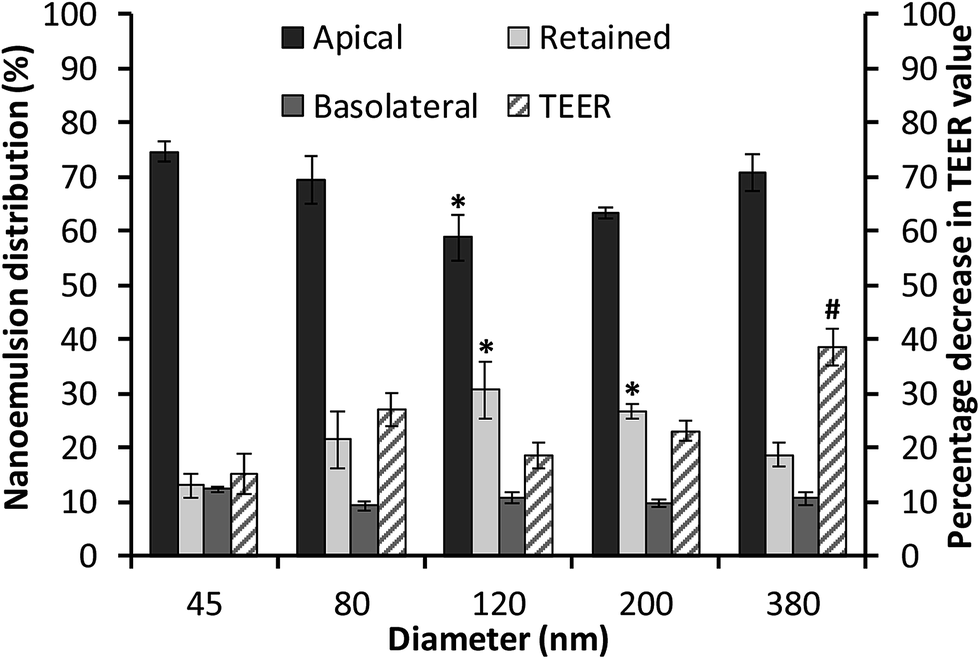 | ||
Fig. 5 Distribution of BODIPY C11 581/591-labelled nanoemulsions (NE) of different sizes in Caco-2 cell monolayers grown on transwell membranes (for 21 days) following 4 hour transport and effect on transepithelial electrical resistance (TEER). Percentage distribution of BODIPY C11 581/591-labelled NE in apical  , basolateral , basolateral  and retained and retained  . * indicates statistical significance in NE distribution compared to 45 nm NE. Decrease in TEER . * indicates statistical significance in NE distribution compared to 45 nm NE. Decrease in TEER  (apical – basolateral direction) following 4 hour transport of BODIPY C11 581/591-labelled NE in HBSS. # indicates statistical significance in TEER change compared to HBSS control. All data represents the mean of two independent experiments performed in triplicate (n = 6) ± standard error. Statistical significance determined using a one way ANOVA with Dunnett's multiple comparison test. (apical – basolateral direction) following 4 hour transport of BODIPY C11 581/591-labelled NE in HBSS. # indicates statistical significance in TEER change compared to HBSS control. All data represents the mean of two independent experiments performed in triplicate (n = 6) ± standard error. Statistical significance determined using a one way ANOVA with Dunnett's multiple comparison test. | ||
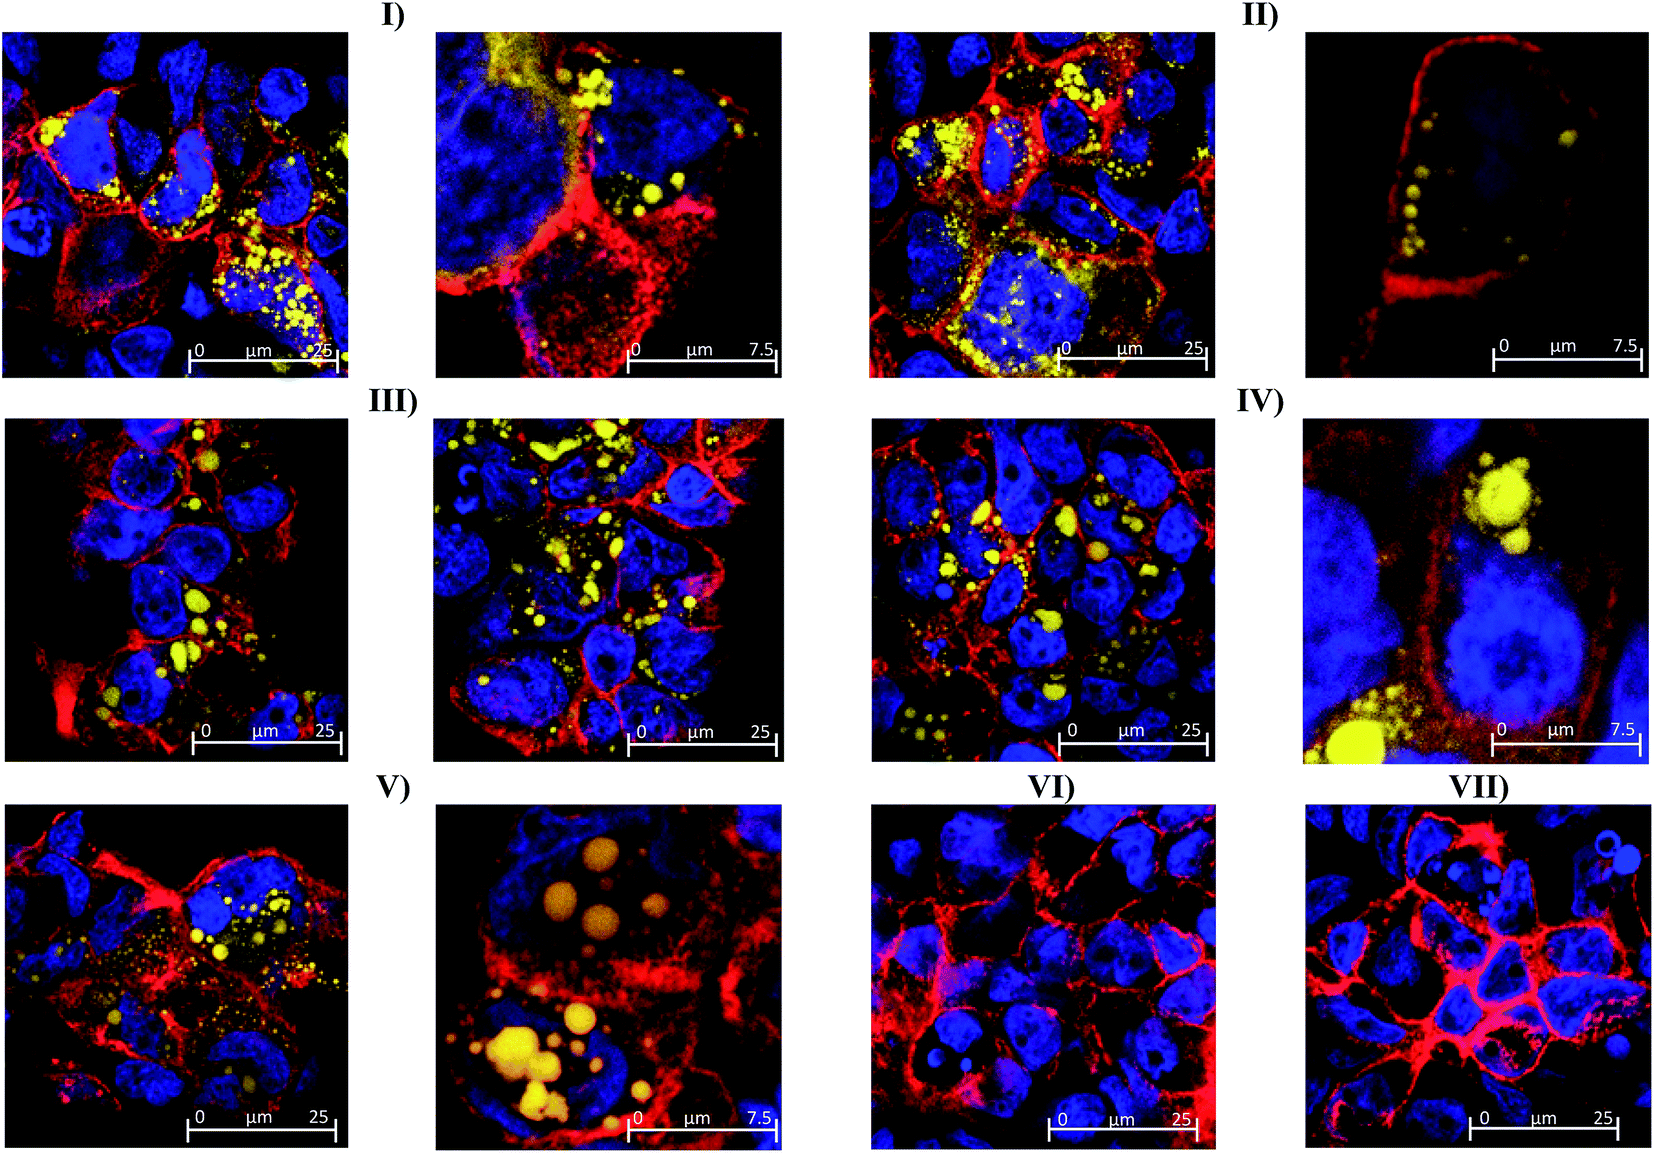 | ||
| Fig. 6 Confocal microscope images of fixed and stained Caco-2 cell monolayers grown on transwell membranes for 21 days prior to 4 hour exposure to BODIPY C11 581/591-labelled nanoemulsions of different sizes: (I) 45 nm; (II) 80 nm; (III) 120 nm; (IV) 200 nm (V) 380 nm; (VI) unlabelled 45 nm nanoemulsions or constituents (VII) Tween 80-ethanol. Fixed cells were stained with TO-PRO-3 (blue nuclei) and rhodamine phalloidin (red tight junctions). | ||
Analysis of nanoemulsion concentration in the basolateral layer indicated that a moderate amount of nanoemulsion (10–14%) was transported through the Caco-2 cell layer. However, there was no significant difference in nanoemulsion concentration in the basolateral layer across the different droplet sizes. By difference, these results suggest that between 13 and 26.7% of nanoemulsions were retained by the Caco-2 cell layers. The question is, what might be the mechanism driving this incorporation? The transport of molecules or structures through Caco-2 cell layers can occur via: (i) transcellular routes (transport through lipophilic/phobic pores or active/passive diffusion in solution); and/or (ii) paracellular routes through the disruption of tight junctions (TJs) or adherens junctions (AJs). Preliminary information on the potential route of nanoemulsion transport through the Caco-2 cell layers was gained through measurements of transepithelial electrical resistance (TEER) (Fig. 5B) and 3D confocal microscopy (Fig. 6). In general, the TEER values of Caco-2 cell layers that were exposed to nanoemulsions (45 to 200 nm) did not significantly decrease (by 15.2–26.9%) in comparison to those that had been incubated with HBSS alone (13.6 ± 5.6%) for four hours. However, the decrease in TEER for Caco-2 layers that had been exposed to the 380 nm emulsion was more than double (38.6 ± 3.3%) the decrease seen for cells incubated in HBSS. The lack of a considerable reduction in cell TEER (for nanoemulsions Dh < 200 nm) suggests that nanoemulsion uptake is less likely to occur via disruption of TJs/AJs which facilitate transport via paracellular routes.
The possibility of nanoemulsion transport occurring via transcellular routes was preliminary investigated using confocal microscopy and multiple stains to identify cell compartments. Specifically, rhodamine phalloidin was used to stain actin present in the cell membrane and tight junctions red, TO-PRO®3 was used to stain nuclei blue and the fluorescently labelled nanoemulsions were visualised as yellow. Taking the images from the 80 nm nanoemulsion as an example (Fig. 6II), the perfuse staining of the exterior of each cell and interstitial space highlights that the cell membrane and tight junctions are comprised of actin and are intact. Examination of all of the cell compartments in Fig. 6III reveals a very high number of yellow stained (fluorescent) structures consistent with Bodipy C11. Such structures are not visible in the images of cell layers incubated with Tween 80-ethanol (Fig. 6VII) or the unlabelled 45 nm nanoemulsions (Fig. 6VI). A closer examination of a Caco-2 cell in Fig. 6IV shows that the nanoemulsion clusters are contained within the cell membrane and not between the cells. Curiously, the confocal images of cells exposed to different sized nanoemulsions did not show an obvious size effect on cellular uptake. Such quantitative analysis is difficult with confocal microscopy due to the use of different laser intensities and the potential for bleaching. Overall, it is clear from the transport studies that nanoemulsions are incorporated into Caco-2 cells to quite a considerable extent under in vitro conditions. Preliminary investigations using TEER and confocal microscopy strongly suggest that nanoemulsion uptake occurs largely via transcellular routes, however paracellular uptake cannot be discounted particularly for the 380 nm nanoemulsion which have increased cytotoxicity and decreased TEER values.
3.5 Toxicity of nanoemulsions containing β-carotene
The effect that a reactive nutrient has on nanoemulsion toxicity was assessed as a function of NE concentration using differentiated Caco-2 monolayers via MTS cell viability assays (Fig. 7). Differentiated Caco-2 cell layers were exposed to: (i) plain (or empty) triglyceride nanoemulsions; (ii) triglyceride nanoemulsions containing 3 mg mL−1 β-carotene within the oil phase; and (iii) the surfactant–ethanol mixture for 14–16 hours. In Fig. 7 all treatments produced a dose response in Caco-2 cell viability. At empty nanoemulsion concentrations up to 180 μg mL−1 there was minimal loss of cell viability, however, when the concentration exceeded 180 μg mL−1 there was a sharp and progressive decrease in cell viability with a calculated IC50 of 257 μg mL−1 and complete loss of cell viability at 1 mg mL−1. Exposing the Caco-2 cell layers to the surfactant–ethanol mixture used to create the triglyceride nanoemulsion lead to a similar cell viability concentration dependence. There was minimal loss of cell viability up to 100 μg mL−1, then a dramatic decrease in cell viability above 100 μg mL−1 with a calculated IC50 of 192 μg mL−1 and complete loss of cell viability above 200 μg mL−1. By comparison, incorporation of β-carotene into the triglyceride nanoemulsion caused a considerable decrease in the limit of exposure of cell viability. The concentration dependence of β-carotene containing nanoemulsions on cell viability shifted to significantly lower concentrations with cell death occurring from 30 μg mL−1 producing an of IC50 51 μg mL−1 and complete loss of cell viability at ∼100 μg mL−1.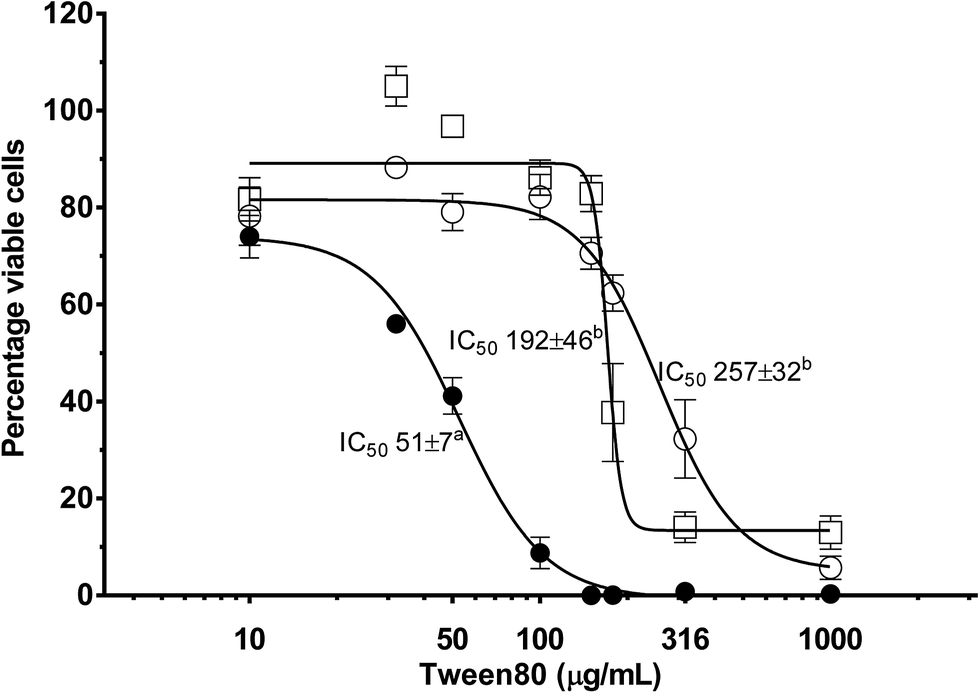 | ||
| Fig. 7 Effect of β-carotene containing nanoemulsions on Caco-2 cell viability determined in vitro using CellTiter 96® AQueous Non-Radioactive Cell Proliferation Assay. Cells were grown for 21 days on 96 well plates prior to overnight (14–16 hours) treatment with β-carotene containing nanoemulsions (●), unlabelled nanoemulsions (○) and Tween 80 (□) diluted in Hank's balanced salt solution (HBSS). Data is expressed as the mean percentage viable cells compared to HBSS control ± standard error, from three independent experiments performed in triplicate (n = 9). IC50 values were calculated from percentage inhibition using GraphPad Prism 6 (using variable slope response curves (four parameters)) and expressed as mean IC50 (of three experiments, n = 3) ± standard error. a,bSuperscripted letters show significant differences (p < 0.05) between IC50 values using unpaired t tests. | ||
It is apparent from Fig. 7 that incorporation of β-carotene into edible LCT nanoemulsions considerably increases their toxicity. Such a result confounds some recent research by Everett et al. who found that the incorporation of β-carotene into microemulsions did not have a significant impact on the concentration dependant viability of Caco-2 cell layers.67 However, our results match those of Hurst et al. and multiple cohort studies on the conflicting benefits of β-carotene supplementation in smoking and non-smoking populations. Several studies have proposed,50,51,68 and then demonstrated,69–71 that oxidised β-carotene leads to an increased incidence of ROS induced cell damage. Autoxidation of β-carotene is a free-radical propagation process which results in the formation of numerous (short chain) carotenoid derived aldehyde (CDA) breakdown products. The aldehydes produced from carotenoid autoxidation interact with enzymes and proteins and are acutely toxic to mammalian cells, reducing mitochondrial function, oxidising DNA in fibroblasts and promoting cell apoptosis.72–77 These studies have shown that concentrations of CDA in the range of 10–20 μM are toxic to a range of human cells lines including K562, RPE 28 SV4 and ARPE-19 cell lines.69–71 The findings of Hurst et al. suggest that in our current study, oxidation of β-carotene to produce CDA is increasing nanoemulsion cytotoxicity upon carotene incorporation.
4 Biological fate of edible nanoemulsions
In this study we aimed to assess whether edible nanoemulsions pose an increased risk to human health compared to normal emulsions. The main premise/concern was that nanoparticles can be absorbed directly by intestinal cells, and hence result in bioaccumulation and/or toxicity because the nanoparticles are able to alter/bypass the normal absorptive routes. A sequential approach was taken first examining the digestion of nanoemulsions, next their direct absorption and toxicity was measured followed by determining the toxicity of nanoemulsions containing reactive nutrients/APIs.The first line of human defence against dangerous foods or materials is the digestive system; if molecules or structures are not immediately rejected by the taste system, then enzymatic degradation has the potential to reduce harm. For lipid emulsions digestion commences within the stomach by acid stable gastric lipase (10–30% of lipid FAs undergo hydrolysis) and is completed by the action of co-lipase dependant pancreatic lipase and other lipases present in the intestine.78 Our in vitro digestion results using a validated gastric lipase mimic indicate that Tween 80 based edible nanoemulsions are: (i) indigestible during gastric lipolysis; and (ii) undergo rapid and complete intestinal lipolysis. A lack of digestion by gastric lipase is a concern because FAs produced during digestion within the stomach regulate the amount of gastric emptying via cholecystokinin mediated neurohormonal feedback pathway. A lack of initial regulation of gastric emptying has been shown to swamp the duodenum with concentrated emulsion,79 potentially creating a scenario where there is direct nanoemulsion absorption. However, our in vitro results also demonstrated that pancreatic lipase rapidly digests edible nanoemulsions once they reach the small intestine compartment, potentially limiting their degree of cellular uptake.
Experiments on the cytotoxicity of edible nanoemulsions revealed a strong inverse dependence between droplet size and cytotoxicity. The 45 nm nanoemulsions required much higher doses to impact cell viability compared to larger nanoemulsions and conventionally sized emulsions. Increased cytotoxicity was found to be a synergistic interaction between ethanol and Tween 80 surfactant. This appears to be the first report of ethanol increasing polyoxyethylene (PEO) surfactant (i.e. Tween 80) cytotoxicity even though this combination is commonly used as solubilisation enhancers in pharmaceutical microemulsion formulations such as SNEDDS (Self NanoEmulsifying Drug Delivery System).80 As for the mechanism, since ethanol readily diffuses into the epithelial cells of the digestive tract, it is unlikely that Tween 80 is increasing the potency of ethanol.38,39,81 Instead, it is likely that ethanol is increasing the potency of Tween 80. The mechanisms via which Tween 80 (and other non-ionic surfactants) impact cell viability vary depending on surfactant concentration.35 At low concentrations Tween 80 monomers are thought to be able to be incorporated into the cell lipid bilayer, changing its physical properties.35,65 As Tween 80 concentration increases above the critical micelle concentration (CMC), surfactant micelles act to solubilise lipid membrane components disrupting its integrity.35 Studies by Anderberg et al. have shown that the IC50 for Tween 80 shows a strong time dependence, being >34 mM after 10 minutes and 0.69 mM after 24 hours.65 In contrast the IC50 of anionic surfactants and bile salts were not different after 10 minutes or 24 hours exposure, suggesting that permeation of Tween 80 into the cell might be a rate limiting step.65 Given that the range of IC50 observed in our current study (0.19 to 3.8 mM)‡ is within the range of the IC50 observed by Anderberg et al. after 24 hours, it would suggest that ethanol enhances Tween 80 permeation. This suggests that the surfactant/alcohol synergy that facilitates nanoemulsion formation potentially increases nanoemulsion cytotoxicity if the surfactant is in sufficient excess.
It is clear that undigested nanoemulsions are incorporated into Caco-2 cell layers to a considerable extent, and that a modest amount can even be found in the basolateral layer suggesting (active) transport. The question is “what is the mechanism that drives this process”? The clear cytotoxic effects of the Tween 80/ethanol combination (which can lead to considerable disruption of the cell layer) might suggest paracellular transport facilitated by TJs/AJs breakdown. However, TEER measurements of Caco-2 cell layers exposed to nanoemulsions between 45 and 200 nm indicate no significant breakdown compared to the HBSS control. Confocal microscopy using triple staining elegantly showed extensive uptake of various sized nanoemulsions via a transcellular route with most imaged cells showing multiple emulsion inclusions. Our preliminary transport studies also revealed that nanoemulsion uptake increased as nanoemulsion size increased from 45 to 120 nm, decreasing moderately as nanoemulsion size increased above 120 nm. These results suggest an optimum in nanoemulsion cellular uptake, which is possibly influenced by droplet size and/or composition. Similar relationships between the extent of cellular uptake and nanoemulsion size have been observed in other studies, with optimum size also being around 100 nm.25 It has been proposed that the size-dependent uptake of nanoparticles is likely related to the membrane-wrapping process.82 Transcellular nanoparticle uptake is thought to occur via endocytosis – the efficiency of which is related to nanoparticle ligand density and cell receptor density. Thermodynamically, the optimum for spherical nanoparticles is 50 nm, however multiple studies have found optimums around 100 nm, possibly due to a different ligand/reception density balance or a balance between clathrin dependant and clathrin independent endocytosis pathways.
A limitation of our current study is that we did not probe the mechanistics of cellular uptake, although confocal microscopy and epithelial TEER measurements indicate that edible nanoemulsion uptake occurs largely via transcellular routes. There have been extensive studies into the mechanisms of transcellular uptake of synthetic nanoparticles which provide key insights.14,16–21 Transcellular nanoparticle uptake has extensively been found to follow multiple endocytosis pathways occurring mainly by: (i) clathrin-mediated endocytosis; and (ii) caveolae-lipid raft dependant endocytosis.20–26 Both caveolae (50–80 nm) and clathrin (100–200) mediated endocytosis occur via the formation of membrane pits which bud into the cell to create (coated) vesicles that internalise nutrients and nanoparticles present in the luminal fluid.27,28 In the current case of PEO surfactant stabilised (Tween 80) edible nanoemulsions evidence from the absorption of PEO surfactant micelles suggests uptake via a mixture of caveolae and clathrin mediated pathways.21,22 Studies by Sahay et al. have found that monomers of PEO based surfactants appear to enter cells via caveolae-mediated endocytosis.21 However, as surfactant concentration increases above the CMC excess surfactant block caveolae-endocytosis and Sahay et al. found that micelle uptake occurred via clathrin mediated endocytosis.21 Similarly, Gigout et al. found that PEO surfactant micelles (pluronic PF68) undergo cell internalisation via endocytosis pathways in CHO cells and chondrocytes.19 Combined these results support our observations that PEO surfactant stabilised nanoemulsions are internalised by Caco-2 intestinal cell layer via endocytotic pathways, potentially favouring the clathrin pathway.
The greatest interest in creating stable edible nanoemulsions is their potential to enhance (cellular) uptake of poorly soluble APIs/nutrients. A question that comes with enhanced absorption is does enhance API or nutrient absorption have any consequences for the cell? In the current study cytotoxicity of edible nanoemulsions containing β-carotene (IC50 = 51 μg mL−1) was much higher than empty edible nanoemulsions (IC50 = 257 μg mL−1), or the surfactant mixture used in their preparation (IC50 = 192 μg mL−1). These results contrast the recent work of Everett et al. who found that the incorporation of β-carotene into microemulsions did not increase cytotoxicity over that of the surfactants themselves.83 However, our results are in line with the findings of two large cohort studies that found increased cancer rates in smokers and asbestos workers receiving high doses of β-carotene,48,49 which was later proposed to be linked to the toxicity of the oxidation products of β-carotene.47,50,51 Importantly, the four fold increase in nanoemulsion toxicity in the presence of β-carotene is dramatic and suggests that the presence of a nutrient or API can considerably increase the toxicity of a nanostructured delivery vehicle. These are of course rather preliminary findings with a nutrient prone to development of ROS promoting degradation products. It remains to be seen if such phenomena will be observed with other nutrients or APIs and whether their oxidation during manufacture and storage is of concern.
5 Summary and conclusions
In this study we sought to understand the biological fate of edible nanoemulsions in order to assess if they, or the active ingredients they carry, pose an increased risk to human health. In vitro digestion studies revealed that edible nanoemulsions stabilised by PEO based surfactants were indigestible by gastric lipase, but readily underwent digestion by pancreatic lipase. Caco-2 transport studies and confocal microscopy studies indicate that nanoemulsions are readily incorporated into, and transported through, confluent intestinal cell layers demonstrating that direct absorption of nanoemulsions might be possible in vivo. Confocal and cell membrane integrity studies suggests intracellular rather than paracellular nanoemulsion uptake, possibly via (clathrin mediated) endocytosis. Interestingly the cytotoxicity of edible nanoemulsions revealed a strong inverse dependence between droplet size and cytotoxicity. The 45 nm nanoemulsions required much higher doses to impact cell viability compared to larger nanoemulsions and conventionally sized emulsions. Increased cytotoxicity was found to be a synergistic interaction between ethanol and Tween 80 surfactant. These observations highlight that cytotoxicity arises from surfactant present in the continuous phase of the nanoemulsion and occurs via incorporation into/disruption of the cell membrane by the Tween 80, which is facilitated by the presence of ethanol. The most critical finding of this work was that incorporation of a reactive ingredient (β-carotene) into the edible nanoemulsion lead to a five-fold increase in NE toxicity. The increased toxicity of edible β-carotene nanoemulsions likely arises from the formation of ROS species during oxidation/metabolism of β-carotene. Overall we have found that whilst the formation of edible nanoemulsions does increase cellular uptake, they do not increase cellular toxicity per se. In fact, edible nanoemulsions have much lower toxicity compared to conventional emulsions with the same formulation due to lower amounts of surfactant in solution. However, the most dramatic result was that the presence of a lipophilic nutrient (β-carotene) considerably increased the toxicity of a nanostructured delivery vehicle. These results are important not only because they create new opportunities for edible nanoemulsions in consumer products, but also because they may help to inform public policy decisions on nanotechnology in food, which is a highly emotive topic.Conflicts of interest
The authors declare no conflict of interest.Acknowledgements
The authors wish to thank the DPIV Our Rural Landscape and the CSIRO Food Futures Flagship initiatives for financial support of this work. We would also like to thank Sukhdeep Bhail and Mi Xu for technical assistance with nanoemulsion preparation and fluorescence studies. Finally we would like to thank Mark Webber for technical support.References
- T. G. Mason, J. N. Wilking, K. Meleson, C. B. Chang and S. M. Graves, J. Phys.: Condens. Matter, 2006, 18, R635–R666 CrossRef CAS.
- O. Sonneville-Aubrun, J. T. Simonnet and F. L'Alloret, Adv. Colloid Interface Sci., 2004, 108–109, 145–149 CrossRef CAS PubMed.
- G. J. Nohynek, J. Lademann, C. Ribaud and M. S. Roberts, Crit. Rev. Toxicol., 2007, 37, 251–277 CrossRef CAS PubMed.
- C. Solans, P. Izquierdo, J. Nolla, N. Azemar and M. J. Garcia-Celma, Curr. Opin. Colloid Interface Sci., 2005, 10, 102–110 CrossRef CAS.
- D. J. McClements and J. Rao, Crit. Rev. Food Sci. Nutr., 2011, 51, 285–330 CrossRef CAS PubMed.
- J. N. Wilking, C. B. Chang, M. M. Fryd, L. Porcar and T. G. Mason, Langmuir, 2011, 27, 5204–5210 CrossRef CAS PubMed.
- J. N. Wilking and T. G. Mason, Phys. Rev. E: Stat., Nonlinear, Soft Matter Phys., 2007, 75, 041407 CrossRef PubMed.
- C. J. H. Porter, N. L. Trevaskis and W. N. Charman, Nat. Rev. Drug Discovery, 2007, 6, 231–248 CrossRef CAS PubMed.
- F. Kesisoglou, S. Panmai and Y. Wu, Adv. Drug Delivery Rev., 2007, 59, 631–644 CrossRef CAS PubMed.
- R. H. Muller and C. M. Keck, J. Biotechnol., 2004, 113, 151–170 CrossRef CAS PubMed.
- B. E. Rabinow, Nat. Rev. Drug Discovery, 2004, 3, 785–796 CrossRef CAS PubMed.
- V. P. Torchilin, Pharm. Res., 2007, 24, 1–16 CAS.
- A. R. Neves, J. F. Queiroz, S. A. Costa Lima, F. Figueiredo, R. Fernandes and S. Reis, J. Colloid Interface Sci., 2016, 463, 258–265 CrossRef CAS PubMed.
- X. Hu, W. Fan, Z. Yu, Y. Lu, J. Qi, J. Zhang, X. Dong, W. Zhao and W. Wu, Nanoscale, 2016, 8, 7024–7035 RSC.
- S. Doktorovova, E. B. Souto and A. M. Silva, Eur. J. Pharm. Biopharm., 2014, 87, 1–18 CrossRef CAS PubMed.
- A. M. Bannunah, D. Vllasaliu, J. Lord and S. Stolnik, Mol. Pharm., 2014, 11, 4363–4373 CrossRef CAS PubMed.
- G. Miller and R. Senjen, Out of the laboratory and onto our plates: Nanotechnology in Food and Agriculture, Friends of the Earth, Australia, 2008 Search PubMed.
- I. Illuminato, Tiny Ingredients BIGS RISKS: Nanomaterials rapidly entering food and farming, Friends of the Earth, USA, 2014 Search PubMed.
- A. Gigout, M. D. Buschmann and M. Jolicoeur, Biotechnol. Bioeng., 2008, 100, 975–987 CrossRef CAS PubMed.
- B. He, Z. Jia, W. Du, C. Yu, Y. Fan, W. Dai, L. Yuan, H. Zhang, X. Wang, J. Wang, X. Zhang and Q. Zhang, Biomaterials, 2013, 34, 4309–4326 CrossRef CAS PubMed.
- G. Sahay, E. V. Batrakova and A. V. Kabanov, Bioconjugate Chem., 2008, 19, 2023–2029 CrossRef CAS PubMed.
- G. Sahay, D. Y. Alakhova and A. V. Kabanov, J. Controlled Release, 2010, 145, 182–195 CrossRef CAS PubMed.
- A. Albanese, P. S. Tang and W. C. W. Chan, Annu. Rev. Biomed. Eng., 2012, 14, 1–16 CrossRef CAS PubMed.
- S. Zhang, J. Li, G. Lykotrafitis, G. Bao and S. Suresh, Adv. Mater., 2009, 21, 419–424 CrossRef CAS PubMed.
- A. Xu, M. Yao, G. Xu, J. Ying, W. Ma, B. Li and Y. Jin, Int. J. Nanomed., 2012, 7, 3547–3554 CAS.
- N. Hussain, V. Jaitley and A. T. Florence, Adv. Drug Delivery Rev., 2001, 50, 107–142 CrossRef CAS PubMed.
- L. Pelkmans and A. Helenius, Traffic, 2002, 3, 311–320 CrossRef CAS PubMed.
- P. Lajoie, I. R. Nabi and R. V. Stan, J. Cell. Mol. Med., 2007, 11, 644–653 CrossRef CAS PubMed.
- C. D. Walkey, J. B. Olsen, H. Guo, A. Emili and W. C. Chan, J. Am. Chem. Soc., 2012, 134, 2139–2147 CrossRef CAS PubMed.
- S. J. Klaine, P. J. J. Alvarez, G. E. Batley, T. F. Fernandes, R. D. Handy, D. Y. Lyon, S. Mahendra, M. J. McLaughlin and J. R. Lead, Environ. Toxicol. Chem., 2008, 27, 1825–1851 CrossRef CAS PubMed.
- A. Weir, P. Westerhoff, L. Fabricius, K. Hristovski and N. von Goetz, Environ. Sci. Technol., 2012, 46, 2242–2250 CrossRef CAS PubMed.
- B. Chassaing, O. Koren, J. K. Goodrich, A. C. Poole, S. Srinivasan, R. E. Ley and A. T. Gewirtz, Nature, 2015, 519, 92–96 CrossRef CAS PubMed.
- Z. Ujhelyi, F. Fenyvesi, J. Varadi, P. Feher, T. Kiss, S. Veszelka, M. Deli, M. Vecsernyes and I. Bacskay, Eur. J. Pharm. Sci., 2012, 47, 564–573 CrossRef CAS PubMed.
- R. H. Muller, D. Ruhl, S. Runge, K. Schulze-Forster and W. Mehnert, Pharm. Res., 1997, 14, 458–462 CrossRef CAS.
- D. Dimitrijevic, A. J. Shaw and A. T. Florence, J. Pharm. Pharmacol., 2000, 52, 157–162 CrossRef CAS PubMed.
- S. M. Fischer, M. Brandl and G. Fricker, Eur. J. Pharm. Biopharm., 2011, 79, 416–422 CrossRef CAS PubMed.
- C. W. How, A. Rasedee and R. Abbasalipourkabir, IEEE Trans. Nanobiosci., 2013, 12, 72–78 CrossRef PubMed.
- A. Banan, S. Choudhary, Y. Zhang, J. Z. Fields and A. Keshavarzian, J. Pharmacol. Exp. Ther., 1999, 291, 1075–1085 CAS.
- E. E. Elamin, A. A. Masclee, J. Dekker and D. M. Jonkers, Nutr. Rev., 2013, 71, 483–499 CrossRef PubMed.
- K. Tabatt, M. Sameti, C. Olbrich, R. H. Muller and C.-M. Lehr, Eur. J. Pharm. Biopharm., 2004, 57, 155–162 CrossRef CAS PubMed.
- C. Erni, C. Suard, S. Freitas, D. Dreher, H. P. Merkle and E. Walter, Biomaterials, 2002, 23, 4667–4676 CrossRef CAS PubMed.
- D. G. Deavall, E. A. Martin, J. M. Horner and R. Roberts, J. Toxicol., 2012, 2012, 645460 Search PubMed.
- S. Onoue, K. Kawamura, N. Igarashi, Y. Zhou, M. Fujikawa, H. Yamada, Y. Tsuda, Y. Seto and S. Yamada, J. Pharm. Biomed. Anal., 2008, 47, 967–972 CrossRef CAS PubMed.
- D. B. Sawyer, X. Peng, B. Chen, L. Pentassuglia and C. C. Lim, Prog. Cardiovasc. Dis., 2010, 53, 105–113 CrossRef CAS PubMed.
- T. J. Wooster, M. Golding and P. Sanguansri, Langmuir, 2008, 24, 12758–12765 CrossRef CAS PubMed.
- T. J. Wooster, D. Labbett, P. Sanguansri and H. Andrews, Soft Matter, 2016, 12, 1425–1435 RSC.
- C. H. Halsted, Am. J. Clin. Nutr., 2003, 77, 1001S–1007S CAS.
- O. P. Heinonen and D. Albanes, N. Engl. J. Med., 1994, 330, 1029–1035 CrossRef PubMed.
- G. S. Omenn, G. E. Goodman, M. D. Thornquist, J. Balmes, M. R. Cullen, A. Glass, J. P. Keogh, F. L. Meyskens, Jr, B. Valanis, J. H. Williams, Jr, S. Barnhart, M. G. Cherniack, C. A. Brodkin and S. Hammar, J. Natl. Cancer Inst., 1996, 88, 1550–1559 CrossRef CAS PubMed.
- D. V. Crabtree and A. J. Adler, Med. Hypotheses, 1997, 48, 183–187 CrossRef CAS PubMed.
- S. T. Mayne, D. T. Janerich, P. Greenwald, S. Chorost, C. Tucci, M. B. Zaman, M. R. Melamed, M. Kiely and M. F. McKneally, J. Natl. Cancer Inst., 1994, 86, 33–38 CrossRef CAS PubMed.
- D. E. Koppel, J. Chem. Phys., 1972, 57, 4814 CrossRef CAS.
- S. W. Provencher, Comput. Phys. Commun., 1982, 27, 229–242 CrossRef.
- P. J. Sassene, M. Fanø, H. Mu, T. Rades, S. Aquistapace, B. Schmitt, C. Cruz-Hernandez, T. J. Wooster and A. Müllertz, Food Funct., 2016, 7, 3989–3998 CAS.
- M. Golding, T. J. Wooster, L. Day, M. Xu, L. Lundin, J. Keogh and P. Clifton, Soft Matter, 2011, 7, 3513–3523 RSC.
- F. Destaillats and C. Cruz-Hernandez, J. Chromatogr. A, 2007, 1169, 175–178 CrossRef CAS PubMed.
- W. F. D. Bennett, A. W. Chen, S. Donnini, G. Groenhof and D. P. Tieleman, Can. J. Chem., 2013, 91, 839–846 CrossRef CAS.
- S. Tavelin, J. Gråsjö, J. Taipalensuu, G. Ocklind and P. Artursson, in Epithelial Cell Culture Protocols, ed. C. Wise, Humana Press, Totowa, NJ, 2002, pp. 233–272 Search PubMed.
- S. Schultz, G. Wagner, K. Urban and J. Ulrich, Chem. Eng. Technol., 2004, 27, 361–368 CrossRef CAS.
- P. Capolino, C. Guerin, J. Paume, J. Giallo, J.-M. Ballester, J.-F. Cavalier and F. Carriere, Food Dig., 2011, 2, 43–51 CrossRef CAS.
- F. Carriere, J. A. Barrowman, R. Verger and R. Laugier, Gastroenterology, 1993, 105, 876–888 CrossRef CAS.
- E. Levy, R. Goldstein, S. Freier and E. Shafrir, Biochim. Biophys. Acta, Lipids Lipid Metab., 1981, 664, 316–326 CrossRef CAS.
- A. Banan, G. S. Smith, E. R. Kokoska and T. A. Miller, J. Surg. Res., 2000, 88, 104–113 CrossRef CAS PubMed.
- A. Banan, G. S. Smith, C. L. Rieckenberg, E. R. Kokoska and T. A. Miller, Am. J. Physiol.: Gastrointest. Liver Physiol., 1998, 274, G111–G121 CAS.
- E. K. Anderberg, C. Nystroem and P. Artursson, J. Pharm. Sci., 1992, 81, 879–887 CrossRef CAS PubMed.
- A. Kogan, E. Kesselman, D. Danino, A. Aserin and N. Garti, Colloids Surf., B, 2008, 66, 1–12 CrossRef CAS PubMed.
- S. Roohinejad, D. Middendorf, D. J. Burritt, U. Bindrich, D. W. Everett and I. Oey, Food Res. Int., 2014, 66, 469–477 CrossRef CAS.
- S. T. Mayne, FASEB J., 1996, 10, 690–700 CAS.
- J. S. Hurst, M. K. Saini, G. F. Jin, Y. C. Awasthi and F. J. van Kuijk, Exp. Eye Res., 2005, 81, 239–243 CrossRef CAS PubMed.
- N. M. Kalariya, K. V. Ramana, S. K. Srivastava and F. J. G. M. van Kuijk, Curr. Eye Res., 2009, 34, 737–747 CrossRef CAS PubMed.
- P. M. Eckl, A. Alija, N. Bresgen, E. Bojaxhi, C. Vogl, G. Martano, H. Stutz, S. Knasmueller, F. Ferk, W. C. Siems, C.-D. Langhans and O. Sommerburg, Oxid. Stress Dis., 2013, 33, 151–169 CAS.
- H. Mo and C. E. Elson, J. Nutr., 1999, 129, 804–813 CAS.
- E. Nara, H. Hayashi, M. Kotake, K. Miyashita and A. Nagao, Nutr. Cancer, 2001, 39, 273–283 CrossRef CAS PubMed.
- W. Siems, O. Sommerburg, L. Schild, W. Augustin, C.-D. Langhans and I. Wiswedel, FASEB J., 2002, 16, 1289–1291 CAS.
- W. G. Siems, S. J. Harner and F. J. G. M. Van Kuijk, Free Radical Biol. Med., 1996, 20, 215–223 CrossRef CAS PubMed.
- K. Uchida and E. R. Stadtman, Proc. Natl. Acad. Sci. U. S. A., 1992, 89, 4544–4548 CrossRef CAS.
- S.-L. Yeh and M.-L. Hu, Free Radical Res., 2001, 35, 203–213 CrossRef CAS PubMed.
- M. C. Carey, D. M. Small and C. M. Bliss, Annu. Rev. Physiol., 1983, 45, 651–677 CrossRef CAS PubMed.
- A. Steingoetter, T. Radovic, S. Buetikofer, J. Curcic, D. Menne, M. Fried, W. Schwizer and T. J. Wooster, Am. J. Clin. Nutr., 2015, 101, 714–724 CrossRef CAS PubMed.
- F. S. Nielsen, K. B. Petersen and A. Muellertz, Eur. J. Pharm. Biopharm., 2008, 69, 553–562 CrossRef CAS PubMed.
- A. Banan, A. Keshavarzian, L. Zhang, M. Shaikh, C. B. Forsyth, Y. Tang and J. Z. Fields, Alcohol, 2007, 41, 447–460 CrossRef CAS PubMed.
- D. Albanes, O. P. Heinone, P. R. Taylor, J. Virtamo, B. K. Edwards, M. Rautalahti, A. M. Hartman, J. Palmgren, L. S. Freedman, J. Haapakoski, M. J. Barrett, P. Pietinen, N. Malila, E. Tala, K. Liippo, E.-R. Salomaa, J. A. Tangrea, L. Teppo, F. B. Askin, E. Taskinen, Y. Erozan, P. Greenwald and J. K. Huttunen, J. Natl. Cancer Inst., 1996, 88, 1560–1570 CrossRef CAS PubMed.
- S. Roohinejad, D. Middendorf, D. J. Burritt, U. Bindrich, D. W. Everett and I. Oey, Food Res. Int., 2014, 66, 469–477 CrossRef CAS.
Footnotes |
| † Electronic supplementary information (ESI) available. See DOI: 10.1039/c7ra07804h |
| ‡ 0.19 mM refers to 380 nm nanoemulsion whilst 3.8 mM is the Tween 80/ethanol mixture alone. |
| This journal is © The Royal Society of Chemistry 2017 |