 Open Access Article
Creative Commons Attribution 3.0 Unported Licence
Scalable synthesis of carbon stabilized SiO/graphite sheets composite as anode for high-performance Li ion batteries†
Qianliang Zhang,
Ning Lin *,
Tianjun Xu,
Kangze Shen,
Tieqiang Li,
Ying Han,
Jie Zhou and
Yitai Qian
Department of Chemistry, University of Science and Technology of China, Hefei, Anhui Province 230026, P. R. China. E-mail: ningl@mail.ustc.edu.cn
First published on 15th August 2017
Abstract
Mixing Si-based materials with graphite has attracted attention as a feasible alternative anode for practical application in high-energy Li-ion batteries. In this study, amorphous carbon coated SiO/graphite composites (SGCs) are fabricated through in situ polymerization of aniline and followed by annealing treatment, which is simple and scalable. The in situ generated polyaniline serves as a “glue” to stabilize the SiO particles and graphite sheets, thus constructing well-distributed and stable structure. After annealing, the polyaniline-derived carbon layer and graphite could synergistically buffer the volume change of SiO, and form a conductive network. The effect of the weight ratio of SiO and graphite on the overall electrochemical performance is also studied. As a result, the optimized SGC-5 anode (weight ratio: SiO/graphite = 1/5) exhibits the best electrochemical performance, such as a reversible capacity over 540 mA h g−1 at 0.2C, long-term cycling stability with a capacity of 440 mA h g−1 at 0.8C after 500 cycles, and good rate capability. Additionally, the structural change and fading mechanism of these electrodes during cycling are also investigated.
Introduction
Rechargeable lithium-ion batteries (LIBs) are widely used as power supplies for mobile electronic devices and electric vehicles.1,2 Graphite based anodes have been used for over ten years due to their stable cycling performance and low working potential. However, the commercial graphite product has reached its theoretical capacity limit (372 mA h g−1), which is unable to meet the continuing demand for high energy density LIBs.3,4 Recently, Si based materials have been considered as promising anodes due to the high theoretical specific capacity (3572 mA h g−1) and low working potentials (<0.5 V versus Li/Li+).5,6 The main challenge facing Si anode is the drastic volume change (>300%) during Li alloying/de-alloying process, resulting in unstable solid electrolyte interface (SEI) films and fast capacity fading upon cycling.7,8As an alternative anode material, silicon suboxide (SiO) with a specific capacity of 2043 mA h g−1 has attracted special attention, because the SiO suffers from a lower volume variation (∼200%) than that of crystallized Si anode (>300%).9 Besides, the Li-oxide (Li2O) and Li-silicate (Li4SiO4), generated by the reaction of Li-ion with SiOx, would act as buffer components to accommodate volume changes caused by further alloying of Si with Li, thus leading to an improved cyclic performance.10 For example, ball-milled SiO particles delivered a reversible capacity of 1184.8 mA h g−1 at 0.3 A g−1 after 100 cycles.11 However, the naked SiO anode still suffers from inevitable volume variation, poor electrical conductivity, and irreversible side reactions with electrolyte.
To address these issues, coating carbonaceous additives such as graphene and amorphous carbon on SiOx was demonstrated as an effective strategy. For example, Si@SiOx/C nano-composite prepared by ball-milling and in situ carbonization showed a reversible capacity of 1230 mA h g−1 after 100 cycles at 0.5 A g−1, and a capacity retention of 73% that is higher than that of Si@SiOx (23%).12 SiO/reduced graphene oxide composite prepared by simple hydrothermal process exhibited a reversible capacity of 744 mA h g−1 at 120 mA g−1 after 50 cycles.13
Recently, mixing SiO with graphite are under investigation as a feasible strategy to obtain viable high-performance anode for practical application. The obtained SiO/graphite composite could take full advantages of the high reversible capacity of SiO, and the structural stability of graphite.14–17 For instance, SiO/carbon nanofibers/graphite composite prepared by spray drying route exhibited a reversible specific capacity of approximately 615.1 mA h g−1 after 100 cycles at 0.1 A g−1.14 Direct blending 3 wt% of SiO1.06 with graphite achieved a reversible specific capacity of 397 mA h g−1 with 76% capacity retention after 200 cycles at 0.1 A g−1 in a full-cell system.15 SiO/G/CNTs composite prepared by ball milling showed a reversible capacity of 495 mA h g−1 at a current density of 0.23 A g−1, with a capacity retention of 62.7%.16 Despite advances made for preparing SiO/graphite anode composite, the proposed synthetic methods are limited, which hampered their extensive applications. Therefore, it is significant to design novel fabricating route to design rational SiO/graphite based anode materials.
In this work, a series of amorphous carbon coated SiO/graphite ternary composite (SGCs) anode materials were prepared through a controllable and scalable procedure including in situ polymerization and post heating treatment, as exhibited in Fig. 1. The in situ generated polyaniline would simultaneously coat on SiO particles and graphite sheets, producing stabilized and well-distributed structure. Accordingly, the carbon and graphite would synergistically accommodate the volume variation of SiO, suppress the side reactions with electrolyte, and construct three-dimensional conductive network, thus facilitating the formation of stable SEI film, ionic/electronic conductivity, and electrode integrity. Three SGC composites with different specific capacity were obtained by varying the weight ratio of graphite and SiO. After optimization, the SGC-5 (weight ratio of SiO/graphite = 1/5) composite exhibits the best electrochemical performance such as the reversible capacity over 540 mA h g−1 at 0.2C, long-term cycling stability with a capacity of 440 mA h g−1 at 0.8C even after 500 cycles with capacity retention of 84.8%, and good rate capability with a capacity retention of 32.7% even at 20C. Additionally, the morphology and resistance change during discharge/charge cycling is also investigated.
Experimental section
Materials synthesis
All the reagents used here are of analytical grade without further purification. Bulk SiO (99% purity) was placed in zirconium dioxide vials containing zirconium dioxide balls using a ball-to-powder weight ratio of 15, and was ball-milled for 600 min at a speed of 500 rpm. The commercial graphite particles were ball-milled at a speed of 300 rpm for 300 min. The ball-milled SiO and graphite sheets are collected for further application.The assembly of SiO and graphite sheets are realized by an in situ polymerization process, as shown in Fig. 1. First, the ball-milled SiO particles, graphite sheets, and aniline are dispersed in mixed solvent of distilled water/ethanol (v/v = 1/1) by ultrasonic treatment. The pH of the suspension was adjusted to 1 by adding a few drops of concentrated hydrochloric acid. After 30 min, an aqueous ammonium persulfate solution was added into above suspension slowly. The ammonium persulfate was acted as oxidant to start the in situ polymerization, generating polyaniline (PANI).20 The mixed suspension was stirred for 300 min at room temperature. Then, the resultant SiO/graphite@PANI, collected by vacuum filtration, and was annealed at 800 °C in Ar/H2 atmosphere for 300 min to produce amorphous carbon coated SiO and graphite composite. Three SiO/graphite@amorphous carbon composites were prepared by adjusting the weight ratio of SiO and graphite including 1![[thin space (1/6-em)]](https://www.rsc.org/images/entities/char_2009.gif) :
:![[thin space (1/6-em)]](https://www.rsc.org/images/entities/char_2009.gif) 1, 1
1, 1![[thin space (1/6-em)]](https://www.rsc.org/images/entities/char_2009.gif) :
:![[thin space (1/6-em)]](https://www.rsc.org/images/entities/char_2009.gif) 3, and 1
3, and 1![[thin space (1/6-em)]](https://www.rsc.org/images/entities/char_2009.gif) :
:![[thin space (1/6-em)]](https://www.rsc.org/images/entities/char_2009.gif) 5 (denoted as SGC-1, SGC-3, and SGC-5, respectively). For comparison, SiO/graphite composite was prepared by direct mixture, denoted as SG; graphite/amorphous carbon composite was prepared following above same route without adding SiO content, denoted as GC; SiO@carbon was prepared without adding graphite, denoted as SC.
5 (denoted as SGC-1, SGC-3, and SGC-5, respectively). For comparison, SiO/graphite composite was prepared by direct mixture, denoted as SG; graphite/amorphous carbon composite was prepared following above same route without adding SiO content, denoted as GC; SiO@carbon was prepared without adding graphite, denoted as SC.
Results and discussions
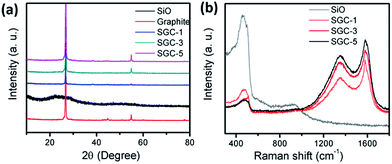
Fig. 2a shows the powder XRD patterns of the as-prepared samples. The diffraction peaks at 2θ values of 26.3, 44.3, and 54.5 degree are corresponding to the (002), (100), and (004) planes of graphitic carbon (JCPDS PDF no. 41-1478). The diffraction patterns of ball-milled SiO contains an amorphous broad peak ranging from 20 to 30 degree, which is consistent to the SC composite (Fig. S1†). In the diffraction patterns of the three SGCs samples, only the characterization peaks of graphite could be detected. Fig. 2b presents the Raman spectra of SGC-1, SGC-3, SGC-5, and SiO. The broad peaks at around 500 and 918 cm−1 are attributed to Si component in the SiO, and the peaks at 1360 cm−1 and 1580 cm−1 are assigned to D-band and G-band of carbonaceous materials. Fig. S2† shows the Raman spectrum of the SC, GC, and amorphous carbon samples. The characterization carbon bands in the spectrum of the SC sample indicates that amorphous carbon was derived from the in situ generated polyaniline layer.Fig. 3a shows the ball-milled SiO particles, the size are ranging from 100 to 500 nanometers, and the particles are tend to aggregate due to high surface energy. The ball-milled graphite particles have a flake-like morphology with a smooth surface and a particle size of 1–10 μm (Fig. 3b). Fig. 3c and d exhibit the SEM and TEM images of the as-prepared SGC-5 sample. The SiO particles and graphite sheets are all covered by PANI-derived amorphous carbon with a rough surface, no naked SiO particles can be detected. The TEM image reveals that the SiO particles and the graphite sheets are interconnected well, indicating the formation of stabilized structure. Fig. S3† shows the SEM and TEM images of the SC, GC, and derived carbon composites. The SiO or graphite can be well coated with PANI-derived carbon. Fig. S4† exhibits the SEM images of the SGC-1, SGC-3, and SG samples. As for the SG composite, the SiO particles and graphite sheets are separated clearly with a loose structure which is mainly caused by the incompatibility between the irregular particle sizes of SiO and graphite. And the SiO particles are agglomerated together seriously. The structure and morphology of the SGC-1 and SGC-3 are similar with that of the SGC-5 composite. Above all, it is concluded that the proposed in situ polymerization process is beneficial for constructing stable composite.
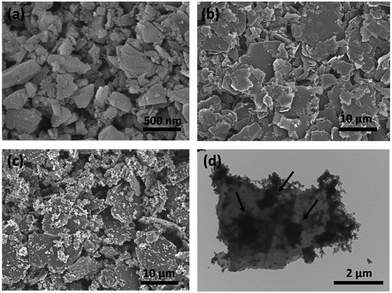 | ||
| Fig. 3 The SEM images of the ball-milled SiO (a), graphite (b), and the SGC-5 (c) products, and the TEM (d) images of the SGC-5 sample. | ||
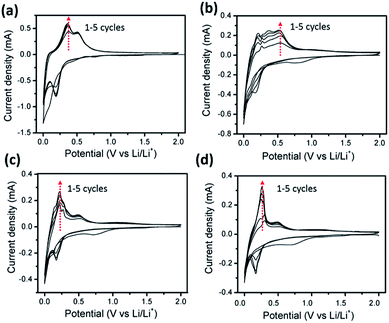
The electrochemical properties of the as-prepared samples were characterized using half cells with a Li foil as the counter electrode. Fig. 4a–d show the typical cyclic voltammetry (CV) curves of the SiO, and SGCs electrodes in the potential window of 0.01–2.0 V (vs. Li/Li+) from first to fifth cycles. The characterization peaks of SiO anode are close to that of Si materials (Fig. 4a). In the 1st cathodic part, a peak at 0.8 V is ascribed to the formation of Li2O and solid electrolyte interphase (SEI) film, which disappears in the following cycles.19 The sharp cathodic peak of first cycle located at below 0.1 V represents the alloy reaction between lithium ion and Si. In the subsequent cycles, the cathodic peak at 0.1 V is replaced gradually by the peak at around 0.2 V. The anodic part displays two predominant peak at 0.35 V and 0.51 V, which is attributed to the de-alloying reaction of Li–Si alloys. Fig. S5a† shows the CV plots of the graphite sheets electrode, the main Li-ion insertion/de-insertion peaks are located below 0.2 V. Accordingly, a group of cathodic and anodic reaction peaks in the CV curves of these SGCs electrodes are composed of the characterization peaks of both SiO and graphite. Obviously, the relative current density belonging to SiO or graphite are positively correlated with the corresponding weight ratio in these composites. Noteworthy, the gradual increase of the current density from first to fifth cycles may be caused by the activation of the electrode during cycling.18
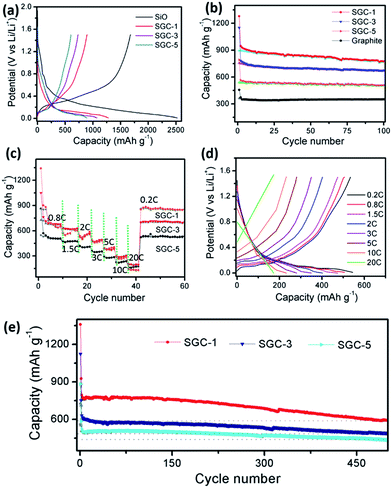
Fig. 5a shows the initial charge/discharge capacity–potential curves of the SiO and SGCs at a current density of 0.2C. The discharge and charge capacities in the first cycle are about 1280 and 893 mA h g−1 for SGC-1, 1072 and 734 mA h g−1 for SCG-3, 793 and 545 mA h g−1 for SCG-5, and 2522 and 1676 mA h g−1 for SiO. Thus, their initial coulombic efficiencies are 69.7%, 68.5%, 68%, and 66.5%, respectively. Fig. S5b† shows the capacity–potential profiles of the graphite electrode, with the first discharge and charge capacity of 425 and 350 mA h g−1, with a coulombic efficiency of 82.3%. It is noted that the SGCs show lower initial coulombic efficiency than that of graphite sheets, because the PANI-derived amorphous carbon and SiO would lead to larger surface areas and defects which would cause electrolyte decomposition, and irreversible electrochemical reactions with Li-ion.
Fig. 5b shows the cycling performance at a current density of 0.2C. The graphite, SGC-1, SGC-3, and, SGC-5 deliver the reversible capacity of 334, 774, 640, and 508 mA h g−1 at the 100 cycles, the corresponding capacity retention are 95%, 86.7%, 87.2%, and 93.2%, respectively. As a contrast, the SiO anode shows a capacity retention of as low as 12% after 100 cycles (Fig. S6†). After coating amorphous carbon, the SC anode shows an improved capacity retention of 64% (Fig. S6†). Obviously, the graphite exhibits the best cycling stability and the lowest reversible capacity, and the SiO anode shows the highest Li-ion storage capacity and the fast decaying rate. Among these SGCs anodes, the SGC-5 has the best cycling stability due to the high weight ratio of graphite sheets, and the protection of amorphous carbon layer. The coulombic efficiency of the SGCs are increased from below 70% up to 99% gradually, indicating stable SEI films formed, as shown in Fig. S7.†23
To study the rate capability, the cycling properties and the corresponding potential plateau of the obtained SGCs electrode at different current density was measured (Fig. 5c and d). The capacity retention of the SGC-5 at 0.8C, 1.5C, 2.0C, 3.0C, 5C, 10C, and 20C are 92%, 85.6%, 73%, 62.7%, 51%, 40%, and 32.7%, respectively, which is better than that of the SGC-1, and SGC-3. The reversible capacity maintains at 170 mA h g−1 even at 20C. Fig. 5d exhibits the corresponding discharge/charge voltage–capacity plots of SGC-5 electrode at different current density. Obviously, the electrode still suffers from serious polarization as the current density increased, which need to be further improved.
The long-term cycling performance of SGCs at the current density of 0.8C was evaluated, as shown in Fig. 5e. It should be mentioned first that these cells are activated at a lower current density of 0.2C for the first two cycles. The SGC-1, SGC-3, and SGC-5 deliver the specific capacity of 592, 489, and 432 mA h g−1 at 0.8C after 500 cycles, with the capacity retention of 77.4%, 80%, and 84.8%, respectively.
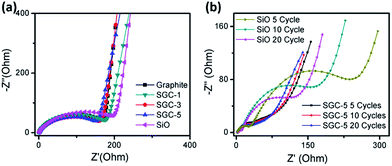
EIS measurements are conducted to further investigate the electrochemical performance. Fig. 6a shows the experimental Nyquist plots of the SGCs, graphite, and SiO electrodes before cycling. All of the Nyquist plots consist of a semicircle in the high frequency region, and a straight line in the low frequency region. The diameter of the semicircle is ascribed to the charge transfer resistance on the interface of the electrolyte and active material, while the linear region corresponds to the lithium ion diffusion in the electrodes.21 As one can see, the SiO based electrode shows slightly higher resistance than that of the SGCs and graphite based electrode, while no remarkable difference is observed among the graphite and SGCs samples. Furthermore, the SiO and SGC-5 were taken as example to study the resistance change during discharge/charge cycling. Fig. 6b shows the experimental Nyquist plots of the SGC-5 and SiO electrodes after different cycles, all measurements were taken after full relaxation. Noted, the impedance plots of cycled electrode has two depressed semicircles at the high-to-medium frequency range, and a sloped line in the low frequency region, which are corresponding to the impedance of the SEI film, charge transfer resistance, and the impedance of lithium-ions diffusion in the bulk electrode, respectively. After different cycles, the resistance of the SGC-5 are maintained stable. However, the charge transfer resistance of the SiO electrode keeps decreasing. This difference may be explained by the following aspects: the charge transfer reaction takes place on the surface of the active materials so that the direct electronic contact between the active materials and the additive/binder has great influence on the charge transfer reaction. The electrode integrity of the SGC-5 is maintained well during cycling, while the SiO based suffers from drastic volume change, resulting in unstable SEI films, and low conductive contact.22
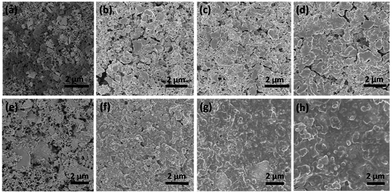
The structure and surface change of the SGC-5 and SiO electrode during discharge/charge cycling were also investigated by SEM images, as shown in Fig. 7. Before cycling, the SGC-5 composite or SiO particles are well mixed with Super-P particles and binders (Fig. 7a and e). After 5 cycles, the surface of SGC-5 electrode becomes smooth, because a layer of SEI film is formed. From 5th cycles forward, the electrode surface becomes denser, and smoother due to the formation of stable SEI film (Fig. 7f–h). As a contrast, the SiO electrode still maintained a rough surface even after 20 cycles, some cracks on the SiO electrode can be observed, (Fig. 7b–d). It is reasonable to speculate that the repeated expansion/contracting of SiO during cycling hinders the formation of stable SEI film, which is a good explanation for the EIS results. Thus, it is confirmed that the as-prepared SGCs composites shows good structural stability during charge/discharge process.
Conclusions
In summary, a series of amorphous carbon coated SiO/graphite composites (SGCs) are fabricated by an in situ polymerization and subsequent pyrolysis process. The in situ formed ployaniline could effectively binder SiO particles and graphite sheets. After annealing treatment, the polymer-derived amorphous carbon layer and graphite components could buffer the volume change of SiO during cycling, restrain the side reactions with electrolyte, and construct conductive network. As a result, the obtained SGCs exhibit good electrochemical Li-storage performance such as long life-span, and good rate capability. However, it should be mentioned that the initial coulombic efficiency of the obtained SGCs anode materials is relatively low, which need to be improved in the future works.Conflicts of interest
There are no conflicts to declare.Acknowledgements
This work is supported by the National Postdoctoral Program for Innovative Talents (No. BX201600140), China Postdoctoral Science Foundation funded project (No. 2016M600484), and the Fundamental Research Funds for the Central Universities (WK2060190078), the National Natural Science Fund of China (No. 21471142, 21521001, 21671181, 91022033, 21201158, 51602303).Notes and references
- J. B. Goodenough and Y. Kim, Chem. Mater., 2010, 22, 587–603 CrossRef CAS.
- F. Luo, B. N. Liu, J. Y. Zheng, G. Chu, K. F. Zhong, H. Li, X. J. Huang and L. Q. Chen, J. Electrochem. Soc., 2015, 162, A2509–A2528 CrossRef CAS.
- M. Chen, Z. L. Wang, A. N. Wang, W. S. Li, X. Liu, L. J. Fu and W. Huang, J. Mater. Chem. A, 2016, 4, 9865–9872 CAS.
- J. Yu, H. H. Zhan, Y. H. Wang, Z. L. I. Zhang, H. Chen, H. Li, Z. Y. Zhong and F. B. Su, J. Power Sources, 2013, 228, 112–119 CrossRef CAS.
- N. Lin, Y. Han, L. B. Wang, J. B. Zhou, J. Zhou, Y. C. Zhu and Y. T. Qian, Angew. Chem., Int. Ed., 2015, 54, 3822–3825 CrossRef CAS PubMed.
- N. Lin, Y. Han, J. Zhou, K. L. Zhang, T. J. Xu, Y. C. Zhu and Y. T. Qian, Energy Environ. Sci., 2015, 8, 3187–3191 CAS.
- M. Ko, S. Chae, J. Ma, N. Kim, H. W. Lee, Y. Cui and J. Cho, Nat. Energy, 2016, 1, 16113 CrossRef CAS.
- Q. Xu, J. Y. Li, Y. X. Yin, Y. M. Kong, Y. G. Guo and L. J. Wan, Chem.–Asian J., 2016, 1, 1205–1209 CrossRef PubMed.
- C.-H. Doh, C.-W. Park, H.-M. Shin, D.-H. Kim, Y.-D. Chung, S.-I. Moon, B.-S. Jin, H.-S. Kim and A. Veluchamy, J. Power Sources, 2008, 179, 367–370 CrossRef CAS.
- J. I. Lee, N. S. Choi and S. Park, Energy Environ. Sci., 2012, 5, 7878–7882 CAS.
- J. Y. Zhang, C. Q. Zhang, Z. Liu, J. Zheng, Y. H. Zuo, C. L. Xue, C. B. Li and B. W. Cheng, J. Power Sources, 2017, 339, 86–92 CrossRef CAS.
- D. S. Wang, M. X. Gao, H. G. Pan, J. H. Wang and Y. F. Liu, J. Power Sources, 2014, 256, 190–199 CrossRef CAS.
- X. Q. Yuan, H. X. Xin, X. Y. Qin, X. J. Li, Y. F. Liu and H. Guo, Electrochim. Acta, 2015, 155, 251–256 CrossRef CAS.
- X. H. Hou, J. Y. Wang, M. Zhang, X. Liu, Z. P. Shao, W. S. Li and S. J. Hu, RSC Adv., 2014, 4, 34615–34622 RSC.
- Y. Kobayashi, S. Seki, Y. Mita, Y. Ohno, H. Miyashiro, P. Charest, A. Guerfi and K. Zaghib, J. Power Sources, 2008, 185, 542–548 CrossRef CAS.
- Y. Ren, J. Ding, N. Yuan, S. Jia, M. Qu and Z. Yu, J. Solid State Electrochem., 2012, 16, 1453–1460 CrossRef CAS.
- J. K. Lee, W. Y. Yoon and B. K. Kim, J. Electrochem. Soc., 2013, 160, A1348–A1352 CrossRef CAS.
- N. Lin, J. B. Zhou, L. B. Wang, Y. C. Zhu and Y. T. Qian, ACS Appl. Mater. Interfaces, 2015, 7, 409–414 CAS.
- L. Zong, Y. Jin, C. Liu, B. Zhu, X. Hu, Z. Lu and J. Zhu, Nano Lett., 2016, 16, 7210–7215 CrossRef CAS PubMed.
- X. Feng, J. Yang, P. Gao, J. Wang and Y. Nuli, RSC Adv., 2012, 2, 5701–5706 RSC.
- J. Niu, S. Zhang, Y. Niu, H. H. Song, X. H. Chen, J. S. Zhou and B. Cao, J. Mater. Chem. A, 2015, 3, 19892–19900 CAS.
- J. Guo, A. Sun, X. Chen, C. Wang and A. Manivannan, Electrochim. Acta, 2011, 5, 63981–63987 Search PubMed.
- M. Ko, S. Chae, J. Ma, N. Kim, H. W. Lee, Y. Cui and J. Cho, Nat. Energy, 2016, 1, 16113–16120 CrossRef CAS.
Footnote |
| † Electronic supplementary information (ESI) available. See DOI: 10.1039/c7ra05829b |
| This journal is © The Royal Society of Chemistry 2017 |


