DOI:
10.1039/C7RA05814D
(Paper)
RSC Adv., 2017,
7, 38251-38256
Glycerol hydrogenolysis over a Pt–Ni bimetallic catalyst with hydrogen generated in situ
Received
23rd May 2017
, Accepted 12th July 2017
First published on 3rd August 2017
Abstract
Using hydrogen generated in situ from aqueous phase reforming provides an efficient and economic route for glycerol hydrogenolysis. A Pt–Ni bimetallic catalyst supported on γ-Al2O3 has been prepared to catalyze the selective hydrogenolysis of glycerol to 1,2-propanediol, with glycerol conversion reaching 71.4% in 3 h. The significant promotion of conversion and selectivity could be explained by the formation of Pt–Ni alloy based on catalyst characterization. The effects of Pt/Ni ratio, reaction temperature and reaction time on the conversion of glycerol as well as product selectivity were also investigated.
1 Introduction
With its renewability, biodegradability and carbon neutrality, biodiesel is becoming an attractive energy resource as an alternative to fossil fuels.1 The past decade has seen the rapid development of the biodiesel industry, in which a great deal of glycerol is generated as a by-product from transesterification during biodiesel production (roughly 10 wt% of the feed oil or fat), but the demand for glycerol is so limited that extensive amounts of crude glycerol are disposed of by burning, which is a waste of potential organic raw materials and releases huge amounts of CO2.2,3 Developing an economically attractive route to convert glycerol into high value-added chemicals, not only helps solve the glycerol surplus and cut down the production cost of the whole biodiesel industry, but also avoids wasting a carbon resource and diminishes the CO2 emission from burning.
Recent lots of attention has been paid to glycerol hydrogenolysis into diols such as 1,2-propanediol, 1,3-propanediol and ethylene glycol, which are widely used in the synthesis of pharmaceuticals, polymers, cosmetics, etc.4–8 However, the low solubility of molecular hydrogen in aqueous glycerol solutions requires a high hydrogen pressure to attain an acceptable conversion, which brings potential risks to industrial process and raises the production cost. D'Hondt et al. firstly reported an in situ hydrogenation route to produce 1,2-propanediol from glycerol, in which they used NaY zeolite supported Pt catalyst and achieved a glycerol conversion of 85.4% and a 1,2-propanediol selectivity of 64% at 230 °C under atmospheric conditions.9 Combining aqueous phase reforming and hydrogenolysis of glycerol (Fig. 1), the glycerol hydrogenolysis using hydrogen generated in situ no longer needs external hydrogen supply or hydrogen donor compounds, providing an efficient and economic route for glycerol hydrogenolysis.
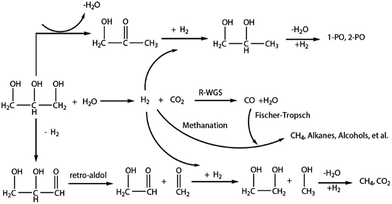 |
| | Fig. 1 The reaction network for glycerol hydrogenolysis using hydrogen generated in situ. | |
Among various noble and base metals, Pt is the most selective catalyst for aqueous phase reforming of glycerol, but has a poor catalytic activity for glycerol hydrogenolysis.10,11 The addition of second metal can strongly modify the activity and selectivity for the hydrogenolysis of glycerol.12–14 Motivated by above considerations, in this paper a series of Pt–M (M = Fe, Co, Ni, Cu, Zn, Sn) bimetallic catalysts supported on γ-Al2O3 were prepared by incipient wetness impregnation technique, wherein Pt–Ni catalyst was selected because of its high catalytic activity and selectivity in glycerol hydrogenolysis. Field emission scanning electron microscope (FESEM), energy dispersive X-ray (EDX), X-ray diffraction (XRD), transmission electron microscopy (TEM), X-ray photoelectron spectroscopy (XPS), N2-adsorption/desorption and H2-temperature programmed reduction (H2-TPR) were employed to examine the composition, structural and redox properties of the Pt–Ni catalyst. Then the effects of Pt/Ni ratio, reaction temperature and reaction time on the conversion of glycerol as well as product selectivity were investigated in detail.
2 Experimental
2.1 Catalyst preparation
Pt–M (M = Fe, Co, Ni, Cu, Zn, Sn) bimetallic catalysts were prepared by incipient wetness impregnation technique. H2PtCl6·6H2O and the nitrates of the second metal were dissolved in deionized water, then γ-Al2O3 support was added into the liquid phase and stirred till uniform. After impregnation, the sample was aged under room temperature overnight and then dried for 12 h at 100 °C, followed by calcination in air for 4 h at 550 °C. Before use, the catalyst was reduced at 500 °C for 4 h in a hydrogen flow at a steady rate of 50 mL min−1.
2.2 Catalyst characterization
The surface area and pore size were analysed by N2-adsorption/desorption technique using a Micromeritics ASAP 2020 Physisorption. Typically, 0.2 g catalyst was placed in the sample tube and pre-treated for 6 h up to 300 °C at 133 Pa to remove the moisture and impurities adsorbed on the surface, then adsorption/desorption tests were performed in liquid nitrogen at −196 °C.
The chemical composition and morphology of the samples were determined by energy dispersive X-ray (EDX) attached to field emission scanning electron microscope (FESEM, Nova NanoSEM 450).
X-Ray diffraction (XRD) patterns were obtained on a Rigaku D/max 2550 X-ray diffractometer by using the CuKα radiation (λ = 0.1544 nm) and registered in the 2θ range of 10–80° at a scan speed of 4° min−1.
The morphology of the metal nanoparticles was investigated by transmission electron microscopy (TEM) using JEOL-JEM 2100 electron microscope, operated at 200 kV. The samples were prepared using ethanol as the dispersant. An EDS analysis is attached to the TEM to determine the elemental distribution of the sample. XPS measurement was conducted by using an UIVAC-PHI 5000 Versaprobe with a monochromatic Al Kα radiation.
H2-temperature programmed reduction (H2-TPR) tests were performed with a Micromeritics AutoChemII2920 Chemisorption. A catalyst sample (50 mg) was placed in a U-shaped quartz tube and pre-heated for 2 h at 300 °C in flowing argon, followed by cooling at room temperature. After the pre-treatment, the temperature was raised from room temperature to 800 °C in a 10% H2/Ar mixture at a flow rate of 40 mL min−1, the H2 consumption was monitored with a thermal conductivity detector (TCD).
2.3 Catalyst activity tests
Glycerol hydrogenolysis reactions were carried out in a 250 mL stainless steel autoclave equipped with an electronic temperature controller and a mechanical stirrer. After loading the catalyst and glycerol into the autoclave, the reactor was purged with nitrogen at 2.0 MPa to remove air in it, then the system was pressurized with nitrogen to 1.0 MPa and heated up to the reaction temperature. The rotation speed of the stirrer was set constantly at 500 rpm throughout the reaction. At the end of the reaction, the reactor was cooled down to room temperature. The gas products were collected in a gas bag and analysed by gas chromatography equipped with a 3 m TDX-01 stainless column and a thermal conductivity detector. Liquid products were filtered to recover the solid catalyst powder and analysed by a gas chromatography equipped with a HP-INNOWAX column (30 m × 0.32 mm × 0.25 μm) and a flame ionization detector. The conversion of glycerol and product selectivity were calculated using the following equations:15
3 Results and discussion
3.1 Catalyst screening
Table 1 presents the conversion and product selectivity of glycerol hydrogenolysis at 240 °C for 3 h over Pt–M (M = Fe, Co, Ni, Cu, Zn, Sn) bimetallic catalysts. Among the six bimetallic catalysts, Pt–Ni catalyst has the highest reaction conversion of 71.4%, and gives a selectivity of 52.4% and 12.9% for 1,2-propanediol (1,2-PDO) and ethylene glycol (EG) respectively.
Table 1 Glycerol hydrogenolysis over Pt–M bimetallic catalystsa
| Catalyst |
Conversion/% |
Selectivity/% |
| 1,2-PDO |
EG |
2-Propanol |
1-Propanol |
CH4 |
CO2 |
Othersb |
| Reaction conditions: 1.0 g of catalyst, 100 mL of glycerol aqueous solution (20 wt%), 1.0 MPa of N2 pressure, 240 °C of reaction temperature, 3 h of reaction time. Others contain methanol, ethanol, acetone alcohol, etc. |
| 2.5Pt–2.5Fe |
61.3 |
55.6 |
7.5 |
5.7 |
5.6 |
0.7 |
15.5 |
9.4 |
| 2.5Pt–2.5Co |
55.6 |
54.4 |
11.7 |
6.7 |
6.8 |
0.5 |
12.8 |
7.1 |
| 2.5Pt–2.5Ni |
71.4 |
52.4 |
12.9 |
7.9 |
1.8 |
3.6 |
16.7 |
1.7 |
| 2.5Pt–2.5Cu |
18.2 |
48.4 |
9.8 |
15.9 |
3.9 |
2.4 |
14.5 |
5.1 |
| 2.5Pt–2.5Zn |
52.5 |
52.1 |
8.2 |
7.4 |
5.2 |
1.2 |
11.3 |
2.6 |
| 2.5Pt–2.5Sn |
39.1 |
60.5 |
8.6 |
7.4 |
1.2 |
0.1 |
14.5 |
5.7 |
3.2 Catalyst characterization
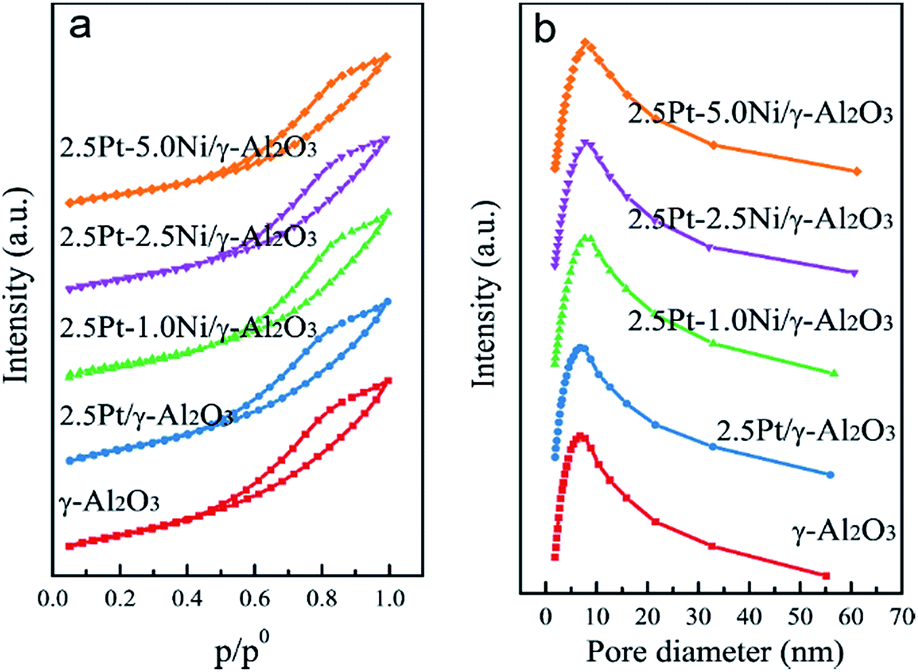
The specific surface area, pore volume and average pore diameter of the samples are summarized in Table 2. With the increment of Ni amount, the surface area and pore volume decrease due to the surface coverage and plugging of the pores by NiO.16 The N2 adsorption–desorption isotherms (Fig. 2a) reveal that all the Pt–Ni bimetallic catalysts exhibit Type V isotherms with typical H2 hysteresis loops, which are characteristic of mesoporous materials.17 The pore diameter distribution shows that higher Ni amount leads to wider pore diameter distribution (Fig. 2b).
Table 2 Specific surface area, pore volume and average pore diameter
| Catalysts |
Surface area (m2 g−1) |
Pore volume (cm3 g−1) |
Pore diameter (nm) |
| γ-Al2O3 |
235.2 |
0.47 |
8.0 |
| 2.5Pt/γ-Al2O3 |
220.3 |
0.45 |
8.0 |
| 2.5Pt–1.0Ni/γ-Al2O3 |
203.3 |
0.45 |
8.9 |
| 2.5Pt–2.5Ni/γ-Al2O3 |
200.8 |
0.42 |
8.9 |
| 2.5Pt–5.0Ni/γ-Al2O3 |
185.4 |
0.41 |
8.7 |
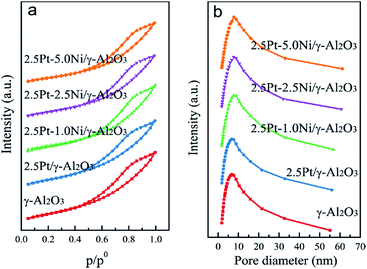 |
| | Fig. 2 N2 adsorption–desorption isotherms and pore diameter distribution. | |
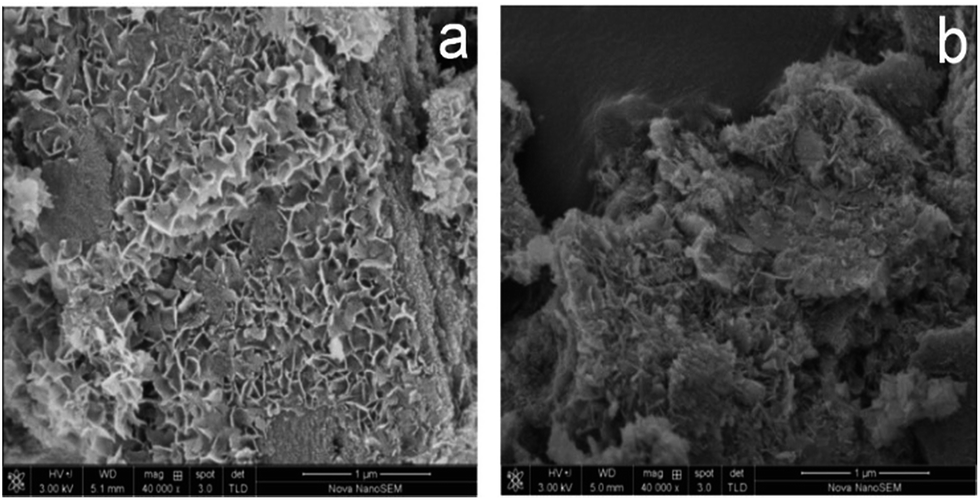
The morphological features of fresh and used Pt–Ni bimetallic catalyst were observed from FESEM analysis (Fig. 3). The fresh Pt–Ni catalyst has a high porosity and specific surface area, which offers more active sites and larger reaction zone for glycerol molecules. For the used catalyst, we found that the porous structure collapses and filamentous carbon species deposits on the surface. EDX analysis verified the formation of coke in the reaction, which leads to an increase of carbon content in the used catalyst (Fig. 4). It is also shown that the metal content on the catalyst surface rises slightly after reaction, which is explained by the agglomeration of metal particles.18 Both the coke formation and metal agglomeration contribute to deactivation of the catalyst.
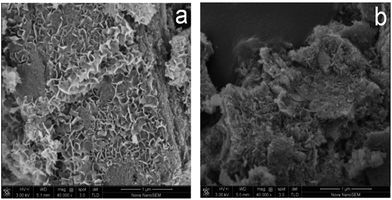 |
| | Fig. 3 FESEM images of 2.5Pt–2.5Ni/γ-Al2O3 catalyst. (a) Fresh catalyst. (b) Used catalyst. | |
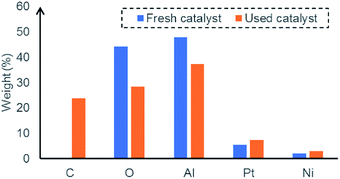 |
| | Fig. 4 EDX analysis of fresh and used 2.5Pt–2.5Ni/γ-Al2O3 catalyst. | |
XRD analyses were also conducted on unreduced and reduced catalysts. The peaks at 2θ values of 37.6°, 45.9° and 67.0° are assigned to γ-Al2O3 support. As shown in Fig. 5a, XRD did not detect any platinum or nickel species on unreduced catalysts suggesting that the fine PtO2 and NiO particles are highly dispersed. XRD patterns of reduced catalysts are presented in Fig. 5b. Metallic Pt was observed at 39.6°, 46.2° and 67.3° in reduced 2.5Pt/γ-Al2O3 catalyst, which were attributed to the crystalline phases (111), (200), and (220), respectively. The peaks show a slight shift to higher 2θ value and lower intensity with an increase of Ni content after introducing Ni into the catalyst, indicating that Ni atoms have come into the Pt lattice.19 There was no noticeable peak for Ni metals in 2.5Pt–1.0Ni/γ-Al2O3 catalyst and 2.5Pt–2.5Ni/γ-Al2O3 catalyst, which suggests a high level of Pt–Ni alloys.20 Signals of Ni were detected with 2θ values of 44.5° and 51.7 in 2.5Pt–5Ni/γ-Al2O3 catalyst, which are indexed to the (111) plane and the (200) plane of face-centred cubic (fcc) Ni.
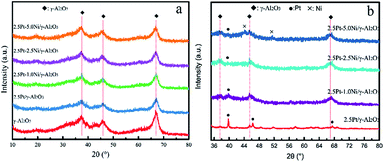 |
| | Fig. 5 XRD patterns of catalysts. (a) Unreduced catalyst. (b) Reduced catalyst. | |
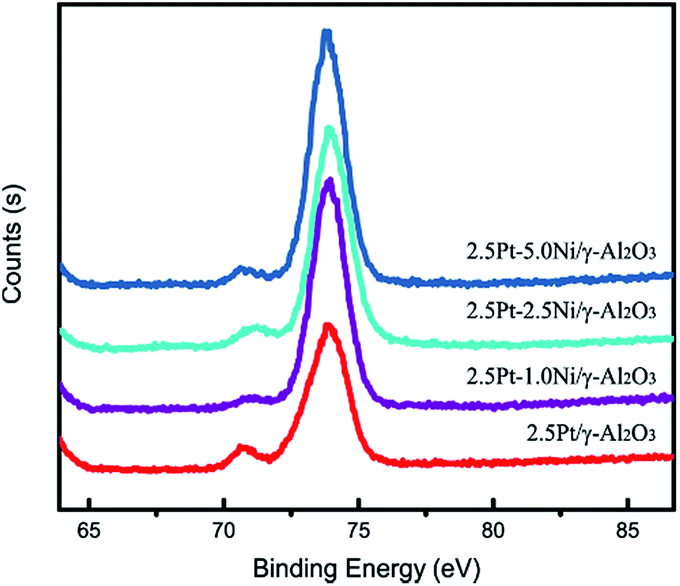
Fig. 6a presents a typical TEM image of the 2.5Pt–2.5Ni/γ-Al2O3 catalyst. As can be seen, the Pt–Ni alloy nanoparticles spread out uniformly on the surface of γ-Al2O3 support, and the average measured particle diameter is approximately 1.9 nm. EDS maps of Pt and Ni are presented in Fig. 6b and c, clearly revealing the locations of the nanoparticles. Although the two maps are not identical, there is a certain degree of correlation between the locations of Pt and Ni species. The loading amount of Pt![[thin space (1/6-em)]](https://www.rsc.org/images/entities/char_2009.gif) :Ni obtained from spectral data is 2.05 wt%:2.05 wt%. Fig. 7 shows the XPS spectra of Pt 4f in reduced catalysts. The Pt 4f7/2 has a slight negative shift due to the transfer of electrons from Ni to Pt, which lowers the density of state on the Fermi level and subsequently improves the catalytic performance.21
:Ni obtained from spectral data is 2.05 wt%:2.05 wt%. Fig. 7 shows the XPS spectra of Pt 4f in reduced catalysts. The Pt 4f7/2 has a slight negative shift due to the transfer of electrons from Ni to Pt, which lowers the density of state on the Fermi level and subsequently improves the catalytic performance.21
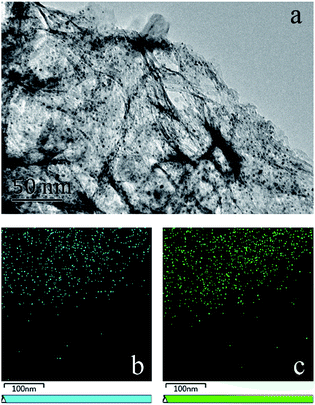 |
| | Fig. 6 (a) TEM image of 2.5Pt–2.5Ni/γ-Al2O3 catalyst. (b) EDS map of Pt. (c) EDS map of Ni. | |
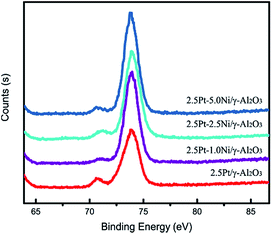 |
| | Fig. 7 XPS spectra of Pt 4f in the catalyst. | |
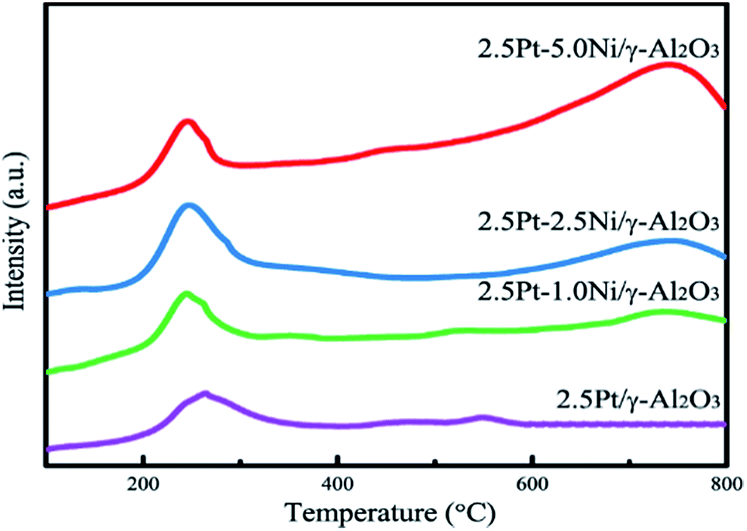
H2-TPR profiles of calcined Pt–Ni catalysts are shown in Fig. 8. Pt monometallic catalyst showed a reduction peak at 225 °C corresponding to the PtO2 → Pt reduction. This peak had a shift towards lower temperature for Pt–Ni bimetallic catalyst, indicating that the addition of Ni promoted the reduction of Pt species, which may be explained by the formation of Pt–Ni alloy.22 The reduction peak at the range of 600–800 °C belongs to the reduction of Ni2+ ions incorporated in the nickel aluminate structure.23
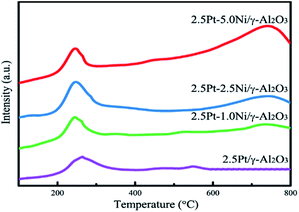 |
| | Fig. 8 H2-TPR profiles of calcined Pt–Ni catalysts. | |
3.3 The effect of Pt/Ni ratio
The effect of Pt/Ni ratio was investigated over Pt–Ni bimetallic catalysts, and the glycerol conversion as well as product selectivity were presented in Table 3. Results indicate that although glycerol hydrogenolysis reaction using hydrogen in situ generated is able to proceed over Pt–Al2O3 catalyst, both the conversion and selectivity of 1,2-propanediol are relatively low. The addition of Ni significantly improves both the catalyst activity and selectivity for the hydrogenolysis of glycerol, which is associated with the strong interaction between Pt and Ni in the Pt–Ni catalyst, as evidenced in H2-TPR analysis. A maximum conversion was obtained at a Pt/Ni ratio of 2.5:2.5. The surface area and pore diameter drop considerably with higher Ni content due to the plugging of Ni species, leading to a decline of catalyst activity. The selectivity of 1,2-propanediol also decreases owing to over-cracking of hydrogenolysis products into CH4 and CO2.
Table 3 Effect of Pt/Ni ratio on glycerol conversion and product selectivitya
| Catalysts |
Conversion/% |
Selectivity/% |
| 1,2-PDO |
EG |
2-Propanol |
1-Propanol |
CH4 |
CO2 |
Othersb |
| Reaction conditions: 1.0 g of catalyst, 100 mL of glycerol aqueous solution (20 wt%), 1.0 MPa of N2 pressure, 240 °C of reaction temperature, 3 h of reaction time. Others contain methanol, ethanol, acetone alcohol, etc. |
| 2.5Pt |
45.3 |
47.3 |
10.0 |
8.2 |
6.5 |
1.1 |
14.6 |
2.3 |
| 2.5Pt–1.0Ni |
65.0 |
56.9 |
10.6 |
7.8 |
5.2 |
1.3 |
15.9 |
2.3 |
| 2.5Pt–2.5Ni |
71.4 |
52.4 |
10.9 |
7.9 |
1.8 |
1.6 |
16.7 |
1.7 |
| 2.5Pt–5.0Ni |
66.2 |
50.9 |
13.1 |
9.2 |
4.0 |
1.9 |
15.8 |
2.1 |
3.4 The effect of reaction temperature
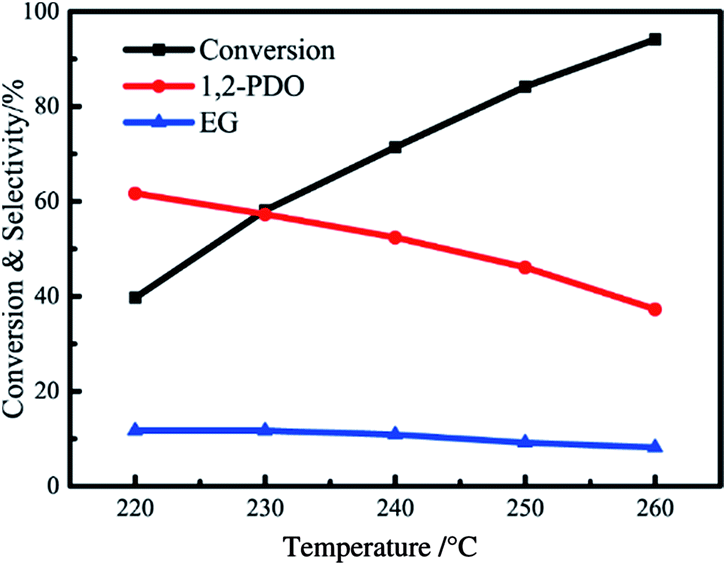
The effect of reaction temperature on activity and selectivity was studied at a temperature range of 220–260 °C, and the results are presented in Fig. 9. The glycerol conversion has an increasing trend with reaction temperature suggesting that temperature increment favours the reaction activity. The selectivity of 1,2-propanediol decreases from 61.7% at 220 °C to 37.3% at 260 °C, caused by excessive hydro-deoxygenation of 1,2-propanediol (C–O and C–C bond cleavage) to propanol and lower alcohols (i.e. methanol, ethanol).24–27 The selectivity of ethylene glycol also shows a decreasing trend, but the decrease is not significant. Lahr et al. found that ethylene glycol is considerably stable under hydrogenation reaction conditions, so the degradation of ethylene glycol is difficult to proceed in this reaction.28 Besides, the selectivity of gaseous product, CH4 and CO2, increases significantly with reaction temperature for aqueous phase reforming of glycerol is an endothermic reaction which favours a higher reaction temperature.10
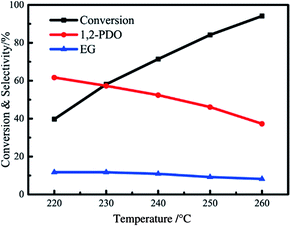 |
| | Fig. 9 Effect of reaction temperature on glycerol conversion and the selectivity of 1,2-PDO and EG over 2.5Pt–2.5Ni/γ-Al2O3 catalyst. Reaction conditions: 1.0 g of catalyst, 100 mL of glycerol aqueous solution (20 wt%), 1.0 MPa of N2 pressure, 3 h of reaction time. | |
3.5 Reaction evolution with time
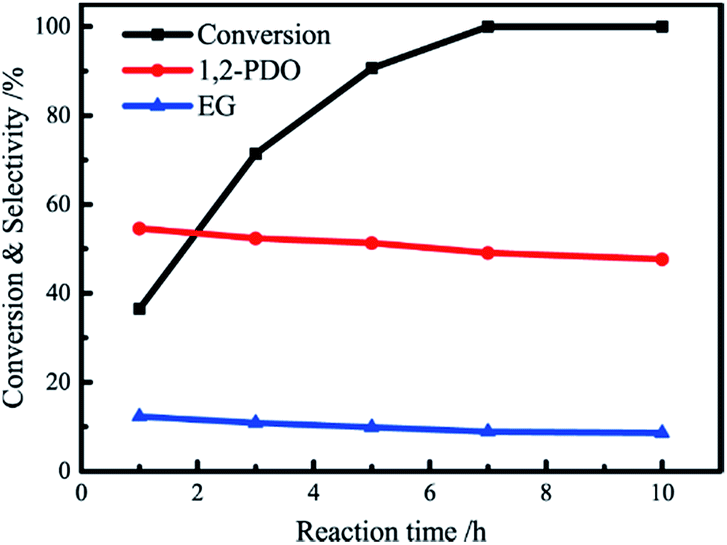
The effect of reaction time was investigated over Pt–Ni catalyst, and the conversion of glycerol as well as product selectivity are illustrated in Fig. 10. Glycerol conversion grows rapidly in the beginning, reaching a high glycerol conversion of 71.4% at 3 h of reaction time, then it increases at a lower rate till a complete reaction for 7 h. 1,2-Propanediol is formed with a high selectivity of 54.6% at 1 h, which indicates the promotion on hydrogenation over Pt–Ni catalyst. The selectivity of 1,2-propanediol and ethylene glycol has a slight decrement with time due to catalytic cracking of 1,2-propanediol and ethylene into C1.
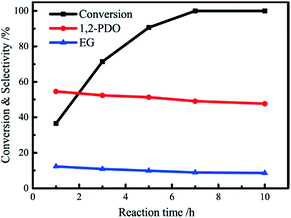 |
| | Fig. 10 Effect of reaction time on glycerol conversion and the selectivity of 1,2-PDO and EG over 2.5Pt–2.5Ni/γ-Al2O3 catalyst. Reaction conditions: 1.0 g of catalyst, 100 mL of glycerol aqueous solution (20 wt%), 1.0 MPa of N2 pressure, 240 °C of reaction temperature. | |
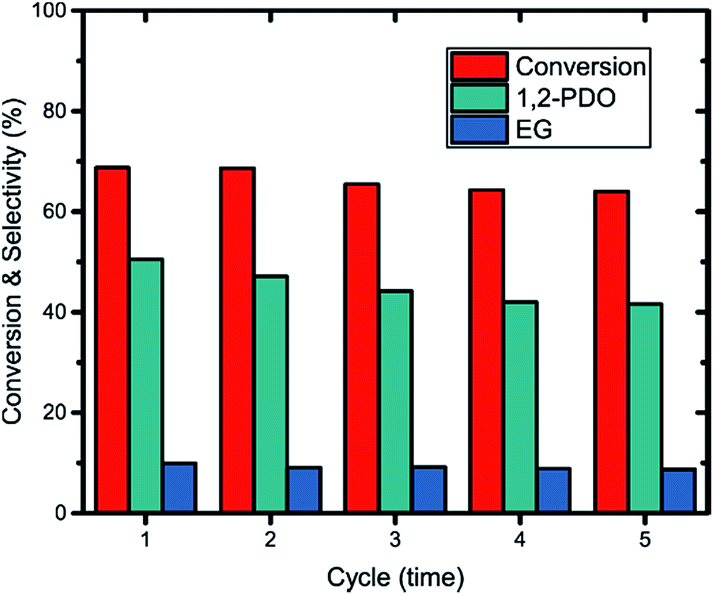
3.6 Reusability of Pt–Ni catalyst
Reusability tests were performed over 2.5Pt–2.5Ni/γ-Al2O3 catalyst, wherein the catalyst was washed and recycled after each cycle. As can be seen in Fig. 11, both the conversion and the selectivity of 1,2-propanediol has a slight decrease after each cycle, which was caused mainly by the coke formation and metal agglomeration. The conversion of glycerol and the selectivity of 1,2-propanediol decreased by only 4.77% and 8.96% after 5 cycles, suggesting the good stability and reusability of the catalyst.
 |
| | Fig. 11 Reusability tests over 2.5Pt–2.5Ni/γ-Al2O3 catalyst. Reaction conditions: 1.0 g of catalyst, 100 mL of glycerol aqueous solution (20 wt%), 1.0 MPa of N2 pressure, 240 °C of reaction temperature, 3 h of reaction time. | |
4 Conclusions
This paper demonstrates a hydrogenolysis process of glycerol using hydrogen generated from aqueous phase reforming in situ, which could proceed at a lower pressure and no longer need external hydrogen supply or hydrogen donor compounds. A series of Pt–M (M = Fe, Co, Ni, Cu, Zn, Sn) bimetallic catalysts supported on γ-Al2O3 have been synthesized, wherein the Pt–Ni catalyst was studied in detail owing to its high catalytic activity and selectivity.
The presence of Pt–Ni alloy was revealed by our catalyst characterization results, leading to a significant promotion of the conversion and selectivity over Pt–Ni bimetallic catalyst. A maximum conversion reached at a Pt/Ni ratio of 2.5:2.5. Higher reaction temperature favours the reaction activity increase, but the selectivity of 1,2-propanediol decreases significantly caused by excessive hydro-deoxygenation of 1,2-propanediol to propanol and lower alcohols. Glycerol conversion grows rapidly with reaction time initially, reaching 71.4% in 3 h. The reusability tests examined the good stability of the catalyst.
Acknowledgements
This work was supported by the National Natural Science Foundation of China (21373083) and the Fundamental Research Funds for the Central Universities (222201717013 and 222201717004). Yuqiang Yan thanks for a scholarship from the China Scholarship Council.
References
- G. Knothe and L. F. Razon, Prog. Energy Combust. Sci., 2017, 58, 36–59 CrossRef
 .
. - C. A. Quispe, C. J. Coronado and J. A. Carvalho Jr, Renewable Sustainable Energy Rev., 2013, 27, 475–493 CrossRef CAS .
- B. Katryniok, S. Paul, V. Bellière-Baca, P. Rey and F. Dumeignil, Green Chem., 2010, 12, 2079–2098 RSC .
- S. Zhu, X. Gao, Y. Zhu and Y. Li, Green Chem., 2016, 18, 782–791 RSC .
- S. Zhu, X. Gao, Y. Zhu, Y. Zhu, H. Zheng and Y. Li, J. Catal., 2013, 303, 70–79 CrossRef CAS .
- P. Hirunsit, C. Luadthong and K. Faungnawakij, RSC Adv., 2015, 5, 11188–11197 RSC .
- E. Vasiliadou, T. Eggenhuisen, P. Munnik, P. De Jongh, K. De Jong and A. Lemonidou, Appl. Catal., B, 2014, 145, 108–119 CrossRef CAS .
- J. B. Salazar, D. D. Falcone, H. N. Pham, A. K. Datye, F. B. Passos and R. J. Davis, Appl. Catal., A, 2014, 482, 137–144 CrossRef CAS .
- E. D'Hondt, S. Van de Vyver, B. F. Sels and P. A. Jacobs, Chem. Commun., 2008, 6011–6012 RSC .
- N. D. Subramanian, J. Callison, C. R. A. Catlow, P. P. Wells and N. Dimitratos, Int. J. Hydrogen Energy, 2016, 41, 18441–18450 CrossRef CAS .
- I. Gandarias, P. L. Arias, J. Requies, M. B. Güemez and J. L. G. Fierro, Appl. Catal., B, 2010, 97, 248–256 CrossRef CAS .
- E. P. Maris, W. C. Ketchie, M. Murayama and R. J. Davis, J. Catal., 2007, 251, 281–294 CrossRef CAS .
- O. M. Daniel, A. DeLaRiva, E. L. Kunkes, A. K. Datye, J. A. Dumesic and R. J. Davis, ChemCatChem, 2010, 2, 1107–1114 CrossRef CAS .
- M. L. Barbelli, G. F. Santori and N. N. Nichio, Bioresour. Technol., 2012, 111, 500–503 CrossRef CAS PubMed .
- T. Miyazawa, Y. Kusunoki, K. Kunimori and K. Tomishige, J. Catal., 2006, 240, 213–221 CrossRef CAS .
- I. Gandarias, J. Requies, P. L. Arias, U. Armbruster and A. Martin, J. Catal., 2012, 290, 79–89 CrossRef CAS .
- B. Mallesham, P. Sudarsanam, B. V. S. Reddy and B. M. Reddy, Appl. Catal., B, 2016, 181, 47–57 CrossRef CAS .
- S. Schimpf, C. Louis and P. Claus, Appl. Catal., A, 2007, 318, 45–53 CrossRef CAS .
- X. Peng, S. Zhao, T. J. Omasta, J. M. Roller and W. E. Mustain, Appl. Catal., B, 2017, 203, 927–935 CrossRef CAS .
- S. Lee, H. J. Kim, S. M. Choi, M. H. Seo and W. B. Kim, Appl. Catal., A, 2012, 429–430, 39–47 CrossRef CAS .
- P. K. Sahoo, B. Panigrahy and D. Bahadur, RSC Adv., 2014, 4, 48563–48571 RSC .
- E.-Y. Ko, E. D. Park, K. W. Seo, H. C. Lee, D. Lee and S. Kim, Catal. Lett., 2006, 110, 275–279 CrossRef CAS .
- Z. Boukha, C. Jiménez-González, B. de Rivas, J. R. González-Velasco, J. I. Gutiérrez-Ortiz and R. López-Fonseca, Appl. Catal., B, 2014, 158, 190–201 CrossRef .
- J. Yuan, S. Li, L. Yu, Y. Liu and Y. Cao, Chin. J. Catal., 2013, 34, 2066–2074 CrossRef CAS .
- M. Balaraju, V. Rekha, P. S. Prasad, R. Prasad and N. Lingaiah, Catal. Lett., 2008, 126, 119–124 CrossRef CAS .
- C.-J. Yue, L.-P. Gu, Y. Su and S.-P. Zhu, React. Kinet., Mech. Catal., 2014, 111, 633–645 CrossRef CAS .
- L. Guo, J. Zhou, J. Mao, X. Guo and S. Zhang, Appl. Catal., A, 2009, 367, 93–98 CrossRef CAS .
- D. G. Lahr and B. H. Shanks, J. Catal., 2005, 232, 386–394 CrossRef CAS .
|
| This journal is © The Royal Society of Chemistry 2017 |
Click here to see how this site uses Cookies. View our privacy policy here. 
 Open Access Article
 This Open Access Article is licensed under a Creative Commons Attribution-Non Commercial 3.0 Unported Licence
 b and
Fahai Cao
b and
Fahai Cao