
 Open Access Article
 This Open Access Article is licensed under a
 Creative Commons Attribution 3.0 Unported Licence
Enhanced electrochemical response of activated carbon nanostructures from tree-bark biomass waste in polymer-gel active electrolytes†
Damilola Momodu,
Abdulhakeem Bello,
Kabir Oyedotun,
Faith Ochai-Ejeh,
Julien Dangbegnon,
Moshawe Madito and
Ncholu Manyala *
*
Department of Physics, Institute of Applied Materials, SARCHI Chair in Carbon Technology and Materials, University of Pretoria, Pretoria 0028, South Africa. E-mail: Ncholu.Manyala@up.ac.za; Fax: +27 12 420 2516; Tel: +27 12 420 3549
First published on 26th July 2017
Abstract
Activated carbon (ACB) obtained from tree bark waste biomass was obtained by adopting an optimized activation and carbonization route using potassium hydroxide (KOH) pellets. The morphological and structural characteristics of the optimized carbon material revealed a porous network suitable for charge storage. The potential of the ACB material as a suitable supercapacitor electrode was investigated in a symmetric two electrode cell configuration using a polymer-gel/KOH active electrolyte. The KOH was included to improve ionic mobility within the polyvinyl alcohol (PVA) gel, while carbon acetylene black and a polymer-fullerene blend acted as the conductive additives. The cell exhibited an EDLC behaviour in all electrolytes with the PVA/KOH/carbon black (PKCB) electrolyte portraying the best electrochemical response with a 1.4 V voltage window. A specific capacitance (CSP) of ∼227 F g−1 was obtained with a corresponding energy density of 15.5 W h kg−1 and power density of 700 W kg−1 at a current density of 0.5 A g−1. An excellent stability was exhibited with a coulombic efficiency of 98% after 5000 continuous cycles at 5.0 A g−1 and a slight deterioration of the ideal electrochemical behavior was observed after further subjecting the electrode to a floating test for 120 h (5 days) at 1.4 V. Interestingly, the gel-based electrolyte showed a peculiar “recuperating behavior” after further floating process and negligible charge loss after a self-discharge process for 30 h at 1.0 A g−1 which demonstrates the viability for adopting gel-electrolytes in SC devices from plant biomass waste.
1. Introduction
Globally, energy research has been given priority due to the surge in power demand in many parts of the world. The observed poor power supply especially in developing countries is closely linked to the gradual consumption of fossil fuel which currently supplies the majority of the global energy demand. Generating alternative energy from renewable sources1–3 is seen as the way to go in order to address this. By doing so, we also need to take into account that these sources (e.g. sun and wind) are not consistently available. Thus, energy storage systems are required to preserve the excess energy for use when needed.Batteries and electrochemical capacitors (also known as supercapacitors, SCs) are at the forefront of these cutting edge energy storage technologies available today.3–5 Amongst these two technologies, SCs with an electrical double layer (EDLC) storage mechanism have also generated widespread attention in connection with their various applications.5–7
Porous carbon is the choice material for SCs due to its exceptional set of properties including electrochemical stability, good electrical conductivity and textural properties, and is suitable for ion adsorption leading to high power density and long cycle life. Even so, SCs still suffer from low energy density when compared with batteries.8 In an attempt to improve on the electrochemical performance (energy density) of SCs, many allotropes and diverse forms of carbon,8–11 have all been explored. With the advent of graphene and its three dimensional counterpart with high specific surface area (SSA), it was proposed that graphene could be a potential substitute to the traditional porous carbons used in commercial SCs with a view to drastically improve the electrochemical performance (capacitance and energy density) of the SCs.8,12 However, this has still not been achieved, although graphene based electrodes have shown great contribution on its part. The production of low-cost carbon materials from biomass sources (materials derived from nature) has triggered enormous research interest due to their synthesis route, environmentally friendly nature, and availability.13 Several biomass materials have been explored as sources of carbon material for electrochemical applications. For example, some studies have revealed a high temperature carbonization of seaweed and waste tea-leaves for SCs.14–16 The devices fabricated from these materials had a specific capacitance (CSP) of between 296–330 F g−1 in KOH electrolyte. Biswal et al.17 pyrolyzed dead leaves to produce carbon material which exhibited a SSA of 1230 m2 g−1 and a CSP of 400 F g−1 in 1 M H2SO4 electrolyte. Recently, pine cone biomass were explored as electrodes for lithium batteries18 and SCs in both organic19 and aqueous electrolytes.20,21
It has also been shown that BDCs respond differently in various electrolytes depending on the pH and viscosity of the electrolyte.22–24 The choice of the operating electrolyte is another important parameter that influences their electrochemical performance in SCs. Aqueous electrolytes are often limited by the thermodynamic decomposition of water at 1.23 V,25 organic and ionic liquids remain stable up to a potential window of ∼2.9 V and ∼4.0 V respectively. In the non-aqueous electrolytes, oxygen and hydrogen evolution are not observed at 1.23 V due to the absence of water molecules.26,27 These electrolytes have also been used for biomass derived carbon with a CSP of ∼142 F g−1 at 1 A g−1 reported for pine cone petal in organic electrolyte19 and a CSP of 15–20 F g−1 in 1 M Et4NBF4/PC electrolyte for carbon derived from agricultural waste.28 Solid state (polymer gel) electrolytes have also been explored by researchers29 in order to adopt them in flexible device electronics. However, they are limited by low electrochemical performance when compared to the other types of electrolytes because of their low ionic mobility and poor contact at the electrolyte–electrode interface.30 In order to improve the electrochemical performance of SCs in solid state electrolytes, aqueous electrolytes,31,32 redox active materials33–38 and transition metal ion complexes39 are employed as additives which boost their overall performance.40
The present work reports a fundamental and facile approach to improve on the electrochemical storage feature of activated carbon derived from a tree bark waste using efficient polymer gel-active electrolytes prepared by the addition of a conductive carbon acetylene black (CB) and a polymer-fullerene blend commonly known as P3HT:PCBM (poly(3-hexylthiophene) mixed with [6,6]-phenyl C61-butyric acid methyl ester) in a PVA/KOH electrolyte acting as an advanced mediated gel-electrolyte for SCs application. The synthesized activated carbon material had initially exhibited a CSP of 114 F g−1 at 0.3 A g−1 in a neutral aqueous electrolyte as reported in our previous work.22 However, symmetric SCs based on the proposed gel-based electrolyte, resulted in an overall improvement in the device performance. An increased specific capacitance of 227 F g−1 at a higher normalized current of 0.5 A g−1, energy density of 15.5 W h kg−1 and a corresponding power density of 700 W kg−1 in an extended operating voltage of 1.4 V were recorded. An excellent rate capability after continuous cycling for 5000 cycles and further floating for 120 h (approx. 5 days) also depicted a good device stability with an interesting improvement in device behavior after floating.
2. Materials and methods
All chemicals and gases used in this study were of high purity and analytical grade.(i) Synthesis of activated carbon (ACB) from plant biomass waste
The activated carbon (ACB) was prepared as described in our earlier work.22 Briefly, the (ACB) raw material was crushed and soaked in a 6 M KOH solution to allow for complete penetration of the K+ ions into the raw material. Thereafter, the mixture in the form of a “mud cake” was carbonized at 700 °C at a ramp rate of 5 °C min−1 for 2 h. Finally, thorough washing with HCl and deionized water was done to obtain the final product.(ii) Materials characterization
The morphological study of the ACB material was done with a Zeiss Ultra Plus 55 field emission scanning electron microscope (FE-SEM) operated at 1.0 kV. Nitrogen (N2) absorption/desorption isotherms were obtained from a Micromeritics TriStar II 3020 material pore analyser operated in a relative pressure (P/Po) range of 0.01–1.0 after degassing the samples at 140 °C for 18 h. The Brunauer–Emmett–Teller (BET) and Barrett–Joyner–Halenda (BJH) models were used to determine the surface area and the pore size distribution (PSD) of the sample respectively.A WITec Alpha 300R Plus confocal micro-Raman imaging system was used to obtain the Raman spectra with a 532 nm excitation laser set at a 5.0 mW power. X-ray photoelectron spectroscopy (XPS) procedure was used to inspect the material's surface chemistry and to quantitatively determine the active carbon content present within the ACB sample. Al-Kα rays were exposed to the material and the resulting spectra was set at a pulse energy of 117.5 eV and 0.1 eV step-size. High resolution spectra for the C 1s and O 1s sections were also recorded at a 23.5 eV pass energy with a 0.05 eV step-size.
X-ray diffraction analysis was done using an XPERT-PRO diffractometer operating a cobalt tube at 35 kV and 50 mA. The XRD patterns of all specimens were recorded in the 10.0–80.0° range with a 15.24 seconds counting time.
(iii) Preparation of polymer-gel active electrolyte
A viscous 10 wt% poly-vinyl alcohol (PVA) gel was used in this work as the main frame electrolyte and this was prepared by mixing a weighted amount of PVA powder into 50 ml of deionized water. Then, 10 ml of the as-prepared PVA solution was measured and mixed with 10 ml of KOH solution by continuously stirring while heating the solution until all KOH had intermixed within the gel to produce a clear PVA–KOH gel labeled as PK. The conductive additives carbon acetylene black (CB), poly(3-hexylthiophene) (P3HT) and phenyl-C61-butyric acid methyl ester (PCBM) inform of a blend, P3HT:PCBM (PP) were added to the PK gel to improve the ionic conductivity of the final polymer-gel active electrolyte denoted as PKCB and PKPP, respectively. The mass of CB and PP added was 10 mg each per 10 ml of the as-prepared PK gel.(iv) Electrode fabrication and testing
The active electrode was prepared by mixing the activated carbon, carbon acetylene black (CB) and polyvinylidene fluoride (PVdF) binder in a mass ratio of 8![[thin space (1/6-em)]](https://www.rsc.org/images/entities/char_2009.gif) :1:1 in 1-methyl-2-pyrrolidinone (NMP) to make a slurry. This was carefully coated onto annealed circular nickel foams (NF) and kept to dry at 70 °C for 10 min. Thereafter they were pressed and re-coated to ensure complete coverage of the entire NF surface. Final drying was done at the same temperature for 12 h. The NFs were then coupled in a coin cell package along with the respective gel electrolyte to obtain a symmetric supercapacitor device.
:1:1 in 1-methyl-2-pyrrolidinone (NMP) to make a slurry. This was carefully coated onto annealed circular nickel foams (NF) and kept to dry at 70 °C for 10 min. Thereafter they were pressed and re-coated to ensure complete coverage of the entire NF surface. Final drying was done at the same temperature for 12 h. The NFs were then coupled in a coin cell package along with the respective gel electrolyte to obtain a symmetric supercapacitor device.
Electrochemical testing was performed on a Biologic VMP-300 potentiostat interfaced by an EC-Lab® operation software for a full device characterization. Cyclic voltammetry (CV), galvanostatic cycling with potential limitation (GCPL), electrochemical impedance spectroscopy (EIS) and continuous cycling/stability tests were performed on the symmetric cell. The CV tests were done at varying scan rates (10–100 mV s−1) while the GCPL tests was done at different normalized currents (0.5–10.0 A g−1) in a 0–1.4 V voltage range. EIS measurements were performed in a 100 kHz to 10 mHz frequency range.
3. Results and discussion
(i) Materials characterization
A detailed materials characterization has been reported in our earlier work22 and as such only very important results related to this present study is shown for scientific and reading consistency. The fascinating encounter in this work is based on the enhanced material performance recorded based on the adoption of this material in a gel-active medium. This is linked to the nature of the material properties observed from extensive analysis using different characterization tools.Fig. 1a and b show the SEM images obtained from the morphological analysis of the sample at varying magnification. As observed from the figures, a highly disoriented porous structure is obtained with different pore sizes present in the frame work of the carbon material which could be suitable for electrolyte ion penetration. This aids in improving the charge storage capability of the material when adopted as a SC electrode.
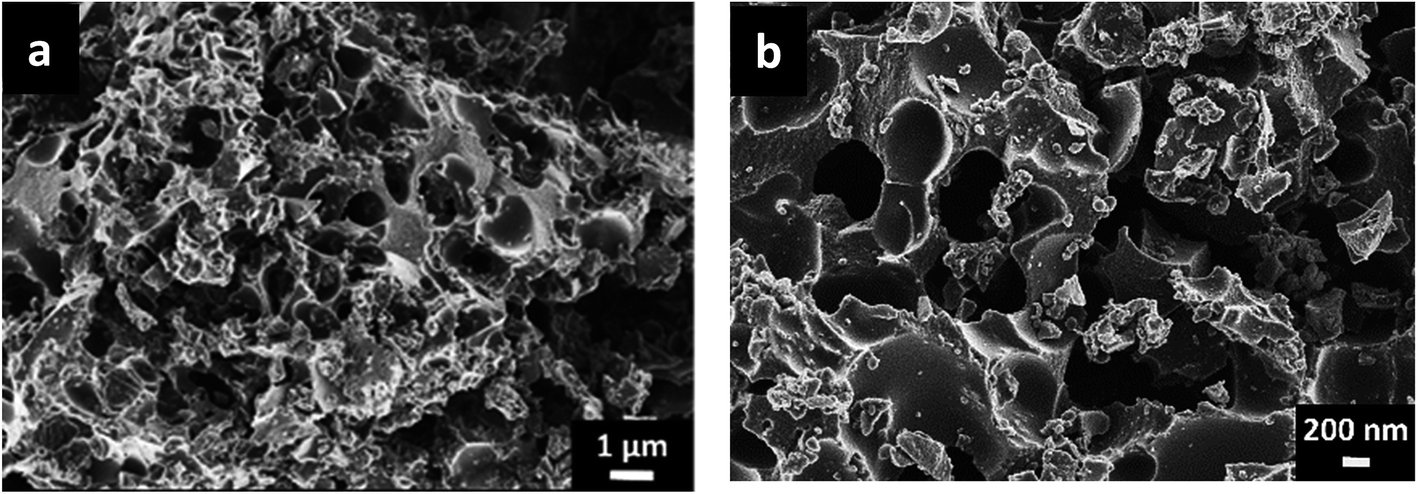 | ||
| Fig. 1 (a and b) SEM image at low and higher magnification of the ACB sample. | ||
The N2 adsorption/desorption isotherms and pore size distribution plot of the ACB sample are shown in Fig. 2a and b. The sample is seen to display a type II isotherm with a H3 hysteresis loop signifying the presence of porosity in the material. The PSD plot (Fig. 2b) further shows a peak just below 2.0 nm depicting the existence of micropores with a volume (Vmicro = 0.30 cm3 g−1) and another peak at ∼3.8 nm depicting the presence of mesopores (Vmeso = 0.10 cm3 g−1). The dissimilar pore distribution recorded, provides the path and site for charge transport and storage required for efficient device performance.
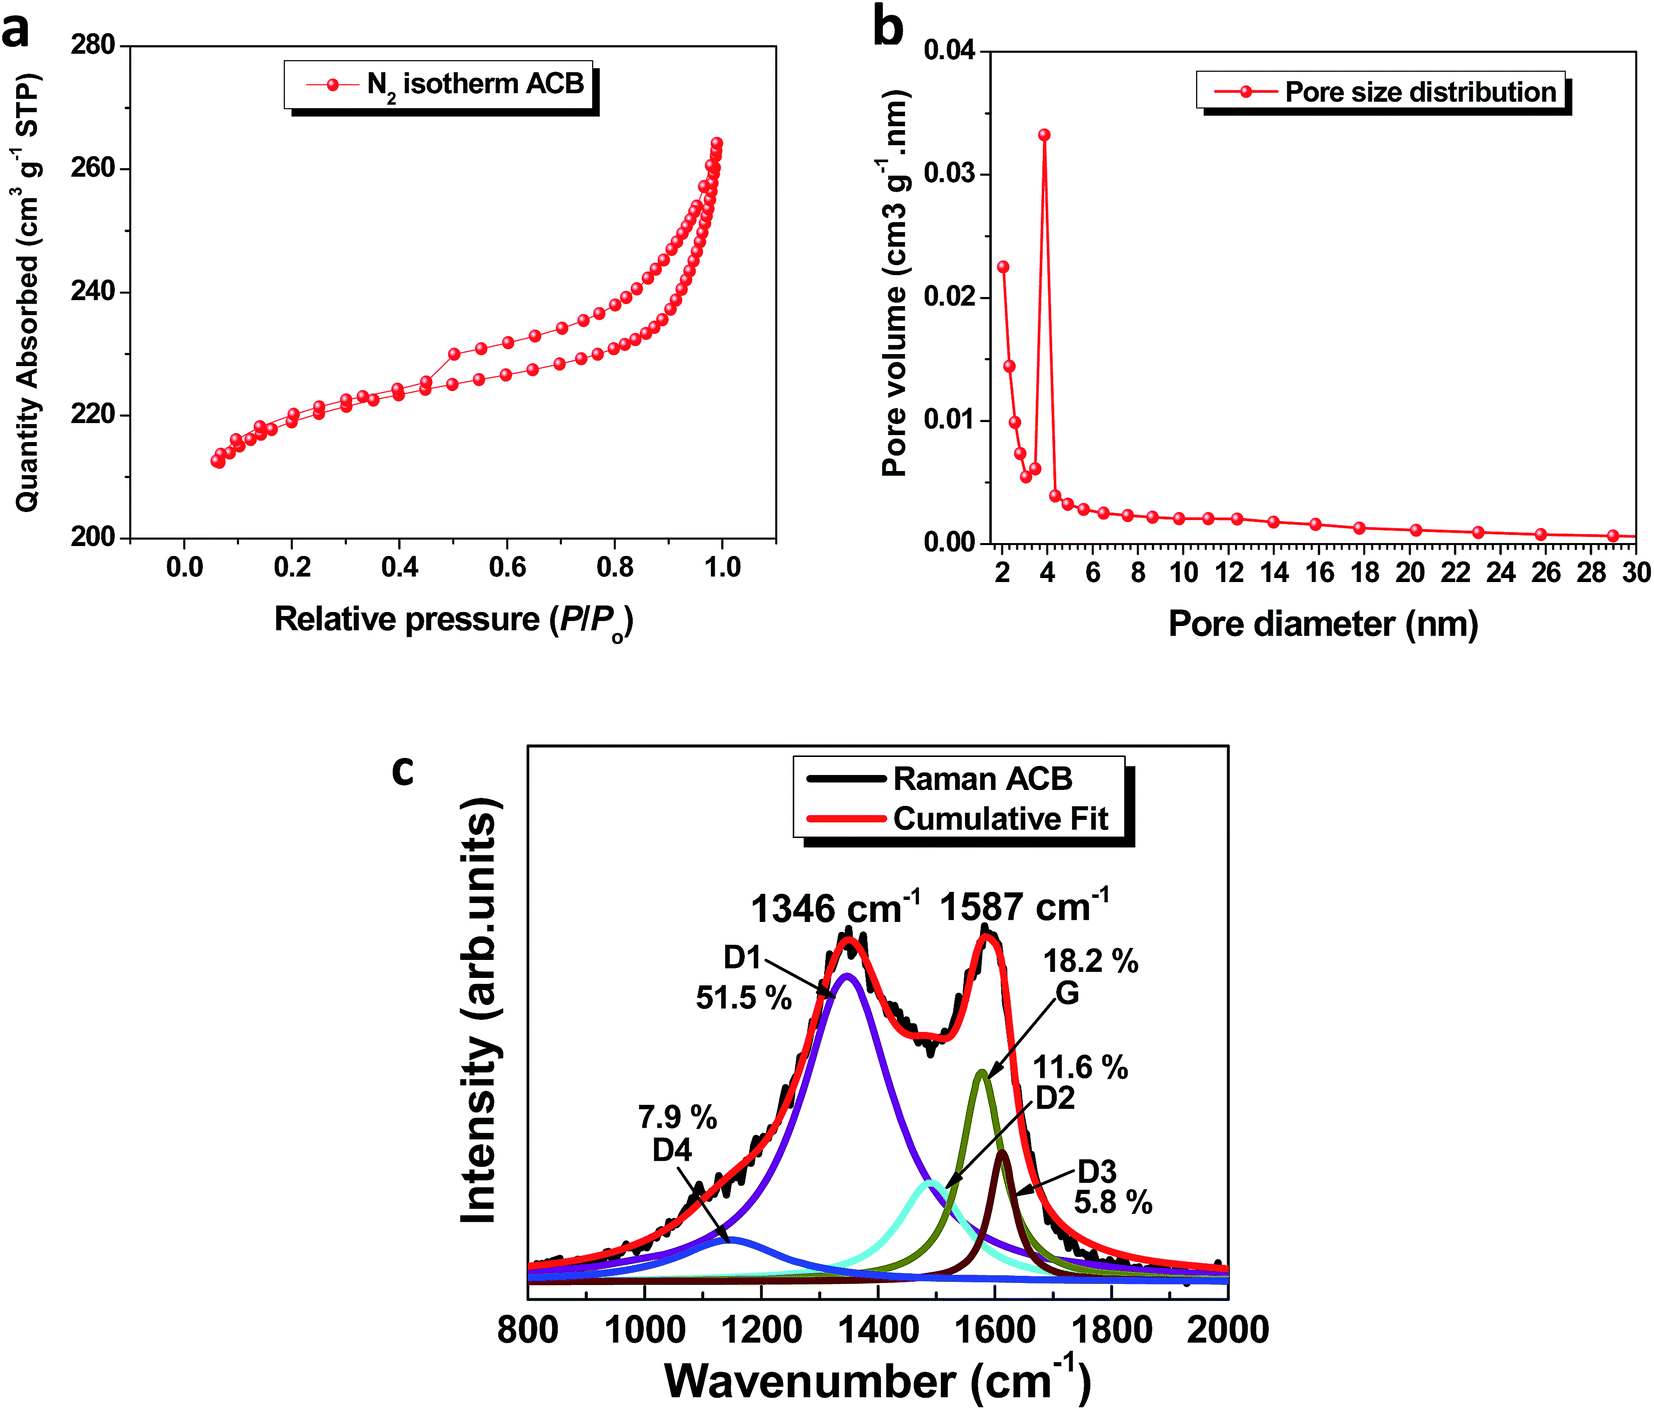 | ||
| Fig. 2 (a) N2 absorption/desorption isotherm; (b) pore size distribution (c) Raman spectra with the Lorentzians curve fitting describing detailed Raman peaks for the carbonaceous ACB material. | ||
The Raman spectrum (Fig. 2c) is attributed to disordered carbon materials with the typical D and G peaks of almost identical intensity situated at 1346 cm−1 and 1587 cm−1 respectively.41 The Lorentzians spectrum fitting to deconvolute the distinct peaks also confirmed the presence of a sp2 carbonaceous material. A detailed description of the origin of the distinct peaks has also been elucidated in our previous work.22
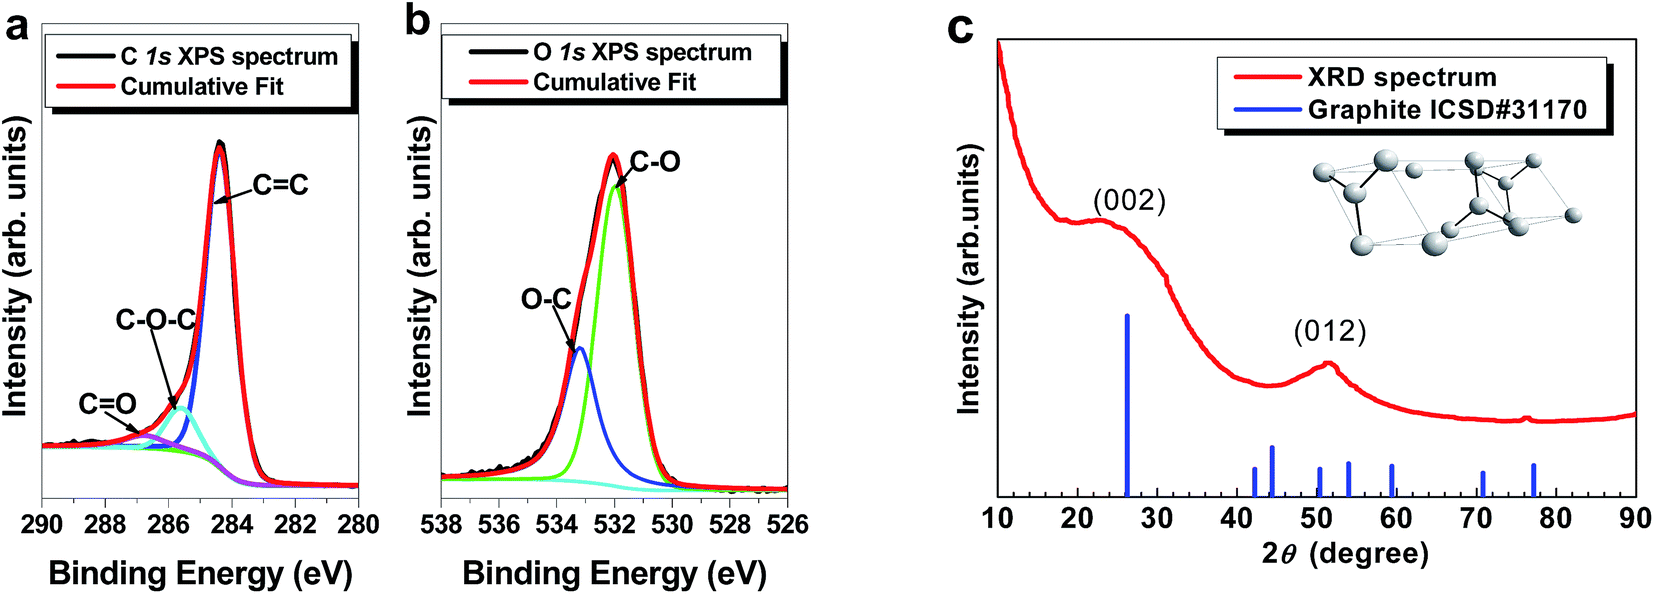
The XPS high resolution core level spectra for the elements of interest (i.e. C 1s and O 1s) are shown in Fig. 3a and b. All degenerate peaks in the C 1s spectrum (Fig. 3a) show high intensity response at a 284.4 eV which corresponds to the graphitic carbon signature (C![[double bond, length as m-dash]](https://www.rsc.org/images/entities/char_e001.gif) C) with others related to the functional group of the oxide components.42 Fig. 3b also displays similar carbon functional groups from the deconvoluted O 1s spectrum confirming the presence of some functional groups on the ACB material surface.43,44
C) with others related to the functional group of the oxide components.42 Fig. 3b also displays similar carbon functional groups from the deconvoluted O 1s spectrum confirming the presence of some functional groups on the ACB material surface.43,44
 | ||
| Fig. 3 (a and b) High-resolution core level XPS spectra of the C 1s and O 1s respectively and (c) XRD pattern from the surface analysis of the powdered activated carbon material. | ||
In Fig. 3c, the XRD spectrum of the ACB material were matched to a graphite ICSD card 31170 with a hexagonal crystal structure (see inset to Fig. 3c) and P63mc space-group which confirms the Raman results. A broadened peak situated at 2θ ca. 25° signifies presence of an amorphous atomic-structured carbon material which is linked to the (002) plane.
(ii) Electrochemical characterization
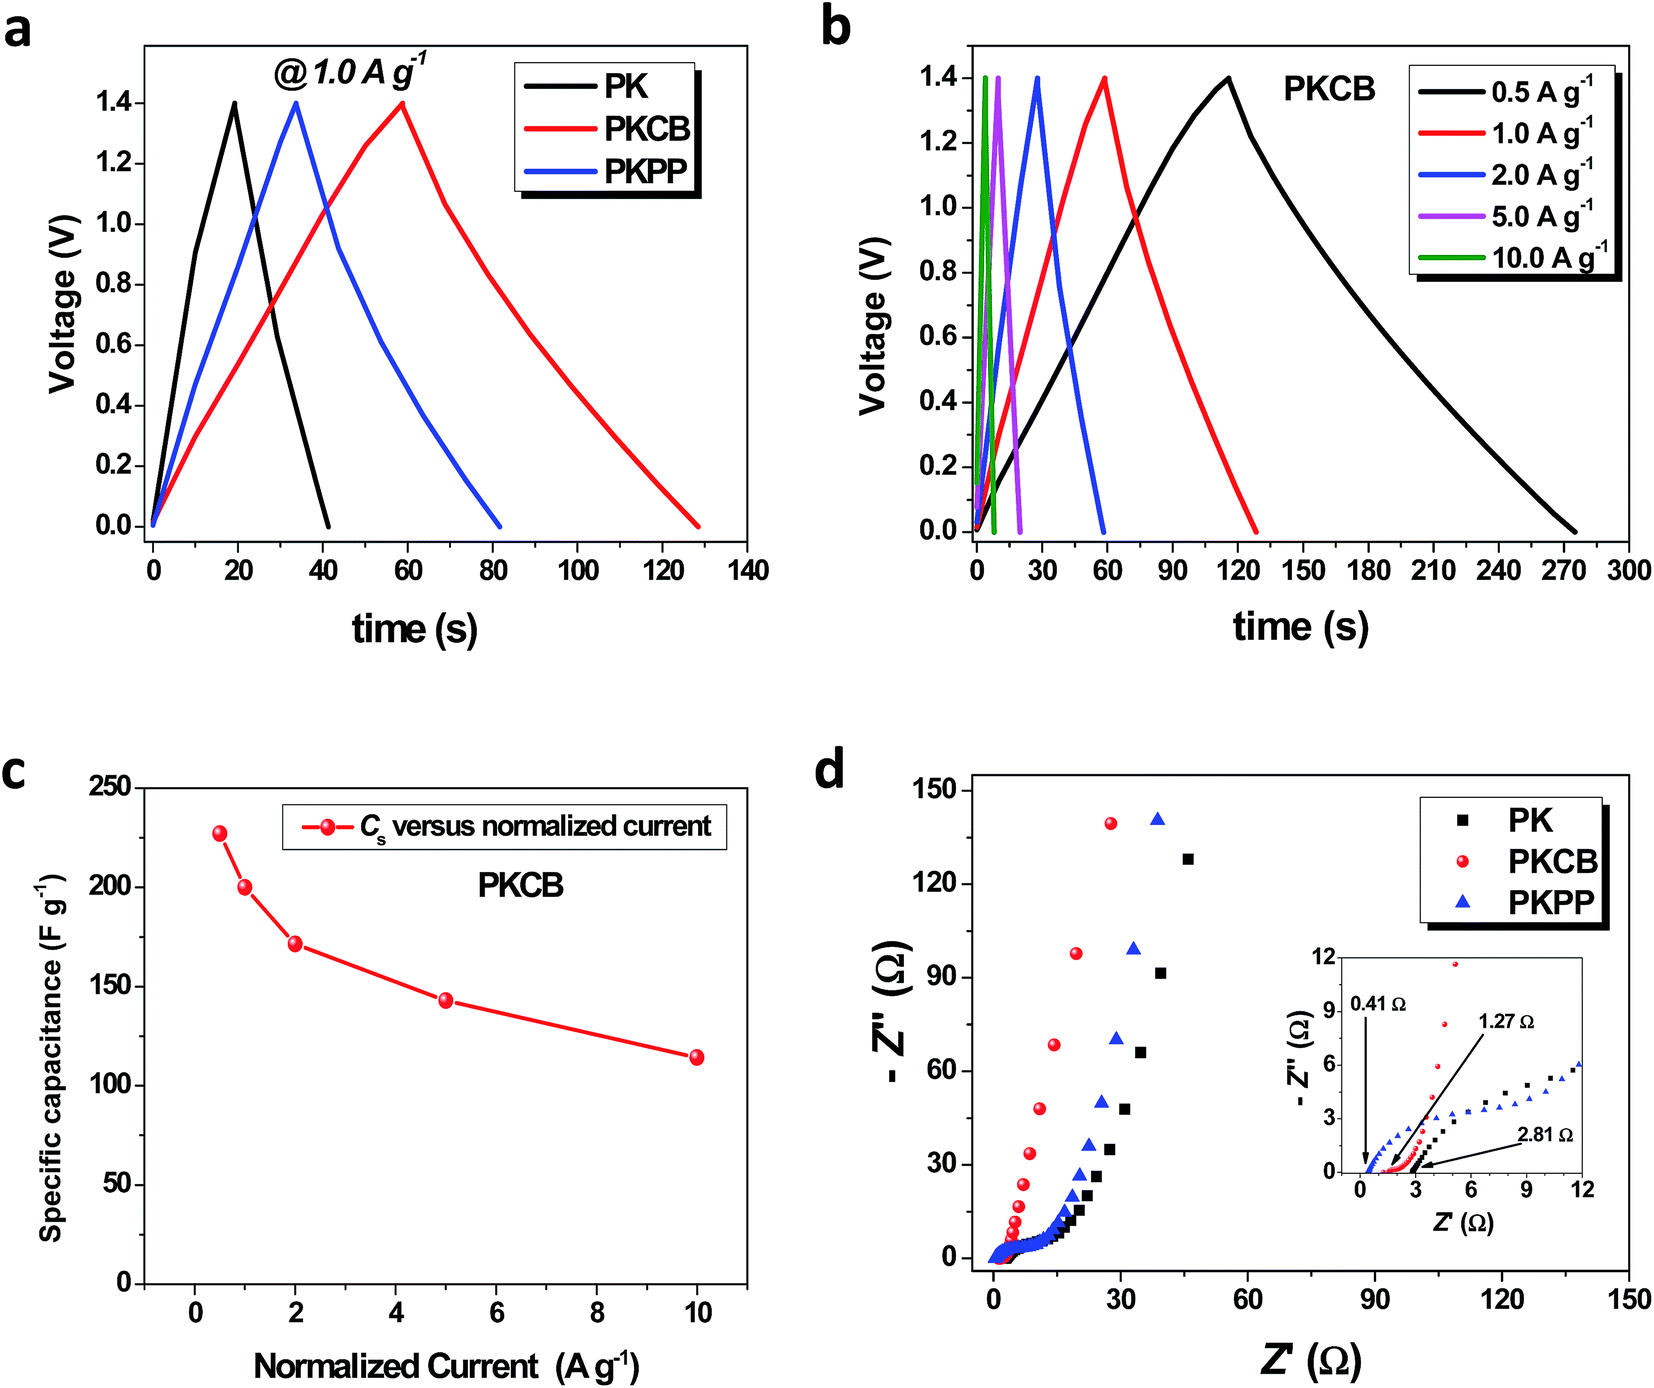
Cyclic voltammetry (CV) tests are used to determine the suitable operating voltage range in which the cell operates. Fig. 4a displays the initial operation voltage enhancement of the device aqueous electrolyte by the addition of the PVA polymer gel. It can be seen that although the polymer is non-conductive, it has little or no effect on the current response based on the amount added. This is likely due to the fact that there is no hindrance in the mobility of the existing K+ and OH− ions present in the pristine KOH electrolyte at a slower scan rate of 20 mV s−1. This is not be the case as the applied scan rate is increased due to the fact that faster charge kinetics occur at higher scan rate which might require higher mobility rate of ions. However, the essence of adding the polymer gel has been demonstrated in terms of increasing the existing voltage window in an attempt to improve the overall supercapacitor energy density which is the desire for researchers. A remarkable increase in the operating voltage from an initial value of 0.8 V to 1.4 V was recorded for the KOH and the KOH with PVA gel (PK) electrolyte respectively. Fig. 4b shows the CV curves between 0.0 and 1.4 V for the different electrolytes of PVA gel with KOH (PK), PVA–KOH gel plus carbon black (PKCB) and PVA–KOH gel plus a polymer blend containing a donor–acceptor chain (PKPP) used to test the ACB material at 20 mV s−1 in a symmetric cell. The idea behind testing these conductive additives is to harness their charge transport properties which will aid efficient charge storage. All curves revealed a typical EDL capacitive behavior with the current response for the ACB sample tested in PKCB being the highest indicating superior capacitance. The presence of the polymer blend also slightly improved its current response although this was not as enhanced as that of the CB. Probably, further tests to distinctly analyze the ratio of P3HT:PCBM added could lead to much better response.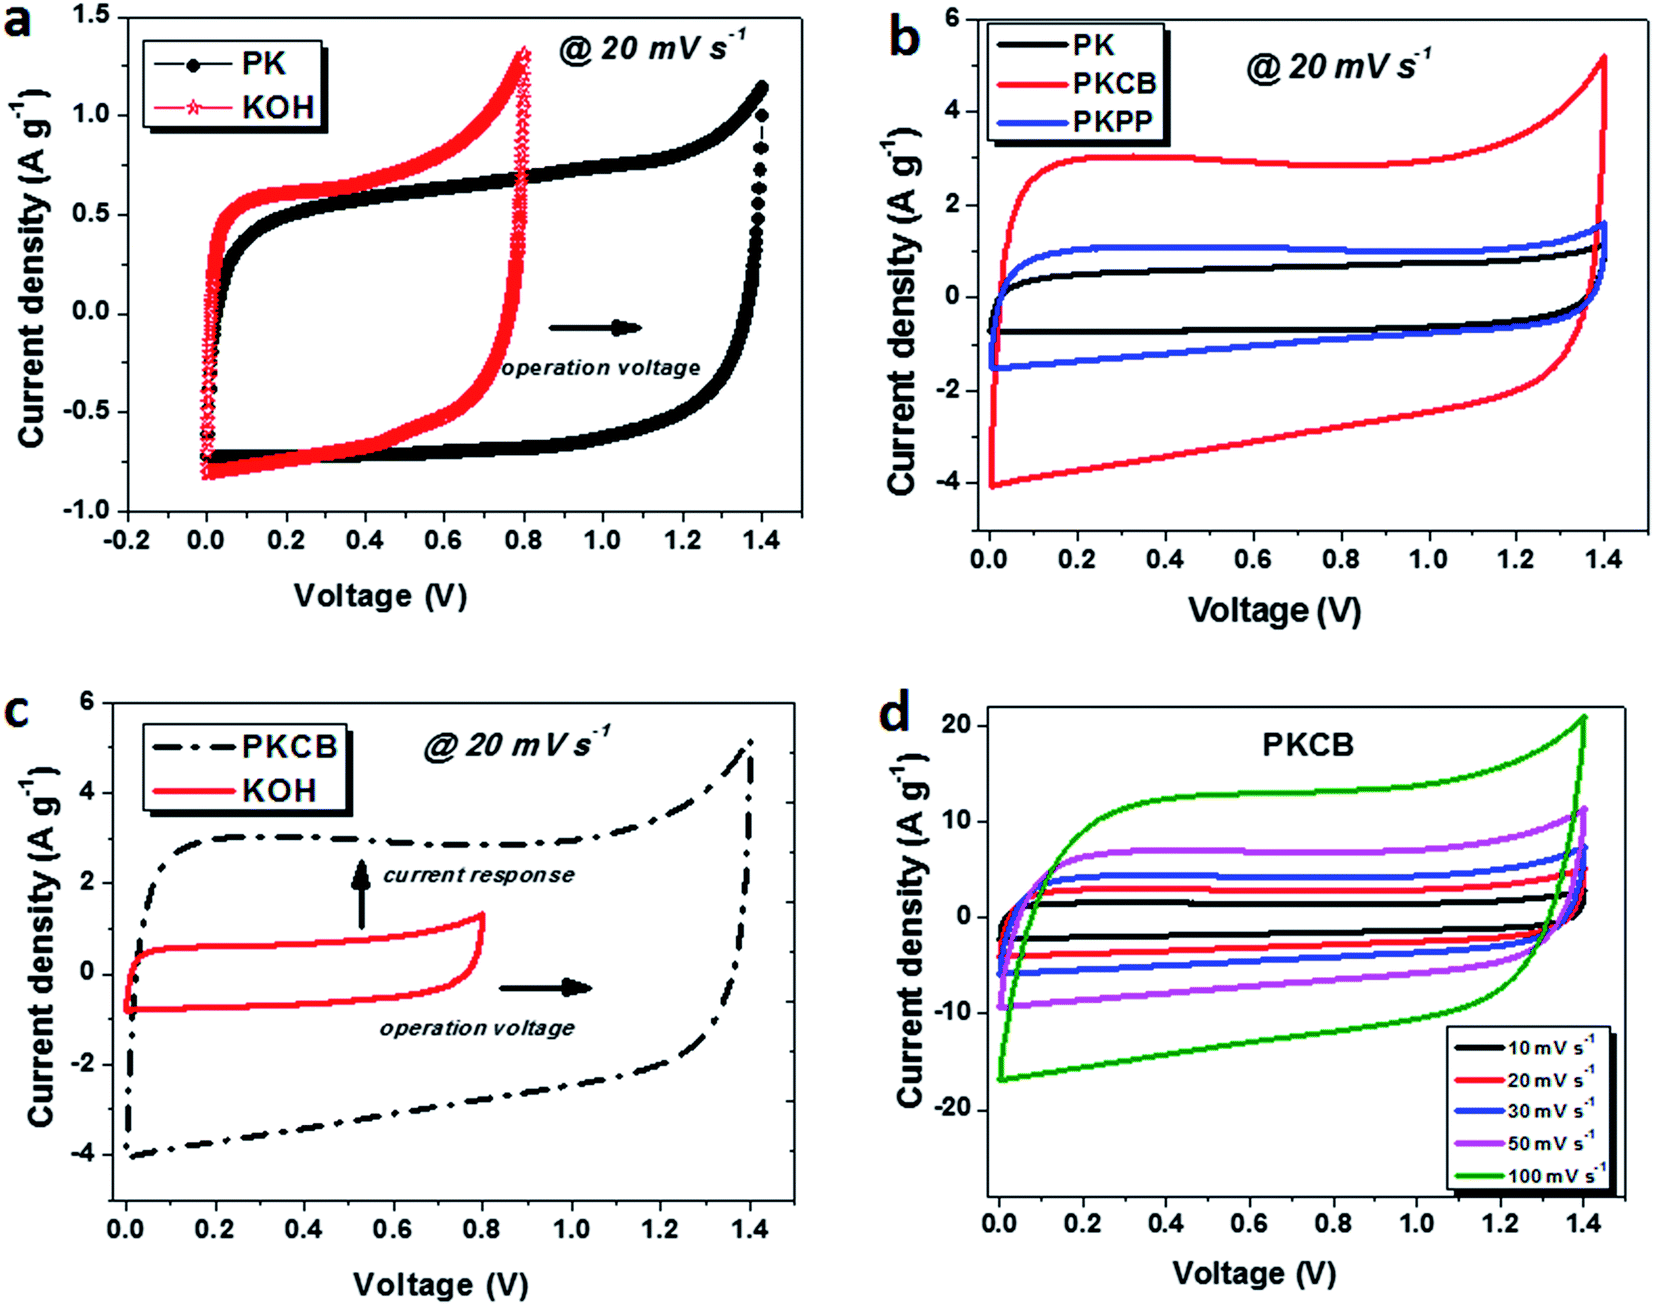 | ||
| Fig. 4 (a) CV plot showing enhancement of operating voltage of full device due to addition of PVA to the KOH electrolyte; (b) CV plot of ACB symmetric device in different gel electrolytes at 20 mV s−1; (c) CV plot showing enhancement of current response and operating voltage in the ACB//ACB symmetric device at 20 mV s−1 due to addition of PVA and conductive carbon black and (d) CV curves at varying scan rates for the symmetric device in a PKCB gel electrolyte. | ||
The influence of the polymer gel and carbon black additive is shown in Fig. 4c with a drastic increase in both the voltage window from 0.80 V to 1.40 V and the current response. This is linked to the incorporation of the PVA gel with KOH electrolyte and the effect of the conductive acetylene black added to the PVA/KOH gel to improve its ion mobility thereby enhancing electrode capacitance. This same increase in conductivity was also observed with the PKPP electrolyte (not directly shown), although this can be inferred from the current response of all electrolytes in Fig. 4b. The presence of conductive agents necessary for active ionic transport within the electrolyte improves the electrochemical properties of the symmetric device fabricated from activated carbon based on plant biomass waste.
Fig. 4d shows the CV curves at different scan rates for the activated carbon material in PKCB polymer-gel active electrolyte. The material is seen to still retain its EDLC characteristic even at high scan rates. This portrays the presence of a dominant capacitive feature with a small electrolyte diffusion limitation as the scan rate tends to reach 100 mV s−1. This diffusion limitation is observed in the alteration of the EDLC shape to form a quasi-rectangular shape with some form of increased ohmic trend leading to a decrease in the capacitance.45
A similar trend of improvement of the capacitance value based on the additive is observed in Fig. 4b with the GCPL curves displayed for all the three electrolytes in Fig. 5a. The highest discharge time (td) is reported for the sample tested in the PKCB electrolyte which is at par with the results obtained from CV tests. Analysis of the results from the GCPL curves at different gravimetric current (Fig. 5b) also confirmed the diffusion limitation assertion described above from the CV curves. At increasing current, an observed decrease in the discharge time is also described to be due to the limited movement of ions in the electrolyte due to less time for ions to fully interact with the electrode material.46 A specific capacitance of 227 F g−1 was obtained for the symmetric device at 0.5 A g−1 and a corresponding CSP of 200 F g−1 when the current was doubled to 1.0 A g−1. This is only an 11.8% drop in capacitance as a result of a 100% current density increase. A summary of the calculated specific capacitance from the GCPL plots against normalized current is shown in Fig. 5c. The ACB material still retains a specific capacitance of over 100 F g−1 even at a high current of 10 A g−1. This indicates the high power capability of the ACB material in the PKCB polymer-gel active electrolyte.
 | ||
| Fig. 5 (a) Charge–discharge curves of the ACB//ACB symmetric device in different gel electrolyte at 1.0 A g−1; (b) detailed charge–discharge profile at current densities of 0.5–10 A g−1 and (c) associated plot depicting the variance of specific capacitance with increasing gravimetric current for the ACB device tested in PKCB electrolyte; (d) Nyquist plot of the ACB electrode in different gel electrolytes with the figure inset illustrating the equivalent series resistance (ESR) in the high frequency region. | ||
EIS measurements for the ACB sample tested in the three electrolytes is reported in Fig. 5d at an open circuit (Eoc) potential. EIS analysis has been described to be one of the fundamental techniques used in discretely examining the principal behavior of a supercapacitors.47,48 The EIS scan was done from a high frequency (f = 100 kHz) to a low frequency (f = 10 mHz) range. A partial semi-circle was observed (inset to Fig. 5d) which depicts a dispersion effect with the charge transfer resistance (RCT) obtained from the size of this semi-circle.
The intercept of the Nyquist plot at the high frequency region with the real Z′-axis corresponds to the equivalent series resistance (ESR) value of the cell. This value is composed of the solution resistance, contact resistance at the active material/current collector interface and the intrinsic resistance of the active electrode material.48 Although the ESR-value of the ACB electrode tested in the PKPP electrolyte has the lowest value (0.41 Ω), the ESR of the sample in the PKCB electrolyte (1.27 Ω) is seen to portray a more ideal capacitive behavior when comparing the angle the Nyquist plot makes with the Z′-axis at low frequency. A perfectly vertical line parallel to the – Z′′ axis shows an ideal capacitive behavior.49 A vertically tilted line on the other hand, portrays the combination of a wholly capacitive behavior coupled with a low ionic diffusion resistance within the cell. Thus from the Fig. 5d, it can be seen that the ACB sample in the PKCB depicts a better capacitive response as compared to the one in the PKPP and PK electrolytes respectively. The observed lowest ESR-value with the PKPP is most likely linked to the presence of the donor–acceptor contribution from the P3HT:PCBM polymer blend which is not sufficient enough to improve the electrochemical capability of the entire device as compared to the material tested in the PKCB electrolyte.
Fig. 6a shows the modified Randles circuit50 used to fit the EIS data obtained for the ACB symmetric cell tested in the PKCB. This is composed of an equivalent series resistor, denoted as (Rs) connected in series to the charge transfer resistance (RCT). The shift from a high-low frequency region is fitted by a Warburg diffusion element (W) which is modelled in series with the RCT. The constant phase element (CPE) impedance, which is denoted as Q in the circuit is related to the roughness and pseudocapacitive kinetics of the porous electrode. This value can be expressed as:
 | (1) |
Z versus logf graph. For values of n = 0, n = 1 and n = −1, Q acts as a pure resistor, a pure capacitor and as an inductor respectively.53 Ideally, at very low frequencies, an ideal polarizable capacitive electrode should give rise to a straight line parallel to the imaginary Z′′-axis. A deviation from this ideal behavior however has been observed from the Nyquist plot. This variance is attributed to the existence of a resistive element associated to capacitance leakage (C). This resistance is denoted as leakage resistance RL and is in parallel with C. A summary of the fitting parameters is shown in Table 1 within an error value of 0.02.
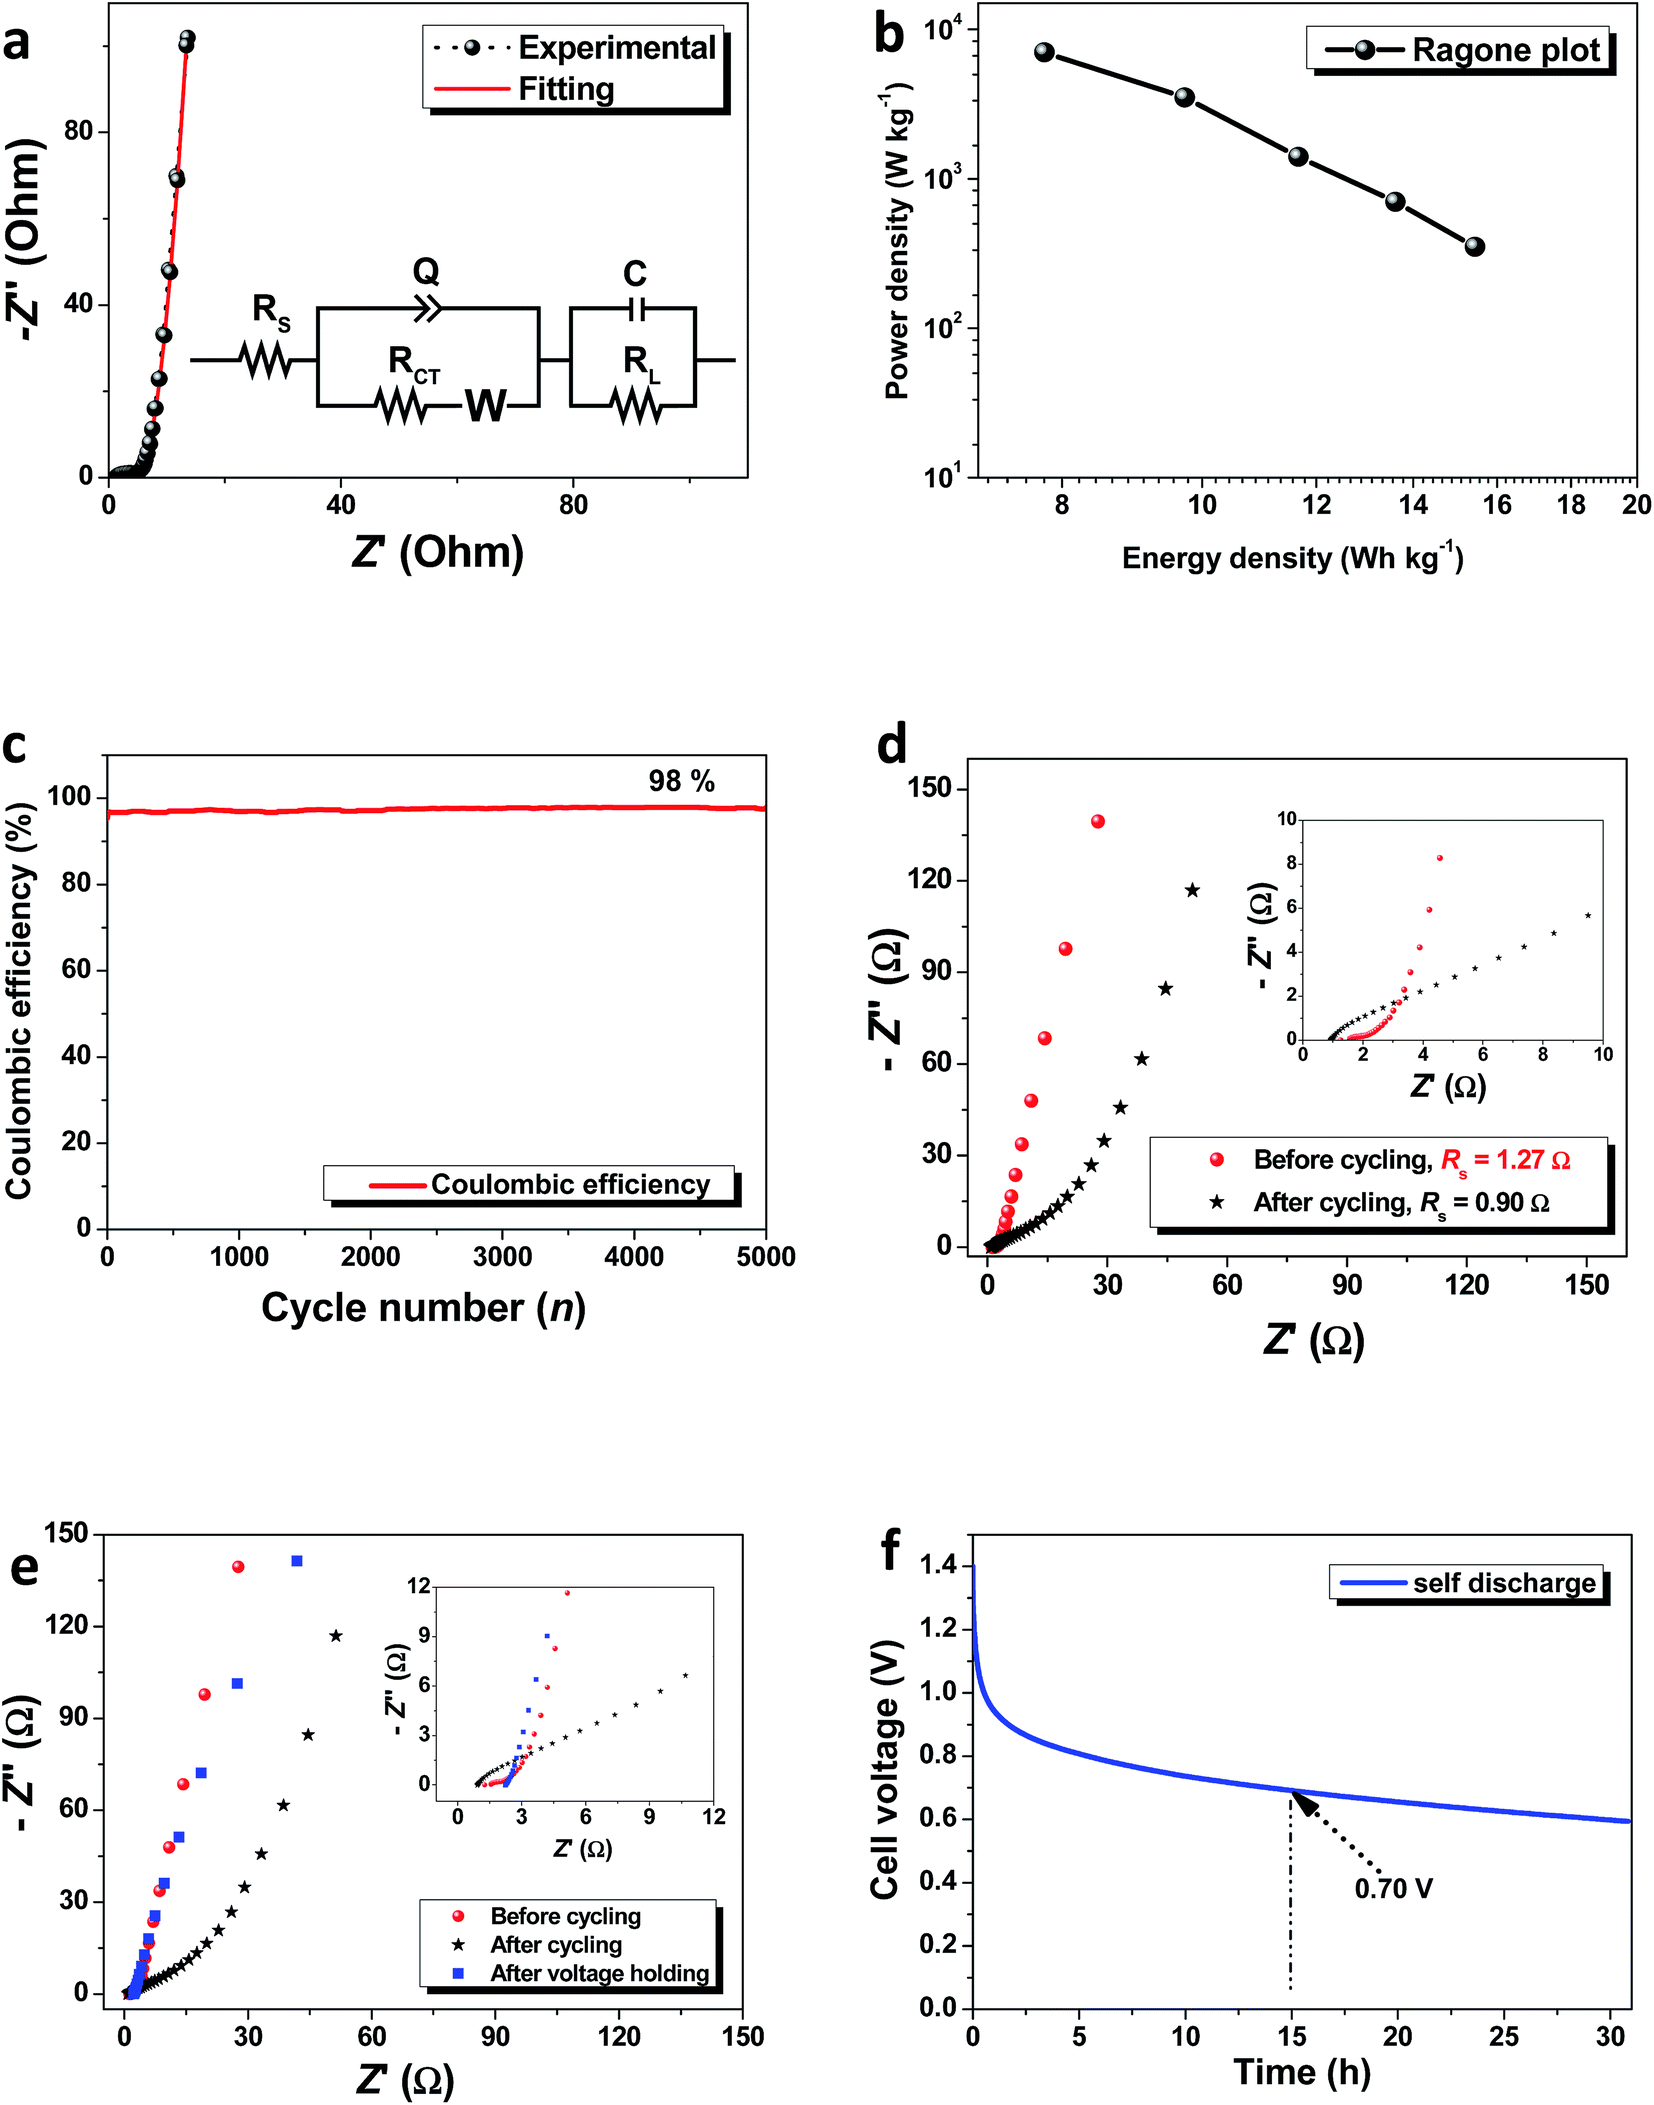 | ||
| Fig. 6 (a) Circuit fitting of EIS plot with experimental data; inset shows the equivalent series circuit based on the fitting data; (b) Ragone plot showing the energy density as a function of power density; (c) coulombic efficiency plot showing the device stability after 5000 charge–discharge cycles at 5 A g−1; (d) Nyquist plot before and after cycling for the symmetric ACB device; (e) combined Nyquist plots of the pristine symmetric ACB cell, after cycling and after 120 h voltage holding (f) self-discharge profile of the ACB symmetric cell over a 30 h period. | ||
| Electrode | Rs (Ω) | RCT (Ω) | C (F) | RL (Ω) | Q (F s(a−1)) |
|---|---|---|---|---|---|
a X2 = 0.02,  , Q ≡ CPE, a ≡ n. , Q ≡ CPE, a ≡ n. |
|||||
| ACB | 1.22 | 4.004 | 0.173 | 2.092 × 10¹² | 0.0071 |
The Ragone plot shown in Fig. 6b illustrates the variation of the power density (W kg−1) with energy density (W h kg−1). A maximum energy density of 15.45 W h kg−1 is obtained for a corresponding power density of 700 W kg−1 at 0.5 A g−1. These values are reasonable and comparable to results obtained for symmetric devices based on plant biomass.20,54,55 The extension of the operating voltage window to a value higher than those achievable in aqueous electrolytes (∼1.2 V) also makes the results vital considering that the ACB sample could only get to a value of 0.6 V in KOH aqueous electrolyte in previous study.22 Thus, the electrochemical performance of any energy storage material is dependent on both the specific intrinsic material properties as well as the actual device operating electrolyte.
The device stability was also studied by subjecting the symmetric cell to a continuous charge–discharge cycling at 5 A g−1 and further applying a constant current voltage-holding for 120 h. The results obtained from the stability tests are displayed in Fig. 6c–f and S1 of the ESI.† From the continuous cycling, a coulombic efficiency of 98% was still obtained after 5000 cycles (shown in Fig. 6c). EIS measurements was taken after the 5000th cycle was completed based on the fact that it is known to give an idea on the extent of electrode degradation in the SC device at any given time. The EIS plots before and after cycling (Fig. 6d) showed an improvement in the device ESR value (see figure inset) and this can be attributed to the exposure of more porous sites within the electrode material as a result of continuous cycling. Although there was a slight loss in the ideal capacitance as seen from the gradient of the Nyquist plot at low frequency region, the device still showed a reasonable amount of stability based on only a 2% loss in coulombic efficiency. This is likely due to loss of adhesion of the ACB material to the current collector as well as evolution of oxygen within the electrolyte. This can be reduced by improving the fabrication and testing conditions through nitrogen bubbling.48
The voltage holding process also showed the device capability to withhold a continuous maximum applied voltage for over 120 h (5 days) without dropping in voltage or complete device failure. The device efficiency as observed during the voltage holding test also remained slightly constant with little change (not shown). Based on the comparison with the ESR of the cell, the Nyquist plot was also analyzed after voltage holding. Fig. 6e compares the Nyquist plot before cycling (ESR = 1.27 Ω), after cycling (ESR = 0.90 Ω) and after voltage holding (ESR = 2.20 Ω). The inset to Fig. 3e clearly displays the cell's ESR values at the high frequency region. In the case of an additional voltage holding step carried out, there is an increase in the ESR value but this is coupled with a corresponding improvement in the electrochemical performance of the symmetric device based on the ideal capacitance in relation to the vertical nature of the Nyquist plot at lower frequencies.
This means that even though the voltage holding process degraded the cell in terms of its resistive property which is linked to ease of charge mobility, an extra voltage holding process improved its ideal capacitive features. In any case, after subjecting the device to such lengthy stability tests, it is expected that the condition of the electrolyte will be altered although this is not within the scope of the present study. Interestingly, the occurrence recorded after voltage holding tests is quite peculiar and requires further studies to fully understand this queer development. The Bode plot presented in Fig. S1† elucidates the observation by further analyzing the phase angle response as a function of frequency for the device after cycling and after voltage holding. Fig. S1† displays the Bode plot (phase angle as a function of frequency) which shows the device condition for the different stages of stability testing. It is seen that the device initially portrays a pure resistive–capacitive behavior as observed earlier from the Nyquist plots with the deviation from the vertical tendency in the low frequency (LF) region to give a phase angle (−66°) farther from the ideal −90° known for ideal capacitors.56 However, after the voltage holding test is performed, the phase angle in the LF region improves (−81°) closer to the ideal value and is comparable with the initial device condition (−83°) before cycling which confirms the improvement in observed device status from the Nyquist plot.
Initial propositions put forward by the authors suggest that the voltage holding step may likely act as a “healing” route which tries to bring the cell back to a better state although the electrolyte ions are depleted in both process which make the ESR value to increase in both cases. It has also been recently reported that voltage holding tests is a better way to examine device stability as compared to cyclic tests for long cycle numbers.57 A final and conclusive step of the self-discharge test was done to see the device ability to retain stored charge after being charged up to its maximum voltage. The device was charged to 1.4 V and held at that voltage for about an hour before being kept at open circuit potential to undergo self-discharge for a little over 30 h (>1 day). The initial abrupt drop in cell voltage is linked to water decomposition of any residual water molecules from the PKCB gel which is in contact with the cathode.58 This causes a loss in cell voltage even after the physical test fixture connection to the device is removed. The ideal model used to describe the cell discharge process has been fully elucidated in our earlier studies on activated carbons from other sources.59,60 This is linked to a diffusion-controlled process which leads to loss of accumulated ionic charges within the electrolyte when charged. The voltage profile is described by the polynomial equation as follows:
| V = Vo − mt0.5 | (2) |
A reasonable amount of the device voltage was retained after keeping the device to an open potential for up to 12 h (half day). Up to 50% of its original maximum voltage, V is still retained after self-discharging for a 15 h period which depicts a promising trend of the AC material for potential energy storage application.
4. Concluding remarks
The results from this study have illustrated an enhancement of the electrochemical performance of a symmetric capacitor based on activated carbon obtained from tree bark biomass waste. The choice of a polymer-gel active electrolyte with conductive additives was suggested based on the increment in both the device current response and the operating voltage which is seen to improve tremendously. The ACB//ACB symmetric device tested in a PKCB gel electrolyte exhibited a specific capacitance of 227 F g−1 with a corresponding energy density of 15.5 W h kg−1 and power density of 700 W kg−1 at 0.5 A g−1. The device also showed a 98% coulombic efficiency after 5000 charge–discharge cycles accompanied with an improvement in the capacitive characteristic after a voltage holding of 120 h based on the nature of the Nyquist plots before and after voltage holding. The self-discharge characteristic after testing for over a 30 h period shows up to 50% of its original voltage still retained on open circuit. This shows that the voltage drop in the device is simply a diffusion controlled process which is linked to the depletion of electrolyte ions. These interesting results show the potential in adopting the activated carbon from plant biomass waste (ACB) along with a polymer-gel mediated electrolyte with carbon acetylene black additive as cheaper and efficient materials for superior supercapacitor applications.Acknowledgements
This work is based on the research supported by the South African Research Chairs Initiative of the Department of Science and Technology, Republic of South Africa and National Research Foundation of South Africa (Grant no. 61056). Any opinion, finding, conclusion or recommendation expressed in this material is that of the author(s) and the NRF does not accept any liability in this regard. D. Momodu will like to acknowledge financial support from the National Research Foundation (NRF) and the University of Pretoria for his postdoctoral study. The authors will like to specially thank Dr Farshad Barzegar, University of Pretoria for his invaluable and fruitful discussions which contributed to the final preparation of this work.References
- M. S. Dresselhaus and I. L. Thomas, Nature, 2001, 414, 332–337 CrossRef CAS PubMed.
- M. Höök and X. Tang, Energy Policy, 2013, 52, 797–809 CrossRef.
- B. E. Conway, Electrochemical supercapacitors: Scientific fundamentals and technological applications, Kluwer Academic Publishers, Plenum Press, New York, 1999, vol. 53 Search PubMed.
- B. Dunn, H. Kamath and J.-M. Tarascon, Science, 2011, 334, 928–935 CrossRef CAS PubMed.
- P. Simon and Y. Gogotsi, Nat. Mater., 2008, 7, 845–854 CrossRef CAS PubMed.
- J. R. Miller and P. Simon, Science Magazine, 2008, 321, 651–652 CAS.
- R. Kötz and M. Carlen, Electrochim. Acta, 2000, 45, 2483–2498 CrossRef.
- Y. Zhu, S. Murali, M. D. Stoller, K. J. Ganesh, W. Cai, P. J. Ferreira, A. Pirkle, R. M. Wallace, K. A. Cychosz, M. Thommes, D. Su, E. A. Stach and R. S. Ruoff, Science, 2011, 332, 1537–1541 CrossRef CAS PubMed.
- R. W. Pekala, J. C. Farmer, C. T. Alviso, T. D. Tran, S. T. Mayer, J. M. Miller and B. Dunn, J. Non-Cryst. Solids, 1998, 225, 74–80 CrossRef CAS.
- J. Chmiola, C. Largeot, P.-L. Taberna, P. Simon and Y. Gogotsi, Science, 2010, 328, 480–483 CrossRef CAS PubMed.
- E. Frackowiak and F. Béguin, Carbon, 2002, 40, 1775–1787 CrossRef CAS.
- X. Cao, Y. Shi, W. Shi, G. Lu, X. Huang, Q. Yan, Q. Zhang and H. Zhang, Small, 2011, 7, 3163–3168 CrossRef CAS PubMed.
- P. T. Anastas and J. C. Warner, Green chemistry: theory and practice, Oxford university press, 2000 Search PubMed.
- E. Raymundo-Piñero, M. Cadek and F. Béguin, Adv. Funct. Mater., 2009, 19, 1032–1039 CrossRef.
- C. Peng, X. Bin Yan, R. T. Wang, J. W. Lang, Y. J. Ou and Q. J. Xue, Electrochim. Acta, 2013, 87, 401–408 CrossRef CAS.
- G. Ma, J. Li, K. Sun, H. Peng, E. Feng and Z. Lei, J. Solid State Electrochem., 2017, 21, 525–535 CrossRef CAS.
- M. Biswal, A. Banerjee, M. Deo and S. Ogale, Energy Environ. Sci., 2013, 6, 1249–1259 Search PubMed.
- Y. Zhang, F. Zhang, G.-D. Li and J.-S. Chen, Mater. Lett., 2007, 61, 5209–5212 CrossRef CAS.
- K. Karthikeyan, S. Amaresh, S. N. Lee, X. Sun, V. Aravindan, Y.-G. Lee and Y. S. Lee, ChemSusChem, 2014, 7, 1435–1442 CrossRef CAS PubMed.
- A. Bello, N. Manyala, F. Barzegar, A. A. Khaleed, D. Y. Momodu and J. K. Dangbegnon, RSC Adv., 2016, 6, 1800–1809 RSC.
- N. Manyala, A. Bello, F. Barzegar, A. A. Khaleed, D. Y. Momodu and J. K. Dangbegnon, Mater. Chem. Phys., 2015, 182, 139–147 CrossRef.
- D. Momodu, M. Madito, F. Barzegar, A. A Khaleed, O. Olaniyan, J. Dangbegnon and N. Manyala, J. Solid State Electrochem., 2017, 21, 859–872 CrossRef CAS.
- G. Xiong, A. Kundu and T. S. Fisher, in Thermal Effects in Supercapacitors, Springer International Publishing, 2015, pp. 11–26 Search PubMed.
- W. Lu, R. Hartman, L. Qu and L. Dai, J. Phys. Chem. Lett., 2011, 2, 655–660 CrossRef CAS.
- J. W. Long, D. Bélanger, T. Brousse, W. Sugimoto, M. B. Sassin and O. Crosnier, MRS Bull., 2011, 36, 513–522 CrossRef CAS.
- M. Galiński, A. Lewandowski and I. Stepniak, Electrochim. Acta, 2006, 51, 5567–5580 CrossRef.
- P. Hapiot and C. Lagrost, Chem. Rev., 2008, 108, 2238–2264 CrossRef CAS PubMed.
- C. Ramirez-Castro, C. Schütter, S. Passerini and A. Balducci, Electrochim. Acta, 2016, 206, 452–457 CrossRef CAS.
- G. P. Pandey and A. C. Rastogi, J. Electrochem. Soc., 2012, 159, A1664–A1671 CrossRef CAS.
- J. Y. Kim and I. J. Chung, J. Electrochem. Soc., 2002, 149, A1376–A1380 CrossRef CAS.
- C. C. Yang, S. T. Hsu and W. C. Chien, J. Power Sources, 2005, 152, 303–310 CrossRef CAS.
- C. Meng, C. Liu, L. Chen, C. Hu and S. Fan, Nano Lett., 2010, 10, 4025–4031 CrossRef CAS PubMed.
- S. Yamazaki, T. Ito, M. Yamagata and M. Ishikawa, Electrochim. Acta, 2012, 86, 294–297 CrossRef CAS.
- G. Lota, K. Fic and E. Frackowiak, Electrochem. Commun., 2011, 13, 38–41 CrossRef CAS.
- Y. Tian, R. Xue, X. Zhou, Z. Liu and L. Huang, Electrochim. Acta, 2015, 152, 135–139 CrossRef CAS.
- S. Roldán, M. Granda, R. Menéndez, R. Santamaría and C. Blanco, J. Phys. Chem. C, 2011, 115, 17606–17611 CrossRef.
- H. Yu, J. H. Wu, L. Q. Fan, Y. Z. Lin, S. H. Chen, Y. Chen, J. L. Wang, M. L. Huang, J. M. Lin, Z. Lan and Y. F. Huang, Sci. China: Chem., 2012, 55, 1319–1324 CrossRef CAS.
- Z. J. Zhang, Y. Q. Zhu, X. Y. Chen and Y. Cao, Electrochim. Acta, 2015, 176, 941–948 CrossRef CAS.
- Q. Li, K. Li, C. Sun and Y. Li, J. Electroanal. Chem., 2007, 611, 43–50 CrossRef CAS.
- S. T. Senthilkumar, R. K. Selvan and J. S. Melo, J. Mater. Chem. A, 2013, 1, 12386 RSC.
- Y. Mao, H. Duan, B. Xu, L. Zhang, Y. Hu, C. Zhao, Z. Wang, L. Chen and Y. Yang, Energy Environ. Sci., 2012, 5, 7950 Search PubMed.
- L. Wei, K. Tian, Y. Jin, X. Zhang and X. Guo, Microporous Mesoporous Mater., 2016, 227, 210–218 CrossRef CAS.
- H. Li, Z. Kang, Y. Liu and S.-T. Lee, J. Mater. Chem., 2012, 22, 24230 RSC.
- Q.-P. Luo, L. Huang, X. Gao, Y. Cheng, B. Yao, Z. Hu, J. Wan, X. Xiao and J. Zhou, Nanotechnology, 2015, 26, 304004 CrossRef PubMed.
- C. Zhang, K. B. Hatzell, M. Boota, B. Dyatkin, M. Beidaghi, D. Long, W. Qiao, E. C. Kumbur and Y. Gogotsi, Carbon, 2014, 77, 155–164 CrossRef CAS.
- Z. J. Lao, K. Konstantinov, Y. Tournaire, S. H. Ng, G. X. Wang and H. K. Liu, J. Power Sources, 2006, 162, 1451–1454 CrossRef CAS.
- W. Sugimoto, H. Iwata, K. Yokoshima, Y. Murakami and Y. Takasu, J. Phys. Chem. B, 2005, 109, 7330–7338 CrossRef CAS PubMed.
- Z. Fan, J. Yan, T. Wei, L. Zhi, G. Ning, T. Li and F. Wei, Adv. Funct. Mater., 2011, 21, 2366–2375 CrossRef CAS.
- D. Y. Momodu, F. Barzegar, B. Abdulhakeem, J. Dangbegnon, T. Masikhwa, J. Madito and N. Manyala, Electrochim. Acta, 2015, 151, 591–598 CrossRef CAS.
- J. E. B. Randles, Discuss. Faraday Soc., 1947, 1, 11 RSC.
- Y. Zhou, H. Xu, N. Lachman, M. Ghaffari, S. Wu, Y. Liu, A. Ugur, K. K. Gleason, B. L. Wardle and Q. M. Zhang, Nano Energy, 2014, 9, 176–185 CrossRef CAS.
- C. Masarapu, H. F. Zeng, K. H. Hung and B. Wei, ACS Nano, 2009, 3, 2199–2206 CrossRef CAS PubMed.
- H. Guan, L.-Z. Fan, H. Zhang and X. Qu, Electrochim. Acta, 2010, 56, 964–968 CrossRef CAS.
- H. Wang, Z. Xu, A. Kohandehghan, Z. Li, K. Cui, X. Tan, T. J. Stephenson, C. K. King'Ondu, C. M. B. Holt, B. C. Olsen and J. K. Tak, ACS Nano, 2013, 7, 5131–5141 CrossRef CAS PubMed.
- C. Ramasamy, J. Palma Del Vel and M. Anderson, J. Solid State Electrochem., 2014, 18, 2217–2223 CrossRef CAS.
- B. Abdulhakeem, B. Farshad, M. Damilola, T. Fatemeh, F. Mopeli, D. Julien and M. Ncholu, RSC Adv., 2014, 4, 39066 RSC.
- D. Weingarth, A. Foelske-Schmitz and R. Kötz, J. Power Sources, 2013, 225, 84–88 CrossRef CAS.
- L. Chen, H. Bai, Z. Huang, L. Li, J. Zhang, L. Zhang, A. Pirkle, R. M. Wallace, K. A. Cychosz, M. Thommes, D. Su, E. A. Stach and R. S. Ruoff, Energy Environ. Sci., 2014, 7, 1750–1759 Search PubMed.
- F. Barzegar, A. A. Khaleed, F. U. Ugbo, K. O. Oyeniran, D. Y. Momodu, A. Bello, J. K. Dangbegnon and N. Manyala, AIP Adv., 2016, 6, 115306 CrossRef.
- A. Bello, F. Barzegar, M. J. Madito, D. Y. Momodu, A. A. Khaleed, O. Olaniyan, T. M. Masikhwa, J. K. Dangbegnon and N. Manyala, ECS Trans., 2017, 6, 3–5 Search PubMed.
Footnote |
| † Electronic supplementary information (ESI) available. See DOI: 10.1039/c7ra05810a |
| This journal is © The Royal Society of Chemistry 2017 |