 Open Access Article
Creative Commons Attribution 3.0 Unported Licence
In situ synthesis and electromagnetic wave absorbing properties of sandwich microstructured graphene/La-doped barium ferrite nanocomposite
Tingkai Zhao *,
Wenbo Jin*,
Yixue Wang,
Xianglin Ji,
Huibo Yan,
Chuanyin Xiong,
Xufei Lou,
Alei Dang,
Hao Li and
Tiehu Li
State Key Laboratory of Solidification Processing, Shaanxi Engineering Laboratory for Graphene New Carbon Materials and Applications, School of Materials Science and Engineering, Northwestern Polytechnical University, Xi'an 710072, China. E-mail: ztk-xjtu@163.com; wenbo_jin@126.com
First published on 28th July 2017
Abstract
The development of high reflection loss and broad frequency bandwidth for electromagnetic wave absorbing materials has been pursued for a long time. Constructing a rational microstructure of an absorber will have significant impact on reflection loss increase and frequency bandwidth broadening. Herein, we successfully prepare a sandwich microstructured graphene/BaFe12O19 nanocomposite by an in situ auto-combustion method. Compared to pure BaFe12O19, the sandwich microstructured graphene/BaFe12O19 showed better electromagnetic wave absorbing properties. Furthermore, the sandwich microstructured graphene/Ba0.8La0.2Fe12O19 nanocomposite was prepared with La-doped BaFe12O19 using the same method. The obtained graphene/Ba0.8La0.2Fe12O19 nanocomposite exhibited a saturation magnetization of 26.55 emu g−1 at room temperature and exhibited excellent magnetic performance. The maximum reflection loss of the sandwich microstructured graphene/Ba0.8La0.2Fe12O19 nanocomposite with a thickness of 1 mm could reach up to −40.26 dB, and a frequency bandwidth value below −10 dB was observed up to 3.87 GHz within the frequency range of 2–18 GHz.
1. Introduction
With the rapid development of wireless communication technology, electromagnetic wave (EMW) pollution has become a serious environmental problem. High density of electromagnetic waves has a certain impact on human health, particularly in children and the elderly.1 Moreover, in the military field, stealth aircraft, armor and warships show greater viability than traditional equipment. To solve the EMW pollution problem and improve viability of military equipment, considerable interest has been focused to EMW absorbing materials with higher efficiency and wider bandwidths.2,3Graphene, two-dimensional planar sheets composed of sp2-bonded carbon atoms have drawn great attention due to their unique topological structures and properties.4 To date, several methods of synthesizing graphene have been developed, such as chemical vapor deposition (CVD), mechanical exfoliation and oxidation reduction. Graphene is a single-layer graphite compound with a high specific surface area, high temperature resistance, low weight, excellent electrical conductivity and great potential for application in various fields.5 Furthermore, due to its excellent dielectric properties and low density, it is potentially a good EMW absorbing material. However, impedance matching is an essential factor for good EMW absorption; the conductive and electromagnetic parameters of pure graphene prevent it from meeting the requirement of impedance matching, which results in strong reflection but weak absorption.6 Moreover, for a high-performance EMW absorbing material, excellent dielectric loss and magnetic loss are two important technical requirements. While graphene has excellent electrical conductivity and shows good dielectric loss, its magnetic loss is poor. Nevertheless, its electromagnetic properties can generally be improved by combining with some magnetic materials, such as magnetic metal powder, ferrite material and some other oxides. It is worth noting that ferrite material is a mature EMW absorbing material with numerous excellent properties.7,8 Barium ferrite (BaFe12O19) is one of the most versatile hard magnetic material. It is not only a magnetic medium but also a dielectric medium and exhibits good magnetic loss and dielectric loss. In addition, it has attractive magnetic properties, high Curie temperature, excellent chemical stability and low cost and has been widely used in the field of EMW absorption. Moreover, it can be prepared by a simple auto-combustion method.9 Pallab Bhattacharya et al.10 have prepared graphene/CuFe10Al2O19 composite by co-precipitation: in a metal salt solution, the metal oxides were precipitated on the surface of acid-treated graphene. However, this method is insufficient, complex and not environment friendly. Luo Kong et al.11 have prepared graphene/α-Fe2O3 nanocomposite through a troublesome process. The graphene oxide was dispersed in ethylene glycol and a certain amount of ferric chloride and anhydrous sodium acetate were added. After stirring, the mixture was placed in a Teflon-sealed autoclave and maintained at 160 °C for 12 h, and the product was isolated by magnetic separation. Finally, after washing the product, graphene/α-Fe2O3 nanocomposite was obtained. However, this method is too complex and the reaction process is difficult to control. Both methods mentioned above use graphite to prepare graphene, which is then combined with a ferrite material in a metal salt solution. They are troublesome and the ferrite particles are distributed on the surface of graphene unevenly. Furthermore, the EMW absorbing properties of these composites are not satisfactory. However, it should be noted that adjacent graphene layers are bound by weak van der Waals forces in graphite and expanded graphite (EG) has large sheet spacing, which provides a way to prepare graphene by second expansion of EG.12 EG has the property of absorbing oil, and the auto-combustion precursor of BaFe12O19 is an oily gel. Furthermore, when the oily gel forms BaFe12O19, it has a significant volume increase. Therefore, we can take advantage of these properties to in situ prepare a sandwich structure of graphene/BaFe12O19 nanocomposite. The oily gel can enter into the layers of EG and the latter will undergo secondary expansion to form graphene by an auto-combustion process using BaFe12O19 as the precursor. To our knowledge, the preparation and EMW absorbing properties of graphene/BaFe12O19 (G/BF) sandwich structured nanocomposite have not been reported previously.13–17
Herein, the graphene/BaFe12O19 sandwich structure nanocomposite is successfully prepared using an in situ auto-combustion method. Magnetic properties and EMW absorbing properties of the nanocomposite are studied. It is observed that the graphene/BaFe12O19 sandwich structured nanocomposite had significantly enhanced EMW absorbing performance compared to pure graphene and pure BaFe12O19. To obtain excellent EMW absorbing performance, La(NO3)3 is added to the BaFe12O19 precursor solution to prepare graphene/Ba0.8La0.2Fe12O19 (G/LBF) nanocomposite. The position of partial Ba2+ in the lattice is replaced by La3+ and it can be adjusted and optimized by electromagnetic parameters of the absorbing materials.
2. Experimental
2.1 Preparation of EG
A certain amount of natural flake graphite was mixed with a mixture of H2SO4 and HNO3 and stirred at room temperature for 1 h. Then, a small amount of KMnO4 was added to the mixture and stirred for 2 h. The product was washed several times with deionized water until the pH reached 4–7. After filtration, the black powder was dried in a vacuum oven to obtain graphite intercalated compound. Finally, the graphite intercalated compound was rapidly expanded at 800 °C in a muffle furnace to obtain EG.182.2 In situ synthesis of sandwich microstructured G/BF and G/LBF nanocomposite
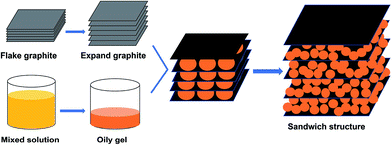
The sandwich microstructured G/BF and G/LBF nanocomposites were synthesized by an in situ auto-combustion method and the schematic is shown in Fig. 1. Fe(NO)3·9H2O, Ba(NO)2, La(NO3)3·6H2O and citric acid were taken as the raw materials. A certain amount of Fe(NO)3·9H2O and Ba(NO)2 was dissolved in deionized water to acquire a clear solution and the mole ratio of Fe3+ to Ba2+ was 12![[thin space (1/6-em)]](https://www.rsc.org/images/entities/char_2009.gif) :
:![[thin space (1/6-em)]](https://www.rsc.org/images/entities/char_2009.gif) 1. The citric acid was dissolved into an aqueous solution and then mixed with the nitrate solution acquired above. The molar ratio of citric acid and total moles of Fe3+ and Ba2+ was fixed at 2
1. The citric acid was dissolved into an aqueous solution and then mixed with the nitrate solution acquired above. The molar ratio of citric acid and total moles of Fe3+ and Ba2+ was fixed at 2![[thin space (1/6-em)]](https://www.rsc.org/images/entities/char_2009.gif) :
:![[thin space (1/6-em)]](https://www.rsc.org/images/entities/char_2009.gif) 1. An ammonia solution was added into the mixed solution slowly while stirring until the pH reached 7. The mixture was then placed in a water bath at 80 °C for 3 h and the temperature was increased to 120 °C to evaporate the water. The prepared EG was added with continuous stirring until the mixture appeared as an oily gel and the mass fraction of EG was 15%. The temperature was increased to 200 °C, and the mixture was bubbled up and automatically ignited. After the combustion reaction, fluffy black powder was obtained. Finally, the fluffy black powder was calcined at 800 °C for 3 h to obtain the G/BF sandwich structured nanocomposite.19 After the reaction, the black product was washed with HCl solution (2 M) several times to obtain graphene. When the molar ratio of Fe3+, Ba2+ and La3+ was 12
1. An ammonia solution was added into the mixed solution slowly while stirring until the pH reached 7. The mixture was then placed in a water bath at 80 °C for 3 h and the temperature was increased to 120 °C to evaporate the water. The prepared EG was added with continuous stirring until the mixture appeared as an oily gel and the mass fraction of EG was 15%. The temperature was increased to 200 °C, and the mixture was bubbled up and automatically ignited. After the combustion reaction, fluffy black powder was obtained. Finally, the fluffy black powder was calcined at 800 °C for 3 h to obtain the G/BF sandwich structured nanocomposite.19 After the reaction, the black product was washed with HCl solution (2 M) several times to obtain graphene. When the molar ratio of Fe3+, Ba2+ and La3+ was 12![[thin space (1/6-em)]](https://www.rsc.org/images/entities/char_2009.gif) :
:![[thin space (1/6-em)]](https://www.rsc.org/images/entities/char_2009.gif) 0.8
0.8![[thin space (1/6-em)]](https://www.rsc.org/images/entities/char_2009.gif) :
:![[thin space (1/6-em)]](https://www.rsc.org/images/entities/char_2009.gif) 0.2, the sandwich microstructured G/LBF nanocomposites could be obtained by a similar process.
0.2, the sandwich microstructured G/LBF nanocomposites could be obtained by a similar process.
2.3 Structural characterizations and microwave absorption measurements
For EMW parameter measurements, these nanocomposites were uniformly mixed with 75 wt% paraffin wax, and the compounds were poured into a planar rectangular mold and dried for about 24 hours in air. The prepared films were tailored precisely to the size of a rectangular waveguide (22.86 mm × 10.16 mm) for EMW parameter tests.The morphology and microstructure of these nanocomposites were characterized by a scanning electron microscope (SEM, FEINNS450, FEI) equipped with an energy dispersive spectrometer (EDS) and a transmission electron microscope (TEM, JEM-100CX11, FEI). Fourier transform infrared (FTIR) spectra were measured using Nicolet IS10 FTIR with KBr. Ultraviolet-visible absorption (UV-vis) spectra were measured using Lambda 35. The conductivity of the samples was obtained by a four-probe conductivity tester (5601Y). Raman spectra of samples were measured using a Lab RAM HR confocal Raman system with 532 nm diode laser excitation at room temperature. X-ray diffraction (XRD) (X'Pert Pro, PANalytical, with Cu Kα radiation) patterns were recorded to identify phase structure. The hysteresis loops of samples were measured using a vibrating sample magnetometer (VSM, Lake Shore 7410, Quantum Design). The reflection loss of these nanocomposites was measured by a vector network analyzer (VNA Agilent technologies E8362B; 10 MHz–20 GHz).
3. Results and discussion
3.1 Morphological characterization
The SEM images of EG, BaFe12O19, Ba0.8La0.2Fe12O19, G/LBF nanocomposite and graphene are shown in Fig. 2. Fig. 2(a) shows the microstructure of EG. It can be seen clearly that EG has a large slice spacing and there are several folds on the surface. The slice spacing is up to 2 μm and each graphite sheet may consist of hundreds of graphene layers. Moreover, the large slice provides the opportunity for the oily gel to enter in the graphite sheet spacing. BaFe12O19 particles are shown in Fig. 2(b). The sizes of BaFe12O19 particles are different, and the particles undergo a certain degree of agglomeration. Fig. 2(c) shows the microstructure of Ba0.8La0.2Fe12O19 particles. La-doped BaFe12O19 particles do not show any evident morphological changes. However, it should be noted that the dispersibility of La-doped particles becomes better. The sandwich microstructured G/LBF nanocomposite can be clearly seen in Fig. 2(d). Ba0.8La0.2Fe12O19 particles are located between graphene sheets, as shown in the labeled area. The surface of graphene exhibiting a transparent film has clear folds. Ba0.8La0.2Fe12O19 particles enwrapped with graphene are easily identified, and the distribution of these particles between the graphene sheets is fairly uniform. Fig. 2(e) shows an image of the edge of the sandwiched structure. There are numerous Ba0.8La0.2Fe12O19 particles between the graphene sheets, and some particles are also distributed on the graphene surface. The edge of the sandwiched structure can be clearly seen in the labeled area. Ba0.8La0.2Fe12O19 particles are embedded in the gaps between the graphene sheets, indicating that the oily gel has entered into the graphite layers successfully and the secondary expansion process of EG is adequate. The clear morphology of graphene is shown in Fig. 2(f). It exhibits a very thin transparent shape and is wrapped with Ba0.8La0.2Fe12O19 particles. Moreover, it seems the formation of Ba0.8La0.2Fe12O19 particles has a significant secondary expansion effect on the graphite sheets. The volume increase effect of Ba0.8La0.2Fe12O19 between the graphene sheets leads to an evident bulge phenomenon. Fig. 2(g) and (h) represent pure graphene. Fig. 2(g) shows large translucent graphene with several folds. It is very thin and exhibits a flexible sheet with a large surface. In addition, it can be found that there are some impurities on the surface of graphene. This may be because some ferrite particles have not been removed. The clear folds of graphene are shown in Fig. 2(h). Its surface is quite clean and distributed with numerous evident folds. Fig. 2(i) is the EDS spectrum image of the rectangular area selected in Fig. 2(f). There are five main elements and the mass ratio of each element is shown on the upper right corner. This result is in relative agreement with the theoretical value.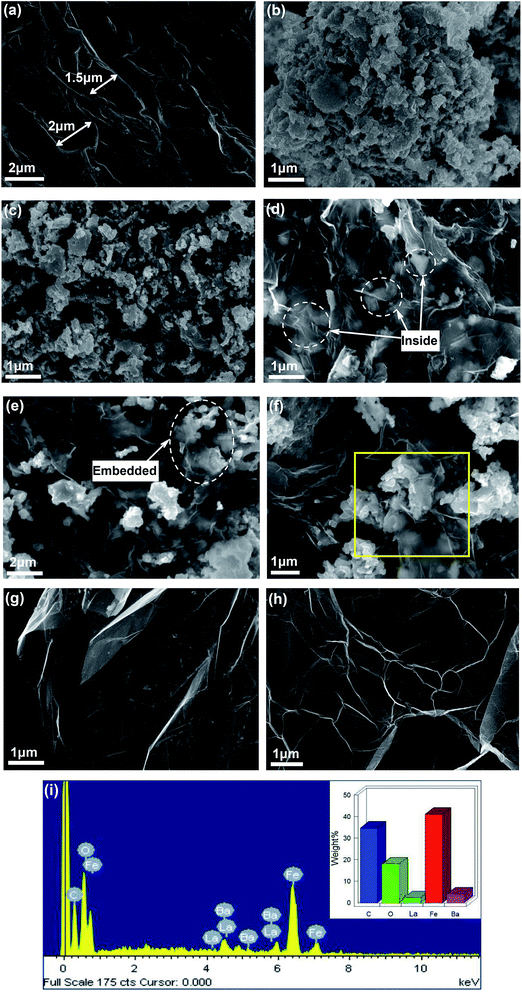 | ||
| Fig. 2 SEM images of (a) EG, (b) BaFe12O19, (c) Ba0.8La0.2Fe12O19, (d–f) G/LBF nanocomposite, (g–h) graphene and (i) EDS spectrum image of the rectangular area selected in (f). | ||
TEM images of G/LBF nanocomposite are shown in Fig. 3. It is clear that graphene with several folds shows a translucent film in Fig. 3(a). Ba0.8La0.2Fe12O19 particles have a uniform size and show no apparent agglomeration. In addition, it should be noted that these particles have different color depth. The light-colored particles are located between the sheets of graphene and the dark-colored ones are distributed on the graphene surface. Fig. 3(b) is the high magnification image of G/LBF nanocomposite. Ba0.8La0.2Fe12O19 particles with various sizes can be seen, and the mean size is about 100 nm. Furthermore, it can be easily noted that some of these particles are located between graphene sheets, while a small amount them are on the graphene surface. It is clear that graphene with numerous folds shows a translucent film, as shown in Fig. 3(c). The structure exhibits two graphene sheets stacked together, and shows a large surface and very low thickness.
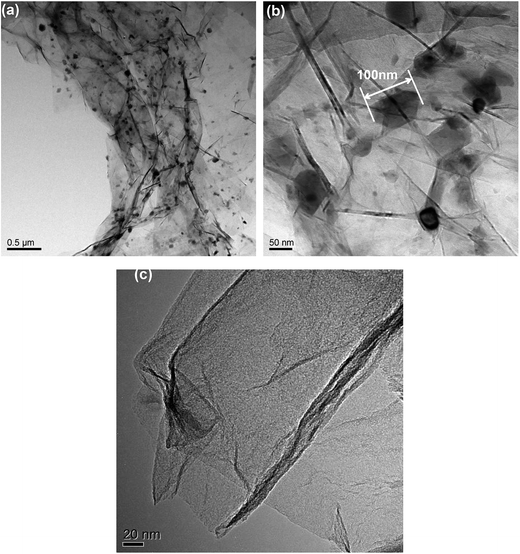 | ||
| Fig. 3 TEM images of (a) G/LBF nanocomposite, (b) high magnification of G/LBF nanocomposite and (c) graphene. | ||
Fig. 4(a) shows the XRD patterns of graphene, BaFe12O19, Ba0.8La0.2Fe12O19, and G/BF and G/LBF nanocomposites. The main diffraction peaks of BaFe12O19 are observed at 2θ values of 31.4°, 35.2°, 42.3°, 61.1° and 76.3° corresponding to the (110), (114), (205), (217) and (220) reflections, respectively.20 The observed peaks of BaFe12O19 are matched with the standard XRD pattern, indicating that BaFe12O19 is successfully synthesized by the auto-combustion method. The XRD pattern of Ba0.8La0.2Fe12O19 did not significantly change compared to the BaFe12O19 pattern. It means that La doping has no effect on the formation of BaFe12O19. Graphene exhibits a broad characteristic diffraction peak at 2θ = 26.20°, which is typical of multilayered graphene, indicating that EG has been peeled into multilayered graphene during the self-combustion and swelling of BaFe12O19. The XRD patterns of G/BF and G/LBF are similar, and these patterns have a peak at 2θ = 26.20°. EG is not completely converted to graphene during the auto-combustion process of Ba0.8La0.2Fe12O19. The peaks of Ba0.8La0.2Fe12O19 do not show a significant change in the G/LBF pattern, indicating that there is no chemical reaction between Ba0.8La0.2Fe12O19 and EG. The FTIR spectra of graphene and G/LBF nanocomposite are shown in Fig. 4(b). The relative apparent peaks of graphene are 1578 cm−1 and 936 cm−1, and there are no other evident peaks. The peak at 1578 cm−1 is the characteristic peak of the C![[double bond, length as m-dash]](https://www.rsc.org/images/entities/char_e001.gif) C bond in the sp2 structure of graphite, which means that there is a small amount of graphite in the graphene.21 This may be because the peeling of graphite is not complete. The characteristic peaks of G/LBF occur at 2930, 1578, 1450, 936 and 618 cm−1. The peak at 2930 cm−1 is attributed to the C–H stretching vibration, the C–N group is located at 1450 cm−1, and the peak at 2930 cm−1 represents some oxygen group.22 This may be due to the presence of some impurities after the combustion process of barium ferrite gel and the G/LBF nanocomposite is inorganic materials.
C bond in the sp2 structure of graphite, which means that there is a small amount of graphite in the graphene.21 This may be because the peeling of graphite is not complete. The characteristic peaks of G/LBF occur at 2930, 1578, 1450, 936 and 618 cm−1. The peak at 2930 cm−1 is attributed to the C–H stretching vibration, the C–N group is located at 1450 cm−1, and the peak at 2930 cm−1 represents some oxygen group.22 This may be due to the presence of some impurities after the combustion process of barium ferrite gel and the G/LBF nanocomposite is inorganic materials.
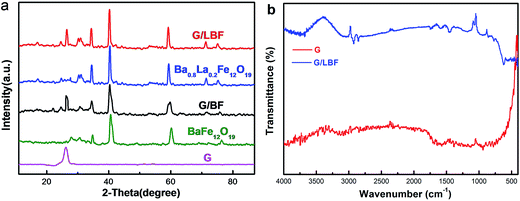 | ||
| Fig. 4 (a) XRD patterns of graphene, BaFe12O19, Ba0.8La0.2Fe12O19, and G/BF and G/LBF nanocomposite and (b) FTIR spectra of graphene and G/LBF nanocomposites. | ||
The crystal size of Ba0.8La0.2Fe12O19 particles can be calculated using the Debye–Scherrer formula: D = kλ/β![[thin space (1/6-em)]](https://www.rsc.org/images/entities/char_2009.gif) cos
cos![[thin space (1/6-em)]](https://www.rsc.org/images/entities/char_2009.gif) θ, where D is the average crystal size of particles, k is the shape factor, λ is the X-ray wavelength, θ is the half angle in degrees and β is the full width at half maximum. k is often assigned a value of 0.89, which depends on several factors, including Miller index of the reflecting plane and shape of the crystal.23 The (217) reflection of the observed X-ray data is chosen for calculating crystal size of Ba0.8La0.2Fe12O19 particles. The average size of the Ba0.8La0.2Fe12O19 particles calculated using the abovementioned equation is about 96 nm. It is in agreement with the average particle size as determined by TEM.
θ, where D is the average crystal size of particles, k is the shape factor, λ is the X-ray wavelength, θ is the half angle in degrees and β is the full width at half maximum. k is often assigned a value of 0.89, which depends on several factors, including Miller index of the reflecting plane and shape of the crystal.23 The (217) reflection of the observed X-ray data is chosen for calculating crystal size of Ba0.8La0.2Fe12O19 particles. The average size of the Ba0.8La0.2Fe12O19 particles calculated using the abovementioned equation is about 96 nm. It is in agreement with the average particle size as determined by TEM.
Fig. 5(a) shows the Raman spectra of the G/BF and G/LBF nanocomposites. The Raman spectra of these nanocomposites exhibit characteristic D, G and 2D bands at 1350 cm−1, 1580 cm−1 and 2680 cm−1, respectively. The G band is associated with E2g symmetry and is generated due to in-plane vibration of sp2 carbon atoms of graphene. The D band appears from a breathing mode of a K-point phonon of A1g symmetry and it implies the degree of graphene defects and irregularities. The 2D peak originates from the double-resonance Raman process of two phonons with opposite momentum. The intensity ratio of the D and G peaks (ID/IG) has been used as a measure of ordered and disordered degree in graphene.24 It can be seen that the Raman spectra of G/BF and G/LBF are almost the same. The value of ID/IG is quite high, indicating a highly disordered graphene. This is mainly because the auto-combustion process of Ba0.8La0.2Fe12O19 damages the microstructure of graphene to a certain degree. The peaks of BaFe12O19 are between 260 cm−1 and 700 cm−1, and they are similar to those of Ba0.8La0.2Fe12O19, as shown in Fig. 5(a).25 The optical properties of graphene and G/LBF are investigated using their UV-vis absorption spectra. As shown in Fig. 5(b), there is an absorption peak at a wavelength of 251 nm, corresponding to the transition of aromatic C–C bonds. The small peak for G/LBF at 223 nm may be caused by some impurities.26 In addition, it can be found that the G/LBF nanocomposite exhibits remarkable light absorption in the visible-light region.
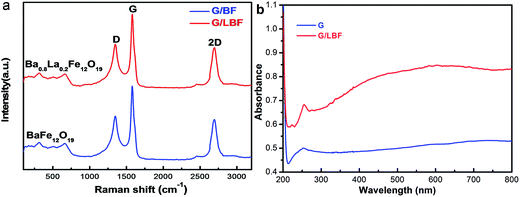 | ||
| Fig. 5 (a) Raman spectra of G/BF and G/LBF nanocomposites and (b) UV-vis absorption spectra of graphene and G/LBF nanocomposite. | ||
3.2 Magnetic properties
The hysteresis loops of BaFe12O19, G/BF nanocomposite, Ba0.8La0.2Fe12O19 and G/LBF nanocomposite were measured at room temperature, and the results are shown in Fig. 6(a). When H is infinite, the saturation magnetization (MS) value can be obtained from the M value. The coercive force (HC) and residual magnetization values can be obtained directly from the hysteresis loops.27 The MS value of BaFe12O19 is about 38.5 emu g−1, while that of Ba0.8La0.2Fe12O19 is 30.68 emu g−1. It means that La doping reduces saturation magnetization. G/BF has an MS value of about 34.26 emu g−1, which is lower than that of pure BaFe12O19. The MS value of G/LBF is about 26.55 emu g−1, which is also lower than that of pure Ba0.8La0.2Fe12O19. This is mainly due to the fact that non-magnetic graphene reduced magnetic saturation strength. From the enlarged image on the upper left corner of Fig. 6(a), it can be deduced that the coercivity of G/LBF is about 188.76 Oe, and the high coercivity is beneficial to magnetic loss at a relatively low frequency.28 Fig. 6(b) shows the conductivity of G/LBF nanocomposites with different contents of graphene. It is clear that the conductivity of the G/LBF nanocomposites increases with graphene content. It is because graphene has excellent conductivity and the ferrite materials are weakly conductive.29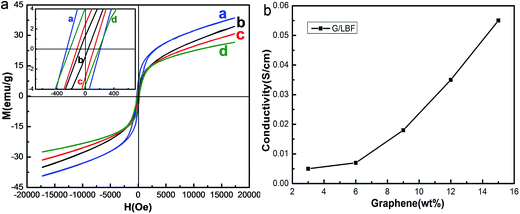 | ||
| Fig. 6 (a) Hysteresis loops of (a) BaFe12O19, (b) G/BF, (c) Ba0.8La0.2Fe12O19 and (d) G/LBF nanocomposite and (b) conductivity of G/LBF nanocomposites with different contents of graphene. | ||
3.3 Electromagnetic wave absorbing properties
The complex permittivity (ε′, ε′′) and complex permeability (μ′, μ′′) spectra of graphene, BaFe12O19, Ba0.8La0.2Fe12O19, G/BF and G/LBF nanocomposites vs. frequency in 2–18 GHz are shown in Fig. 7. The real part of complex permittivity and permeability is mainly associated with the amount of polarization occurring in the material and symbolizes the storage ability of the electric and magnetic energy, whereas the imaginary part accounts for dielectric and magnetic losses.30 The real part of complex permittivity spectra for different materials is shown in Fig. 7(a). Its overall trend decreases with increasing frequency. The value of graphene is the highest, because it has excellent electric conductivity. The spectra of BaFe12O19 and Ba0.8La0.2Fe12O19 are almost the same, and their values are very close. It illustrates that La doping does not have a significant effect on the dielectric real part. The spectra of G/BF and G/LBF are also similar, but their values are higher than those of pure BaFe12O19 and Ba0.8La0.2Fe12O19. It is mainly because ferrite conductivity in the latter is poor, and graphene improves the conductivity of these nanocomposites effectively. The imaginary part of complex permittivity spectra for different materials is shown in Fig. 7(b). The value of graphene is quite low, indicating poor dielectric loss. This is due to its bad impedance matching performance. Ba0.8La0.2Fe12O19 shows higher values than BaFe12O19, and it illustrates that La doping improved the dielectric constant. It is mainly due to the special electronic structure of rare earth elements, which increases the interaction with the electromagnetic wave. The G/BF and G/LBF with high values mean that they have strong dielectric capacity. Fig. 7(c) and (d) show the complex permeability spectra for different materials. The real and imaginary parts of graphene are 1 and 0, respectively, owing to the fact that graphene is non-magnetic. In Fig. 7(c), the real part value of Ba0.8La0.2Fe12O19 is higher than that of BaFe12O19, indicating that La doping improved magnetic property. Furthermore, a high real part value indicates good impedance matching and it facilitates more EMW entry into the composites.31 In addition, it should be noted that the value of G/BF nanocomposite is lower than that of pure BaFe12O19 and the value of G/LBF nanocomposite is lower than that of pure Ba0.8La0.2Fe12O19. This is because non-magnetic graphene occupies a certain proportion of the nanocomposites. The imaginary part of complex permeability is a measure of magnetic loss. Magnetic materials generate magnetic losses during the repeated magnetization and demagnetization process in the electromagnetic field and the magnetic loss intensity is related to EMW frequency.32 In Fig. 7(d), Ba0.8La0.2Fe12O19 exhibits a higher value than BaFe12O19, indicating a higher magnetic loss. Moreover, it can be found that magnetic loss property improved after combining with graphene. This is owing to the good impedance matching performance of these nanocomposites. As the frequency increases, the imaginary part value of complex permeability of G/BF increases, while that of G/LBF is relatively steady.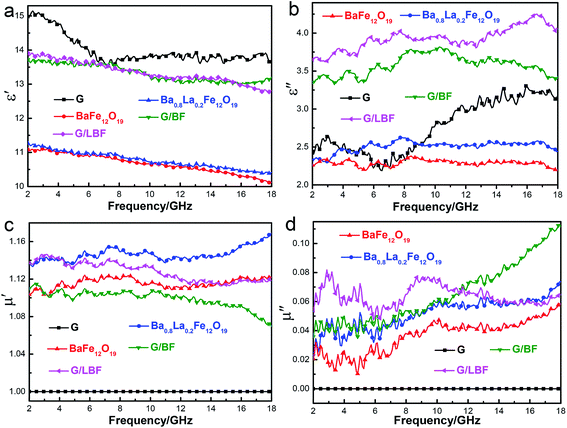 | ||
| Fig. 7 (a–b) Complex permittivity (ε′, ε′′) and (c–d) complex permeability (μ′, μ′′) spectra of graphene, BaFe12O19, Ba0.8La0.2Fe12O19, G/BF and G/LBF nanocomposite vs. frequency within 2–18 GHz. | ||
The loss tangent is a measure of electromagnetic loss capability for an absorbing material and a large loss tangent is generally expected. Fig. 8 shows the dielectric constant tangent (tan![[thin space (1/6-em)]](https://www.rsc.org/images/entities/char_2009.gif) δε = ε′′/ε′) and magnetic loss tangent (tan
δε = ε′′/ε′) and magnetic loss tangent (tan![[thin space (1/6-em)]](https://www.rsc.org/images/entities/char_2009.gif) δμ = μ′′/μ′) spectra of graphene, BaFe12O19, Ba0.8La0.2Fe12O19, G/BF and G/LBF nanocomposites vs. frequency within the frequency of 2–18 GHz. It should be noted that tan
δμ = μ′′/μ′) spectra of graphene, BaFe12O19, Ba0.8La0.2Fe12O19, G/BF and G/LBF nanocomposites vs. frequency within the frequency of 2–18 GHz. It should be noted that tan![[thin space (1/6-em)]](https://www.rsc.org/images/entities/char_2009.gif) δε is higher than tan
δε is higher than tan![[thin space (1/6-em)]](https://www.rsc.org/images/entities/char_2009.gif) δμ for the same material, regardless of frequency, indicating that reflection loss is mainly due to the dielectric constant. The tan
δμ for the same material, regardless of frequency, indicating that reflection loss is mainly due to the dielectric constant. The tan![[thin space (1/6-em)]](https://www.rsc.org/images/entities/char_2009.gif) δε of graphene is low, indicating poor EMW absorption performance. It may be due to the fact that impedance matching of pure graphene is poor. The tan
δε of graphene is low, indicating poor EMW absorption performance. It may be due to the fact that impedance matching of pure graphene is poor. The tan![[thin space (1/6-em)]](https://www.rsc.org/images/entities/char_2009.gif) δε of G/LBF shows the highest value and its average value is about 0.30, while that of G/BF is only about 0.27, as shown in Fig. 8(a). Furthermore, Ba0.8La0.2Fe12O19 exhibits a higher tan
δε of G/LBF shows the highest value and its average value is about 0.30, while that of G/BF is only about 0.27, as shown in Fig. 8(a). Furthermore, Ba0.8La0.2Fe12O19 exhibits a higher tan![[thin space (1/6-em)]](https://www.rsc.org/images/entities/char_2009.gif) δε than BaFe12O19, indicating that La doping improved the dielectric constant. The tan
δε than BaFe12O19, indicating that La doping improved the dielectric constant. The tan![[thin space (1/6-em)]](https://www.rsc.org/images/entities/char_2009.gif) δε of G/LBF shows a significant increase compared with that of Ba0.8La0.2Fe12O19, which means that G/LBF has better EMW absorption performance. This is mainly due to the excellent electrical conductivity of graphene and because the sandwiched microstructure of nanocomposite is conducive to multiple reflection of EMWs. In addition, good impedance matching of the nanocomposite is an important factor. In Fig. 8(b), it can be found that the spectra of tan
δε of G/LBF shows a significant increase compared with that of Ba0.8La0.2Fe12O19, which means that G/LBF has better EMW absorption performance. This is mainly due to the excellent electrical conductivity of graphene and because the sandwiched microstructure of nanocomposite is conducive to multiple reflection of EMWs. In addition, good impedance matching of the nanocomposite is an important factor. In Fig. 8(b), it can be found that the spectra of tan![[thin space (1/6-em)]](https://www.rsc.org/images/entities/char_2009.gif) δμ are similar to those of the imaginary part of complex permeability. The tan
δμ are similar to those of the imaginary part of complex permeability. The tan![[thin space (1/6-em)]](https://www.rsc.org/images/entities/char_2009.gif) δμ of graphene is zero, indicating that it has no magnetic loss capability, because graphene is a non-magnetic material. The G/LBF composite has a higher value and is relatively steady. The magnetic loss capability of La-doped BaFe12O19 is improved, and it shows a better magnetic loss capability after combination with graphene.33
δμ of graphene is zero, indicating that it has no magnetic loss capability, because graphene is a non-magnetic material. The G/LBF composite has a higher value and is relatively steady. The magnetic loss capability of La-doped BaFe12O19 is improved, and it shows a better magnetic loss capability after combination with graphene.33
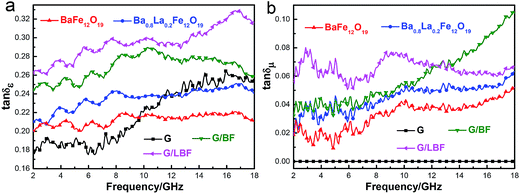 | ||
Fig. 8 (a) Dielectric constant tangent (tan![[thin space (1/6-em)]](https://www.rsc.org/images/entities/char_2009.gif) δε) and (b) magnetic loss tangent (tan δε) and (b) magnetic loss tangent (tan![[thin space (1/6-em)]](https://www.rsc.org/images/entities/char_2009.gif) δμ) spectra of graphene, BaFe12O19, Ba0.8La0.2Fe12O19, G/BF and G/LBF nanocomposites vs. frequency within 2–18 GHz. δμ) spectra of graphene, BaFe12O19, Ba0.8La0.2Fe12O19, G/BF and G/LBF nanocomposites vs. frequency within 2–18 GHz. | ||
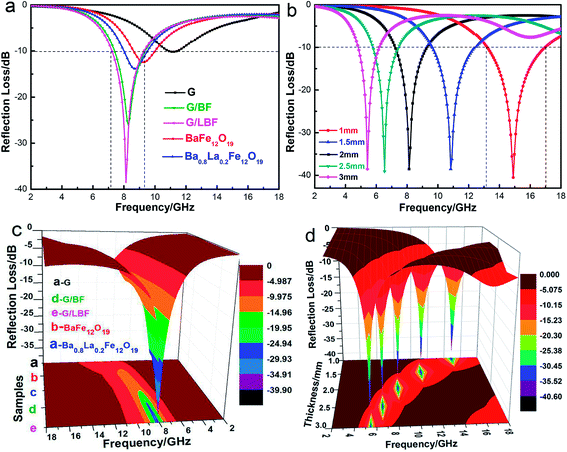
Table 1 shows the influence of graphene mass ratio on the electromagnetic wave absorbing properties of G/LBF nanocomposites with a thickness of 1 mm. It can be seen that EMW absorption performance of the G/LBF nanocomposites first increases and then decrease as graphene content increases. When the graphene mass ratio is 15%, it shows the best absorbing properties with a maximum value of −40.26 dB. But when the mass ratio of graphene reaches 20%, its performance is reduced. This may be because good impedance matching of the G/LBF nanocomposite is important and too much graphene is detrimental to its impedance matching performance.34
| Mass ratio (wt%) | Range (dB) | Maximum reflection loss (dB) | Bandwidth (GHz) |
|---|---|---|---|
| 0 | <−10 | −14.60 | 1.88 |
| 5 | <−10 | −19.13 | 2.27 |
| 10 | <−10 | −32.22 | 2.93 |
| 15 | <−10 | −40.26 | 3.87 |
| 20 | <−10 | −37.80 | 3.25 |
For a single-layer absorber, according to the transmission line theory, the calculation formulae are given as follows:
 | (1) |
 | (2) |
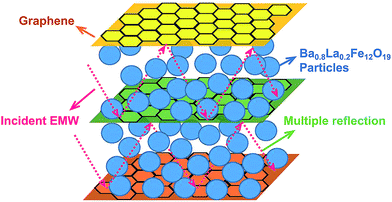
The experimental results mentioned above illustrate that the G/LBF composite has good impedance matching and complementarity between dielectric constant and magnetic loss. The schematic representation of EMW absorption mechanism in the G/LBF nanocomposite is shown in Fig. 10.39 The incident EMWs have several types of interactions in the nanocomposites. In addition to the excellent conductivity of graphene to increase the dielectric constant, Ba0.8La0.2Fe12O19 has good magnetism to increase the magnetic loss. Moreover, the sandwich structure is conducive to high losses of electromagnetic energy. It can be found that EMWs pass multiple reflections not only between the graphene sheets but also between the individual sandwiched microstructures of G/LBF. This process prolongs the propagation path of EMWs in the absorbers, and the multiple reflections of the microwave lead to high losses of electromagnetic energy. It is because the interaction of microwaves with dielectric materials intensifies molecular motions such as ionic conduction, bipolar polarization and relaxation. In addition, Ba0.8La0.2Fe12O19 particles between graphene sheets can consume magnetic loss effectively. The multiple reflections between graphene sheets are conducive for more microwaves to go through the ferrite particles and thus increase magnetic losses. Therefore, the construction of sandwich microstructured G/LBF is beneficial to increase electromagnetic performance.
4. Conclusions
The sandwich microstructured G/BF nanocomposite was successfully prepared through an in situ auto-combustion method and it showed better EMW absorbing properties compared to pure BaFe12O19. In addition, we doped BaFe12O19 with La and prepared the sandwich microstructured G/LBF. The sandwich microstructured G/LBF nanocomposite exhibited a saturation magnetization of 26.55 emu g−1 at room temperature. The maximum reflection loss of the sandwich microstructured G/LBF with a thickness of 1 mm could reach up to −40.26 dB and the frequency bandwidth value below −10 dB was up to 3.87 GHz in the frequency range of 2–18 GHz. The sandwich microstructured G/LBF may have extensive applications in military and electromagnetic pollution governance for its excellent EMW absorbing performance.Acknowledgements
This study was supported by the Natural Science Foundation of China (51572221, 51672221), the China Aeronautical Science Fund (2014ZF53074), the Natural Science Foundation of Shaanxi Province (2016JQ5108) and sponsored by the Seed Foundation of Innovation and Creation for Graduate Students in Northwestern Polytechnical University (Z2017011).References
- W. Li, J. Wei, W. Wang, D. Hu, Y. Li and J. Guan, Mater. Des., 2016, 110, 27–34 CrossRef CAS.
- Y. Orikasa, T. Ina, T. Nakao, A. Mineshige, K. Amezawa, M. Oishi, H. Arai, Z. Ogumi and Y. Uchimoto, J. Phys. Chem. C, 2011, 33, 115–117 Search PubMed.
- Y. Liu, Z. Zhang, S. Xiao, C. Qiang, L. Tian and J. Xu, Appl. Surf. Sci., 2011, 257, 7678–7683 CrossRef CAS.
- Y. Zhu, M. D. Stoller, W. Cai, A. Velamakanni, R. D. Piner, D. Chen and R. S. Ruoff, ACS Nano, 2015, 4, 1227–1233 CrossRef PubMed.
- X. Huang, Z. Yin, S. Wu, X. Qi, Q. He, Q. Zhang, Q. Yan, F. Boey and H. Zhang, Small, 2011, 7, 1876–1902 CrossRef CAS PubMed.
- F. Ren, H. Yu, L. Wang, M. Saleem, Z. Tian and P. Ren, RSC Adv., 2014, 4, 14419–14431 RSC.
- C. Wang, X. Han, P. Xu, X. Zhang, Y. Du, S. Hu, J. Wang and X. Wang, Appl. Phys. Lett., 2011, 98, 072906 CrossRef.
- J. Zhao, Y. Xie, D. Guan, H. Hua, R. Zhong, Y. Qin, J. Fang, H. Liu and J. Chen, Sci. Rep., 2015, 5, 12544 CrossRef CAS PubMed.
- D. A. Vinnik, D. A. Zherebtsov, L. S. Mashkovtseva, S. Nemrava, A. S. Semisalova, D. M. Galimov, S. A. Gudkova, I. V. Chumanov, L. Isaenko and R. Niewa, J. Alloys Compd., 2015, 628, 480–484 CrossRef CAS.
- P. Bhattacharya, S. Dhibar, G. Hatui, A. Mandal, T. Das and C. K. Das, RSC Adv., 2014, 4, 17039–17053 RSC.
- L. Kong, X. Yin, Y. Zhang, X. Yuan, Q. Li, F. Ye, L. Cheng and L. Zhang, J. Phys. Chem. C, 2013, 117, 19701–19711 CAS.
- P. Avouris and C. Dimitrakopoulos, Mater. Today, 2012, 15, 86–97 CrossRef CAS.
- Z. Durmus, A. Durmus and H. Kavas, J. Mater. Sci., 2015, 50, 1201–1213 CrossRef CAS.
- M. Maddahfar, M. Ramezani and S. M. Hosseinpour-Mashkani, Appl. Phys. A, 2016, 122, 1–9 CrossRef CAS.
- T. Wang, Y. Li, L. Wang, C. Liu, S. Geng, X. Jia, F. Yang, L. Zhang, L. Liu and B. You, RSC Adv., 2015, 5, 60114–60120 RSC.
- F. Ren, G. Zhu, P. Ren, K. Wang, X. Cui and X. Yan, Appl. Surf. Sci., 2015, 351, 40–47 CrossRef CAS.
- J. Zhao, Y. Xie, M. Li, F. Xu, Z. Le, Y. Qin, D. Zhou, Z. Wang, H. Xu and J. Pan, Compos. Sci. Technol., 2014, 99, 147–153 CrossRef CAS.
- S. R. Dhakate, N. Chauhan, S. Sharma, J. Tawale, S. Singh, P. D. Sahare and R. B. Mathur, Carbon, 2011, 49, 1946–1954 CrossRef CAS.
- A. Ohlan, K. Singh, A. Chandra and S. K. Dhawan, ACS Appl. Mater. Interfaces, 2010, 2, 927–933 CAS.
- J. Zhang, J. Fu, F. Li, E. Xie, D. Xue, N. J. Mellors and Y. Peng, ACS Nano, 2012, 6, 2273–2281 CrossRef CAS PubMed.
- Y. Xie, X. Hong, C. Yu, M. Li, Y. Huang, Y. Gao, J. Zhao, S. Yan, L. Shi and K. Zhang, Compos. Sci. Technol., 2013, 77, 8–13 CrossRef CAS.
- Y. Xie, J. Zhao, Z. Le, M. Li, J. Chen, Y. Gao, Y. Huang, Y. Qin, R. Zhong and D. Zhou, Compos. Sci. Technol., 2014, 99, 141–146 CrossRef CAS.
- P. Anithakumari, B. P. Mandal, E. Abdelhamid, R. Naik and A. K. Tyagi, RSC Adv., 2016, 6, 16073–16080 RSC.
- R. Saito, M. Hofmann, G. Dresselhaus, A. Jorio and M. S. Dresselhaus, Adv. Phys., 2011, 60, 413–550 CrossRef CAS.
- Y. Fu, Y. Wan, H. Xia and X. Wang, J. Power Sources, 2012, 213, 338–342 CrossRef CAS.
- Z. Hu, S. Lua, X. Yan and T. Lim, RSC Adv., 2015, 5, 86891–86900 RSC.
- C. Li, B. Huang and J. Wang, J. Mater. Sci., 2013, 48, 1702–1710 CrossRef CAS.
- F. Mazaleyrat, A. Pasko, A. Bartok and M. Lobue, J. Appl. Phys., 2011, 109, 331–333 CrossRef.
- X. Hong, Y. Xie, X. Wang, M. Li, Z. Le, Y. Gao, Y. Huang, Y. Qin and Y. Ling, Compos. Sci. Technol., 2015, 117, 215–224 CrossRef CAS.
- B. Zhong, T. Sai, L. Xia, Y. Yu and G. Wen, Mater. Des., 2017, 121, 185–193 CrossRef CAS.
- Y. Xie, X. Hong, X. Wang, J. Zhao, Y. Gao, Y. Ling, S. Yan, L. Shi and K. Zhang, Synth. Met., 2012, 162, 1643–1647 CrossRef CAS.
- Q. Li, J. Pang, B. Wang, D. Tao, X. Xu, S. Li and J. Zhai, Adv. Powder Technol., 2013, 24, 288–294 CrossRef CAS.
- S. Kumar, R. R. Nair, P. B. Pillai, S. N. Gupta, M. A. Iyengar and A. K. Sood, ACS Appl. Mater. Interfaces, 2014, 6, 17426–17436 CAS.
- J. Zhao, J. Yu, Y. Xie, Z. Le, X. Hong, S. Ci, J. Chen, X. Qing, W. Xie and Z. Wen, Sci. Rep., 2016, 6, 20496 CrossRef PubMed.
- X. Ren, H. Fan and Y. Cheng, Appl. Phys. A, 2016, 122, 1–7 CrossRef CAS.
- D. Sarkar, A. Bhattacharya, P. Nandy and S. Das, Mater. Lett., 2014, 1, 259–262 CrossRef.
- Y. Sun, F. Xiao, X. Liu, C. Feng and C. Jin, RSC Adv., 2013, 3, 22554–22559 RSC.
- F. Qin and C. Brosseau, J. Appl. Phys., 2012, 111, 61301–61324 CrossRef.
- N. Yousefi, X. Sun, X. Lin, X. Shen, J. Jia, B. Zhang, B. Tang, M. Chan and J. K. Kim, Adv. Mater., 2014, 26, 5480–5487 CrossRef CAS PubMed.
| This journal is © The Royal Society of Chemistry 2017 |

