 Open Access Article
Creative Commons Attribution 3.0 Unported Licence
Graphitic carbon nitride nanosheets obtained by liquid stripping as efficient photocatalysts under visible light
Chengkong Fana,
Jilin Miaob,
Guangqing Xu *ac,
Jiaqin Liubc,
Jun Lvac and
Yucheng Wu
 *abc
*abc
aSchool of Materials Science and Engineering, Hefei University of Technology, Hefei 230009, China. E-mail: gqxu1979@hfut.edu.cn; ycwu@hfut.edu.cn; Tel: +86 551 62901372
bIndustry & Equipment Technology, Institute of Hefei University of Technology, Hefei 230009, China
cKey Laboratory of Advanced Functional Materials and Devices of Anhui Province, Hefei University of Technology, Hefei 230009, China
First published on 26th July 2017
Abstract
Herein, well-scattered g-C3N4 nanosheets were obtained using a liquid stripping method in an ammonia solution at various temperatures. The phase structures, morphologies, and elemental compositions were characterized by X-ray diffraction, transmission electron microscopy, X-ray photoelectron spectroscopy, Raman spectra, and Fourier transform infrared spectroscopy. The nanosheets with sizes of several hundred nanometers can be obtained via liquid stripping. The photocatalytic performance of the g-C3N4 nanosheets was measured by degrading RhB under visible-light illumination. The g-C3N4 (30) nanosheets can achieve the highest degradation rate of 88% in 60 min, which is 5 times that of bulk g-C3N4. The mechanisms of the enhancement were studied by discussing the whole photocatalytic process. It has been observed that high specific surface area plays a key role in enhancing the photocatalytic performance.
1 Introduction
Recently, the increasing global crisis of environmental issues has become a serious threat to the long-term development of human society. The application of TiO2 as a classic semiconductor photocatalyst has been studied for a long time.1 Recently, a new metal-free semiconductor graphic carbon nitride (g-C3N4) has been identified as a potential photocatalyst under visible-light illumination2,3 for various processes including hydrogen evolution from water splitting,4 CO2 reduction into hydrocarbon fuels,5 organic compounds degradation,6 and so on. The reason for the popularity of g-C3N4 among many scholars is its high chemical stability and appealing electronic structure.7,8 The band gap of g-C3N4 is approximately 2.70 eV with a valence band and conduction band at +1.60 and −1.10 eV, respectively.9 It is in fact a graphite-like layered material with weak van der Waals forces between layers.10 However, bulk g-C3N4 obtained using thermal polycondensation shows heavy agglomeration, which is adverse for photocatalytic applications.Many methods, such as photocatalyst coupling,11,12 elemental doping,13–15 morphology control,16,17 and exfoliation,18–21 have been used for enhancing the photocatalytic performance of g-C3N4. Inspired by the huge success of graphene exfoliated from bulk graphite, the rational extension of the graphene strategy to layered g-C3N4 is possible. Zhang et al. reported the preparation of g-C3N4 nanosheets using water as a solvent during ultrasonication. The nanosheets with a thickness of 2.5 nm showed extremely high PL quantum yield of up to 19.6%.22 Sano et al. treated melamine-derived g-C3N4 with a NaOH solution. The grain size of the treated g-C3N4 was significantly reduced along with the formation of a mesoporous structure, and the surface area was enlarged from ca. 8 to 65 m2 g−1.23 Zhao et al. combined the thermal exfoliation method with sonication process in organic solvents that resulted in single-atomic-layer g-C3N4 nanosheets with higher photocurrent and lower charge-transfer resistance as compared to bulk g-C3N4.24,25 However, there are many deficiencies in these stripping methods, for instance, the small yield of g-C3N4 nanosheets, complex experimental methodology, and long experimental period.
Herein, we present g-C3N4 nanosheets fabricated by an easy and environmentally friendly method of liquid stripping in an ammonia solution; this method is believed to be an efficient way for developing g-C3N4 nanosheets as photocatalysts for environmental remediation.
2 Experimental
2.1 Chemicals and instruments
Melamine (C3H6N6), ammonia water (NH3·H2O), ethyl alcohol (C2H6O), and rhodamine B (RhB) were purchased from Sinopharm Chemical Reagent company. All reagents are analytical reagent (AR) and used without further purification.An X-ray diffractometer (D/MAX2500 V) with Cu Kα radiation was used to measure the phase structures of the samples, and the range of 2θ was from 5° to 90°. A JEM-2100F high-resolution transmission electron microscope was used to observe the morphologies of the samples. An ESCALAB 250 photoelectron spectrometer with a monochromatic Al Kα X-ray beam (1486.60 eV) was used for elemental analysis. An FTIR spectrometer (Nicolet 6700) was used to investigate the functional groups of the samples. Raman spectroscopy of the samples was conducted using an HR Evolution spectrometer with a 785 nm laser; a diffuse reflectance spectrometer (UV3600, Shimadzu) with BaSO4 as the reference was used to investigate the optical absorption performance of the samples.
Photocatalytic tests were completed using an XPA-7 photochemical reactor (Nanjing Xujiang Machine-electronic Company, China). A 250 W metal halide lamp with UV light filters removing light shorter than 420 nm was used as the visible-light source.
2.2 Synthesis
Bulk g-C3N4 was synthesized by heating melamine in a muffle furnace (OTF-1200X) at 550 °C for 4 h at a heating rate of 8 °C min−1. A luminous yellow product was obtained and defined as bulk g-C3N4.The stripping of g-C3N4 was conducted by treating the bulk g-C3N4 in an ammonia solution at different temperatures, and a schematic of the process is shown in Fig. 1. Briefly, 200 mg of bulk g-C3N4 was dispersed in 25 mL of ammonia solution and the dispersion was placed in a Teflon-lined high pressure reaction kettle. Then, the reaction kettle was sealed and placed in an oven at a certain temperature for 8 h. Finally, the g-C3N4 nanosheets were obtained via centrifuging and rinsing the suspension. The g-C3N4 nanosheets obtained at various temperatures of 30, 60, 80, and 100 °C were defined as g-C3N4 (30), g-C3N4 (60), g-C3N4 (80), and g-C3N4 (100) nanosheets, respectively.
2.3 Photocatalytic properties
Rhodamine B (RhB) was used to evaluate the photocatalytic performance of the g-C3N4 nanosheets. In a typical procedure, 10 mg photocatalysts were dispersed in 10 mL of RhB solution at a concentration of 10 mg L−1. The suspension was vigorously stirred for 30 min to achieve an adsorption/desorption equilibrium in the dark. A 250 W metal halide lamp with UV light filters (420 nm) was used as the visible-light source. An XPA-7 photochemical reactor was used for the photocatalytic reactions. The distance between the solution and the lamp was 10 cm. Every 30 min, a test tube was taken out, and the suspended liquid was centrifuged. Then, a UV1800 spectrometer was used to measure the clear solution, and the remaining concentration of RhB could be obtained.3 Results and discussion
3.1 Characterization
Fig. 2 shows the X-ray diffraction (XRD) patterns of bulk g-C3N4 and the g-C3N4 nanosheets obtained at different temperatures. Herein, two typical diffraction peaks were observed in all the samples. The strong peak at 27.83° can be indexed as the diffraction peak of the (002) lattice plane, originating from the characteristic interlayer periodic stacking along the c-axis in graphitic carbon nitride.26 The weak diffraction peak at 12.94° corresponds to the (100) lattice plane of g-C3N4 with a plane spacing of 0.680 nm, corresponding to the in-plane structural packing motif or the heptazine units.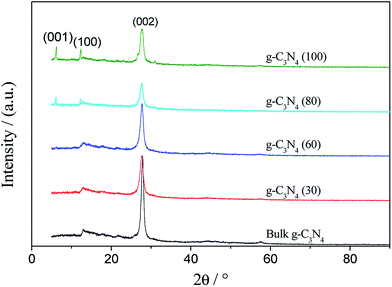 | ||
| Fig. 2 The XRD patterns of bulk g-C3N4 and the g-C3N4 nanosheets prepared at different temperatures. | ||
When compared with those of bulk g-C3N4, the diffraction peak positions of all g-C3N4 nanosheets are almost the same, indicating the same interplanar spacing of the (002) planes. Apparently, the (002) diffraction peaks are in good agreement with those of the previously reported g-C3N4;27 this indicates that the g-C3N4 nanosheets still retain a layered structure after being treated with the ammonia solution. In addition, the intensity of the (002) peak significantly decreases after liquid stripping; this demonstrates the thin layer of g-C3N4 nanosheets with short periodicity.
The g-C3N4 nanosheets show a new diffraction peak at 6.22° when the temperature is 60 °C; this peak may be attributed to the (001) lattice plane with the d-spacing of 1.421 nm.28 The peak intensity increases with temperature ranging from 60 to 100 °C. Especially, the narrow peaks of the (001) and (100) lattice planes in the g-C3N4 (100) nanosheets indicate the good crystallization of this product.
The morphologies of bulk g-C3N4 and the g-C3N4 nanosheets were observed by transmission electron microscopy (TEM), as shown in Fig. 3. Fig. 3(i) shows the morphology of bulk g-C3N4 without further treatment. Only large agglomerates with the sizes of several micrometers can be observed in the TEM images of bulk g-C3N4.
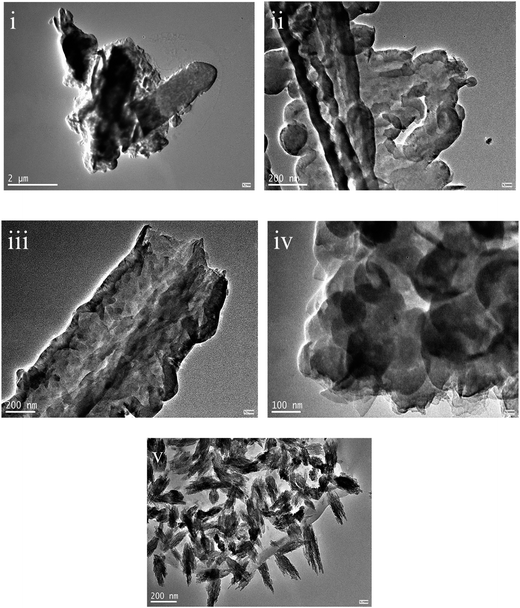 | ||
| Fig. 3 The TEM morphologies of bulk g-C3N4 (i) and the g-C3N4 nanosheets obtained at different temperatures of 30 °C (ii), 60 °C (iii), 80 °C (iv), and 100 °C (v). | ||
The morphologies of the liquid stripping products obtained at different temperatures are shown in Fig. 3(ii)–(v). The g-C3N4 (30) and g-C3N4 (60) nanosheets show similar morphologies as the bulk g-C3N4. However, the stripping traces of the nanosheets on the large agglomerates can be observed, as shown in Fig. 3(ii) and (iii). The morphologies of g-C3N4 (80) and the g-C3N4 (100) nanosheets significantly changed, as shown in Fig. 3(iv) and (v). The nanosheets with the sizes of several hundred nanometers were observed in the g-C3N4 (80) sample. The thickness of the nanosheets is difficult to determine because the nanosheets are lying flat. Many rise-like nanoparticles can be observed in the g-C3N4 (100) sample, which are assembled from fine g-C3N4 nanosheets.
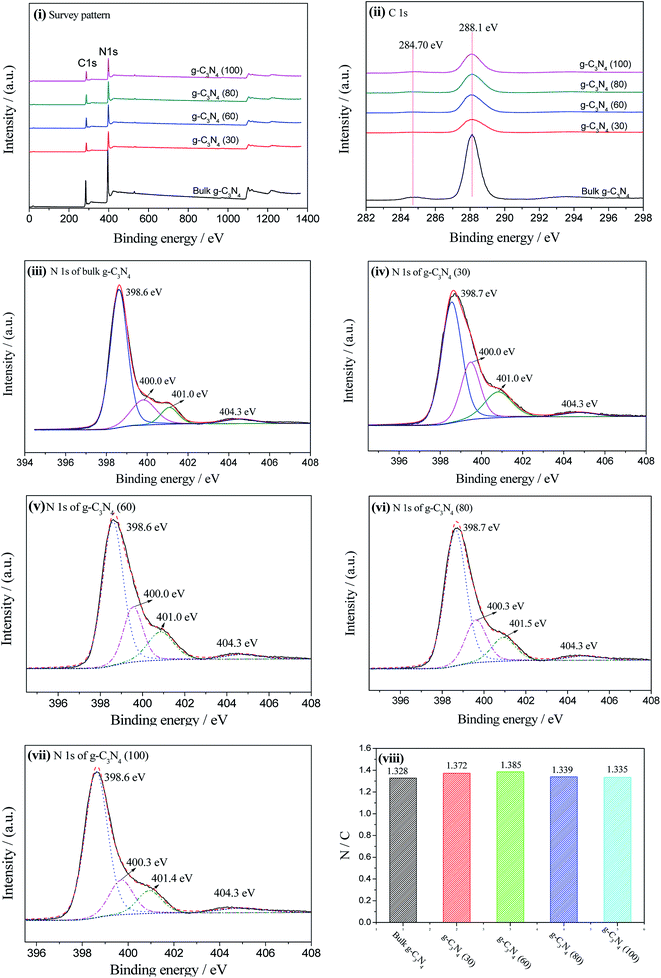
The elemental compositions of different samples were analyzed by XPS, as shown in Fig. 4. Fig. 4(i) shows the survey patterns of bulk g-C3N4 and the g-C3N4 nanosheets, from which it can be seen that g-C3N4 is primarily composed of carbon and nitrogen. In addition, the peak intensities of the g-C3N4 nanosheets were significantly lower than that of bulk g-C3N4; this could be ascribed to the layered loose structure produced by the stripping process. To gain insight into the chemical bonds between the carbon and nitrogen elements in g-C3N4, the high-resolution patterns of the C 1s and N 1s spectra were further decomposed into Gaussian–Lorentzian peaks, respectively. Fig. 4(ii) shows the high-resolution patterns of C 1s, from which two peaks at 288.1 eV and 284.7 eV can be observed. The former can be assigned to the sp2-hybridized carbon in the N-containing aromatic ring (N–C![[double bond, length as m-dash]](https://www.rsc.org/images/entities/char_e001.gif) N),29 which is the major aromatic carbon species in the polymeric g-C3N4. The latter is typically assigned to impurity of carbon such as C
N),29 which is the major aromatic carbon species in the polymeric g-C3N4. The latter is typically assigned to impurity of carbon such as C![[double bond, length as m-dash]](https://www.rsc.org/images/entities/char_e001.gif) C or grease. Moreover, the high-resolution patterns of N 1s were also decomposed into four different peaks with the binding energies at approximately 398.6, 400.0, 401.0, and 404.3 eV, respectively, as shown in Fig. 4(iii)–(vi), which could be assigned to the sp2-hybridized nitrogen involved in the tri-s-triazine ring (C–N
C or grease. Moreover, the high-resolution patterns of N 1s were also decomposed into four different peaks with the binding energies at approximately 398.6, 400.0, 401.0, and 404.3 eV, respectively, as shown in Fig. 4(iii)–(vi), which could be assigned to the sp2-hybridized nitrogen involved in the tri-s-triazine ring (C–N![[double bond, length as m-dash]](https://www.rsc.org/images/entities/char_e001.gif) C), the tertiary nitrogen N–(C)3 group, the hydrogen-bearing amine C–N–H group, and the charge effects or positive charge localization in the heterocycles, respectively.30
C), the tertiary nitrogen N–(C)3 group, the hydrogen-bearing amine C–N–H group, and the charge effects or positive charge localization in the heterocycles, respectively.30
Table 1 is the peak information of N 1s obtained from the Gaussian decomposition shown in Fig. 4(iii)–(vi), including the peak position, full width at half maximum (FWHM), and peak area and percentage.
| Sample | Parameter | ||||
|---|---|---|---|---|---|
| Position (eV) | FWHM (eV) | Area | Percentage (%) | ||
| Bulk g-C3N4 | C–N–C | 398.6 | 0.99 | 91![[thin space (1/6-em)]](https://www.rsc.org/images/entities/char_2009.gif) 563.29 563.29 |
71.99 |
| N–(C)3 | 400.0 | 1.44 | 24![[thin space (1/6-em)]](https://www.rsc.org/images/entities/char_2009.gif) 229.73 229.73 |
19.05 | |
| C–N–H | 401.1 | 1.01 | 11![[thin space (1/6-em)]](https://www.rsc.org/images/entities/char_2009.gif) 400.55 400.55 |
8.96 | |
| g-C3N4 (30) | C–N–C | 398.7 | 1.16 | 21![[thin space (1/6-em)]](https://www.rsc.org/images/entities/char_2009.gif) 573.94 573.94 |
57.73 |
| N–(C)3 | 400.0 | 1.09 | 9606.33 | 25.70 | |
| C–N–H | 401.1 | 1.56 | 6192.46 | 16.57 | |
| g-C3N4 (60) | C–N–C | 398.6 | 1.13 | 28![[thin space (1/6-em)]](https://www.rsc.org/images/entities/char_2009.gif) 493.51 493.51 |
60.13 |
| N–(C)3 | 400.0 | 1.09 | 11![[thin space (1/6-em)]](https://www.rsc.org/images/entities/char_2009.gif) 598.98 598.98 |
24.48 | |
| C–N–H | 401.1 | 1.45 | 7289.68 | 15.39 | |
| g-C3N4 (80) | C–N–C | 398.7 | 1.19 | 31![[thin space (1/6-em)]](https://www.rsc.org/images/entities/char_2009.gif) 478.32 478.32 |
66.04 |
| N–(C)3 | 400.3 | 1.19 | 9968.00 | 20.91 | |
| C–N–H | 401.5 | 1.34 | 6217.44 | 13.04 | |
| g-C3N4 (100) | C–N–C | 398.6 | 1.16 | 32![[thin space (1/6-em)]](https://www.rsc.org/images/entities/char_2009.gif) 828.71 828.71 |
70.59 |
| N–(C)3 | 400.3 | 1.21 | 8146.68 | 17.52 | |
| C–N–H | 401.4 | 1.25 | 5530.19 | 11.89 | |
Compared to those of bulk g-C3N4, the peak areas of the g-C3N4 nanosheets dramatically reduced, which well-matched with the intensity change observed in the XRD patterns. In addition, the FWHM of the C–N–H group and N–(C)3 group peaks in the g-C3N4 nanosheets are different from that of bulk g-C3N4; this may be ascribed to the NH3 molecules in the interlamination of g-C3N4 and the change in the C–N–C and N–(C)3 environment.31 Especially, the FWHMs of the N–(C)3 peak in the g-C3N4 nanosheets are much wider than those found in bulk g-C3N4; this indicates that more tri-s-triazine in the bulk g-C3N4 are separated after it is treated in an ammonia solution. The peak position of the C–N–H group in g-C3N4 (80) and the g-C3N4 (100) nanosheets slightly shifts towards higher energy, demonstrating that the electron density of the N atoms is reduced, which is a typical feature of the exfoliation process.32 Moreover, the increase in the C–N–H percentage from 8.96% in bulk g-C3N4 to 16.57%, 15.39%, 13.04%, and 11.89% in the g-C3N4 nanosheets indicates the breakage of in-layers.
Fig. 4(viii) shows the N/C ratio of bulk g-C3N4 and the g-C3N4 nanosheets, which are 1.328, 1.372, 1.385, 1.339, and 1.335. Apparently, the N/C ratio of the g-C3N4 nanosheets was close to the N/C ratio of bulk g-C3N4; this indicated that the chemical composition and the coordination of carbon and nitride in the g-C3N4 nanosheets were retained during the liquid exfoliation process.33 However, higher N/C ratios of g-C3N4 (30) and g-C3N4 (60) than those found in bulk g-C3N4 may be ascribed to the adsorption of NH3 molecules in the interlayers of the g-C3N4 nanosheets, leading to the lattice expansion and exfoliation of the nanosheets.
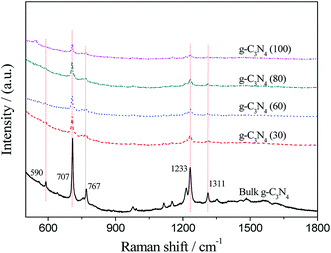
Fig. 5 shows the Raman spectra of bulk g-C3N4 and the g-C3N4 nanosheets obtained at various temperatures. The characteristic peaks of g-C3N4 agree well with that reported in literature.34 Moreover, all the Raman bands observed for bulk g-C3N4 can be found in the g-C3N4 nanosheets; this confirms that the main structure of the g-C3N4 nanosheets is not destroyed. In addition, the intensities of the peaks at 590 cm−1, 707 cm−1, 767 cm−1, 1233 cm−1, and 1311 cm−1 in the g-C3N4 nanosheets decrease as compared to those of bulk g-C3N4; this can be attributed to the effect of the liquid stripping process.
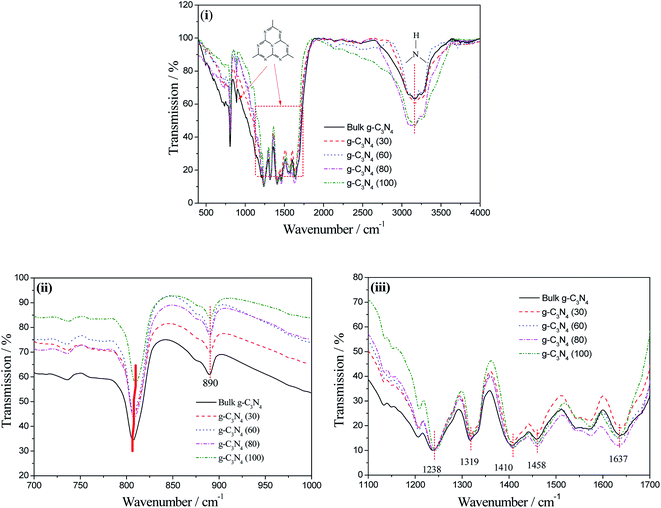
The chemical structures of bulk g-C3N4 and the g-C3N4 nanosheets were further investigated using the FTIR spectra, as shown in Fig. 6. An absorption band in the region from 1000 to 1750 cm−1 and a peak at 890 cm−1 are the characteristic absorptions for the stretching and bending modes of N-containing heterocycles, respectively.35 The broad peak at approximately 3200 cm−1 was related to the N–H stretching associated with the hydrogenation of sp2-N.36–38 The detailed information is shown in Fig. 6(ii) and (iii). In Fig. 6(ii), the signals at approximately 808 cm−1 can be attributed to ring-sextant out-of-plane bending vibration of the triazine or heptazine units.39 Clearly, this peak of the g-C3N4 (100) nanosheets slightly shifts towards higher wavenumber; this is evidence of the exfoliation effect. In Fig. 6(iii), the peaks at 1238, 1319, 1458, and 1637 cm−1 can be attributed to the skeletal vibrations of the heptazine heterocyclic ring (C6N7) units. In addition, the peak at 1410 cm−1 is a characteristic absorption peak for the stretching vibrations of the s-triazine ring (C3N3) units. On combining the results of XPS and FTIR analyses, it can be confirmed that the extracted nanosheets are in fairly good accordance with the recent reports of g-C3N4 materials prepared via polycondensation reactions.40
3.2 Photocatalytic performance
The optical absorption and photoluminescence patterns of bulk g-C3N4 and the g-C3N4 nanosheets obtained at different temperatures are shown in Fig. 7. As shown in Fig. 7(i), two absorption peaks at 366 nm and 270 nm were obtained for bulk g-C3N4. The g-C3N4 nanosheets obtained at different temperatures show similar absorption bands with double peaks at 366 nm and 270 nm with a slight decrease in the absorption intensity.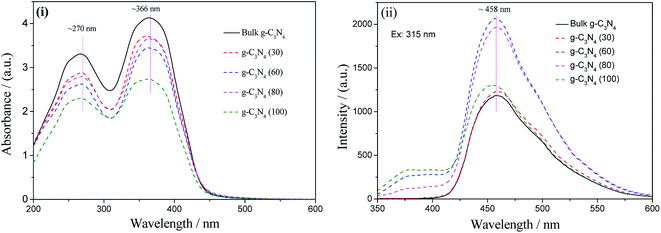 | ||
| Fig. 7 The optical absorption (i) and photoluminescence (ii) spectra of bulk g-C3N4 and the g-C3N4 nanosheets prepared at various temperatures. | ||
The photoluminescence patterns of bulk g-C3N4 and the g-C3N4 nanosheets under the excitation of 315 nm UV light are shown in Fig. 7(ii). All the samples possess the same emission peak at approximately 458 nm, originating from the deficiencies in g-C3N4. The intensities of the g-C3N4 nanosheets, particularly, those of the g-C3N4 (60) and g-C3N4 (80) nanosheets, prepared at various temperatures are higher than those of bulk g-C3N4, indicating more structural deficiencies in the exfoliated g-C3N4 nanosheets.
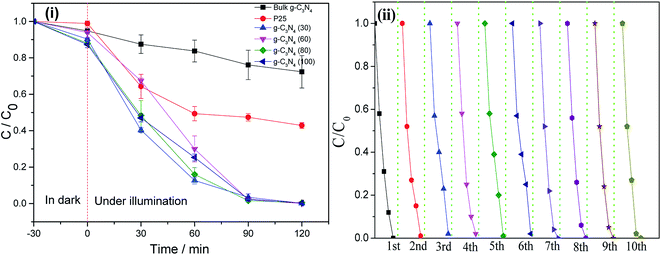
The photocatalytic performance was evaluated via RhB degradation, as shown in Fig. 8. Fig. 8(i) shows the plots of RhB degradation rate vs. time. The initial 30 min shows the adsorption rate of RhB in dark. Bulk g-C3N4 shows an adsorption ratio of approximately 5% in 30 min, higher than that of the P25 powder (1.2% in 30 min). All the g-C3N4 nanosheets show a higher adsorption rate than bulk g-C3N4. The g-C3N4 nanosheets obtained at 80 °C and 100 °C achieve a similar and highest adsorption ratio of ∼12%.
Bulk g-C3N4 possesses poor photocatalytic performance in the decomposition of RhB due to low surface area. After illumination with visible-light for 120 min, only 27.7% (containing 5% adsorption) of RhB was decomposed in the presence of bulk g-C3N4, whereas for P25 powder, the decomposition ratio was approximately 58%. All the g-C3N4 nanosheets possess higher photodegradation rates than bulk g-C3N4. In addition, most of the g-C3N4 nanosheets can completely degrade RhB in 120 min. Although the g-C3N4 nanosheets obtained at various temperatures show similar degradation rates in 90 and 120 min, the difference in the degradation velocity among the g-C3N4 nanosheets can be observed at a degradation time of 30 min. The g-C3N4 (30) nanosheets achieve the highest degradation ratio of 60% in 30 min under visible-light illumination. The increase in temperature slightly decreases the degradation rate to 55% in the g-C3N4 (80) and g-C3N4 (100) nanosheets.
Fig. 8(ii) shows the plots for RhB degradation when the g-C3N4 (100) nanosheets are reused for 10 cycles under the same conditions. In the first cycle, RhB can be completely degraded at 120 min. When the photocatalytic process was further repeated 10 times, the photocatalyst retained the same degradation ability, indicating excellent recyclability of the g-C3N4 nanosheets under visible-light illumination.
3.3 Mechanism discussion
g-C3N4 can be exfoliated in an ammonia solution at various temperatures, leading to an increase in the visible-light photocatalytic activity. The optical absorption, surface adsorption, charger transfer, and surface catalytic reactions41 have been discussed to explain the change in the photocatalytic performance.The optical absorption of the g-C3N4 nanosheets has been discussed in Fig. 7, which is the first step in the photocatalytic process. Clearly, the absorption edges of the g-C3N4 nanosheets show a slight blue shift when compared with those of bulk g-C3N4; this is adverse for visible-light photocatalytic degradation. The blue-shift in the band edge and low adsorption intensity of the g-C3N4 nanosheets confirmed that the change in the optical absorption was not the factor responsible for enhancing the photocatalytic performance of g-C3N4 after it was treated in an ammonia solution.
Surface area is also a key factor influencing the photocatalytic performance. A higher surface area can supply more active sites for surface reactions, thereby enhancing the photocatalytic performance. The specific surface area of g-C3N4 (100) was measured to be 41.1 m2 g−1, which was much higher than that of bulk g-C3N4 (15.2 m2 g−1). The high specific surface area of the g-C3N4 nanosheets with a large number of deficiencies plays a key role in the photocatalytic degradation of RhB by providing more active sites.
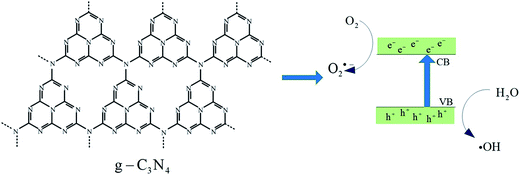
A schematic of the photocatalytic process is shown in Fig. 9. When excited, the electrons in the valence band (VB) will move to the conduction band (CB), leading to the generation of the electron–hole pairs. On the surface of the photocatalyst, electrons combine with dissolved oxygen, generating superoxide anions (˙O2−), and the holes are captured by hydroxyl ions, generating hydroxyl free radicals (˙OH). Then, organic compounds will be oxidized by ˙O2−, ˙OH, and h+. Thus, ˙O2−, ˙OH, and h+ are commonly considered as the main active species in the photocatalytic process. Herein, three sacrificial agents NaI for h+, BQ for ˙O2−, and IPA for ˙OH were added to the RhB solution to study the main active species during the photocatalytic process.
The degradation rates of the RhB solution with the addition of different sacrificial agents for bulk g-C3N4 and g-C3N4 (30) are shown in Fig. 10. The degradation rates of bulk g-C3N4 decrease from 40% to 12% and 25% with the addition of NaI and BQ, which indicates that holes and ˙O2− radicals exist in the photocatalytic process. However, the degradation rate of bulk g-C3N4 slightly decreases from 40% to 38% with the addition of IPA, indicating that ˙OH radicals are not the main active species in the photodegradation process. Similarly, the changes in the degradation rate with the addition of sacrificial agents were measured for the g-C3N4 nanosheets. NaI decreases the degradation rate from 99.5% to 60.7% and BQ decreases the degradation rate to 51.7%. However, the degradation rates are still 99.3% when IPA is added to the RhB solution, indicating that hydroxyl free radicals are not the active species in the photocatalytic process of the g-C3N4 nanosheets and the exfoliation in ammonia solution does not change the surface reactions.
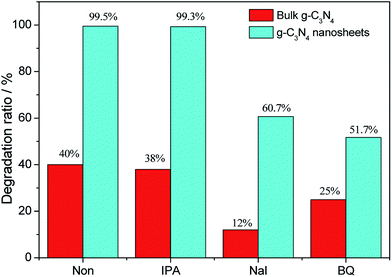 | ||
| Fig. 10 The photocatalytic performance of bulk g-C3N4 and the g-C3N4 nanosheets towards RhB solutions upon adding 10 mM of sacrificial agent including IPA, NaI and BQ. | ||
4 Conclusions
Herein, g-C3N4 nanosheets were obtained by exfoliating bulk g-C3N4 in an ammonia solution at various temperatures. The nanosheets with sizes of several hundred nanosheets can be obtained after liquid stripping in an ammonia solution. The photocatalytic performance of the g-C3N4 nanosheets under visible-light illumination was significantly enhanced. All the exfoliated g-C3N4 nanosheets can completely degrade 10 mg L−1 RhB in 120 min under visible-light illumination. In addition, the g-C3N4 (30) nanosheets achieve the highest degradation rate of 88% in 60 min, which is 5 times that of bulk g-C3N4. The enhancement in the photocatalytic performance under visible-light illumination originates from the higher surface area with more active sites.Acknowledgements
This work was supported by the Nature Science Foundation of China (51402078), Fundamental Research Funds for the Central Universities (2013HGQC0005), Nature Science Foundation of Anhui Province (1408085QE86), and Young Scholar Enhancement Foundation (Plan B) of HFUT, China (JZ2016HGTB0711).References
- G. Xu, H. Liu, J. Wang, J. Lv, Z. Zheng and Y. Wu, Electrochim. Acta, 2014, 121, 194–202 CrossRef CAS.
- M. Zhu, C. Zhai, L. Qiu, C. Lu, A. S. Paton, Y. Du and M. C. Goh, ACS Sustainable Chem. Eng., 2015, 3, 3123–3129 CrossRef CAS.
- J. Liu, H. Wang and M. Antonietti, Chem. Soc. Rev., 2016, 45, 2308–2326 RSC.
- A. Indra, A. Acharjya, P. W. Menezes, C. Merschjann, D. Hollmann, M. Schwarze and M. Driess, Angew. Chem., 2017, 129, 1–6 CrossRef.
- S. N. Habisreutinger, L. Schmidt-Mende and J. K. Stolarczyk, Angew. Chem., Int. Ed., 2013, 52, 7372–7408 CrossRef CAS PubMed.
- L. Sun, M. Yang, J. Huang, D. Yu, W. Hong and X. Chen, Adv. Funct. Mater., 2016, 26, 4943–4950 CrossRef CAS.
- Y. Wang, J. Zhang, X. Wang, M. Antonietti and H. Li, Angew. Chem., Int. Ed., 2010, 49, 3356–3359 CrossRef CAS PubMed.
- A. Thomas, A. Fischer, F. Goettmann, M. Antonietti, J. O. Müller, R. Schlögl and J. M. Carlsson, J. Mater. Chem., 2008, 18, 4893–4908 RSC.
- Y. Hou, A. B. Laursen, J. Zhang, G. Zhang, Y. Zhu, X. Wang and I. Chorkendorff, Angew. Chem., Int. Ed., 2013, 52, 3621–3625 CrossRef CAS PubMed.
- F. He, G. Chen, Y. Yu, S. Hao, Y. Zhou and Y. Zheng, ACS Appl. Mater. Interfaces, 2014, 6, 7171–7179 CAS.
- L. Ge, C. Han, X. Xiao and L. Guo, Int. J. Hydrogen Energy, 2013, 38, 6960–6969 CrossRef CAS.
- S. C. Yan, Z. S. Li and Z. G. Zou, Langmuir, 2010, 26, 3894–3901 CrossRef CAS PubMed.
- E. Gottlieb, M. Kopeć, M. Banerjee, J. Mohin, D. Yaron, K. Matyjaszewski and T. Kowalewski, ACS Appl. Mater. Interfaces, 2016, 8, 21531–21538 CAS.
- M. Zhu, C. Zhai, M. Sun, Y. Hu, B. Yan and Y. Du, Appl. Catal., B, 2017, 203, 108–115 CrossRef CAS.
- W. Ho, Z. Zhang, W. Lin, S. Huang, X. Zhang, X. Wang and Y. Huang, ACS Appl. Mater. Interfaces, 2015, 7, 5497–5505 CAS.
- F. Dong, Z. Wang, Y. Li, W. K. Ho and S. C. Lee, Environ. Sci. Technol., 2014, 48, 10345–10353 CrossRef CAS PubMed.
- X. H. Li, X. Wang and M. Antonietti, ACS Catal., 2012, 2, 2082–2086 CrossRef CAS.
- Y. Lu, D. Chu, M. Zhu, Y. Du and P. Yang, Phys. Chem. Chem. Phys., 2015, 17, 17355–17361 RSC.
- S. Yang, Y. Gong, J. Zhang, L. Zhan, L. Ma, Z. Fang and P. M. Ajayan, Adv. Mater., 2013, 25, 2452–2456 CrossRef CAS PubMed.
- Y. Gao, X. Chen, J. Zhang and N. Yan, ChemPlusChem, 2015, 80, 1556–1564 CrossRef CAS.
- B. Yuan, Z. Chu, G. Li, Z. Jiang, T. Hu, Q. Wang and C. Wang, J. Mater. Chem. C, 2014, 2, 8212–8215 RSC.
- X. Zhang, X. Xie, H. Wang, J. Zhang, B. Pan and Y. Xie, J. Am. Chem. Soc., 2012, 135, 18–21 CrossRef PubMed.
- T. Sano, S. Tsutsui, K. Koike, T. Hirakawa, Y. Teramoto, N. Negishi and K. Takeuchi, J. Mater. Chem. A, 2013, 1, 6489–6496 CAS.
- H. Zhao, H. Yu, X. Quan, S. Chen, Y. Zhang, H. Zhao and H. Wang, Appl. Catal., B, 2014, 152, 46–50 CrossRef.
- H. Zhao, H. Yu, X. Quan, S. Chen, H. Zhao and H. Wang, RSC Adv., 2014, 4, 624–628 RSC.
- Y. Li, Z. Wang, T. Xia, H. Ju, K. Zhang, R. Long and J. Jiang, Adv. Mater., 2016, 28, 6959–6965 CrossRef CAS PubMed.
- L. Ge, Mater. Lett., 2011, 65, 2652–2654 CrossRef CAS.
- X. Bai, L. Wang, R. Zong and Y. Zhu, J. Phys. Chem. C, 2013, 117, 9952–9961 CAS.
- Z. He, D. Wang, J. Tang, S. Song, J. Chen and X. Tao, Environ. Sci. Pollut. Res., 2017, 9, 8219–9229 CrossRef PubMed.
- S. Cao, J. Low, J. Yu and M. Jaroniec, Adv. Mater., 2015, 27, 2150–2176 CrossRef CAS PubMed.
- J. Sehnert, K. Baerwinkel and J. Senker, J. Phys. Chem. B, 2007, 111, 10671–10680 CrossRef CAS PubMed.
- K. Kamiya, R. Kamai, K. Hashimoto and S. Nakanishi, Nat. Commun., 2014, 5, 5040 CrossRef CAS PubMed.
- M. Tahir, C. Cao, F. K. Butt, F. Idrees, N. Mahmood, Z. Ali and T. Mahmood, J. Mater. Chem. A, 2013, 1, 13949–13955 CAS.
- Q. Xiang, J. Yu and M. Jaroniec, J. Phys. Chem. C, 2011, 115, 7355–7363 CAS.
- Y. Li, J. Zhang, Q. Wang, Y. Jin, D. Huang, Q. Cui and G. Zou, J. Phys. Chem. B, 2010, 114, 9429–9434 CrossRef CAS PubMed.
- B. V. Lotsch, M. Döblinger, J. Sehnert, L. Seyfarth, J. Senker, O. Oeckler and W. Schnick, Chem.–Eur. J., 2007, 13, 4969–4980 CrossRef CAS PubMed.
- V. W. Lau, M. B. Mesch, V. Duppel, V. Blum, J. Senker and B. V. Lotsch, J. Am. Chem. Soc., 2015, 137, 1064–1072 CrossRef CAS PubMed.
- S. M. Lyth, Y. Nabae, S. Moriya, S. Kuroki, M. A. Kakimoto, J. I. Ozaki and S. Miyata, J. Phys. Chem. C, 2009, 113, 20148–20151 CAS.
- B. Jürgens, E. Irran, J. Senker, P. Kroll, H. Müller and W. Schnick, J. Am. Chem. Soc., 2003, 125, 10288–10300 CrossRef PubMed.
- J. R. Holst and E. G. Gillan, J. Am. Chem. Soc., 2008, 130, 7373–7379 CrossRef CAS PubMed.
- S. C. Yan, S. B. Lv, Z. S. Li and Z. G. Zou, Dalton Trans., 2010, 39, 1488–1491 RSC.
| This journal is © The Royal Society of Chemistry 2017 |


