 Open Access Article
Creative Commons Attribution 3.0 Unported Licence
Effect of structural optimization on the photovoltaic performance of dithieno[3,2-b:2′,3′-d]pyrrole-based dye-sensitized solar cells†
Hai Zhang *a,
Zafar Iqbalb,
Zhen-E. Chena and
Yan-Ping Hongc
aSchool of Chemistry and Chemical Engineering, Qianbei Featured Resources Applied Research Key Laboratory, Zunyi Normal College, Zunyi 563006, Guizhou, China. E-mail: haizhang@vip.sina.com; Fax: +86 0851 28927159; Tel: +86 0851 28927159
bApplied Chemistry Research Centre, PCSIR Laboratories Complex, Feroze pur Road, Lahore 54000, Pakistan
cJiangxi Key Laboratory of Natural Product and Functional Food, College of Food Science and Engineering, Jiangxi Agricultural University, Nanchang 330045, China
First published on 17th July 2017
Abstract
Five novel organic push–pull dyes, DT, CD-T, TD-T, CD-C and TD-P, based on carbazole or triphenylamine as donors, dithieno[3,2-b:2′,3′-d]pyrrole as a π-spacer and cyanoacetic acid as an acceptor were synthesized, and their structures were optimized for DSSCs. Dithieno[3,2-b:2′,3′-d]pyrrole was linked with either carbazole or triphenylamine via a Suzuki coupling reaction. Followed by formylation via a Vilsmeier–Haak reaction, and then a Knoevenagel condensation reaction was employed to link cyanoacetic acid, producing the carbazole-based dyes CD-C and CD-T and the triphenylamine-based dyes TD-P and TD-T. Meanwhile, the dye DT was synthesized as a reference for comparison. The molar extinction coefficients of the carbazole-based dyes CD-T and CD-C were 56![[thin space (1/6-em)]](https://www.rsc.org/images/entities/char_2009.gif) 370 M−1 cm−1 and 62
370 M−1 cm−1 and 62![[thin space (1/6-em)]](https://www.rsc.org/images/entities/char_2009.gif) 471 M−1 cm−1, while those of the dyes based on triphenylamine, TD-T and TD-P, were 44
471 M−1 cm−1, while those of the dyes based on triphenylamine, TD-T and TD-P, were 44![[thin space (1/6-em)]](https://www.rsc.org/images/entities/char_2009.gif) 555 M−1 cm−1 and 49
555 M−1 cm−1 and 49![[thin space (1/6-em)]](https://www.rsc.org/images/entities/char_2009.gif) 945 M−1 cm−1, respectively. The optimized power conversion efficiency of CD-T reached 6.63% with an open-circuit voltage of 710 mV, a short-circuit current density of 14.55 mV cm−2, and a fill factor of 0.64.
945 M−1 cm−1, respectively. The optimized power conversion efficiency of CD-T reached 6.63% with an open-circuit voltage of 710 mV, a short-circuit current density of 14.55 mV cm−2, and a fill factor of 0.64.
1. Introduction
Dye-sensitized solar cells (DSSCs) based on nanocrystalline thin films have been extensively studied by various research groups around the world since 1991 (ref. 1) and have shown great progress in three major areas: efficiency, stability and the mechanism.2 Improving the photovoltaic properties of dye-sensitized solar cells involves systematic studies, with the most important projects focusing on the improvement of nanocrystalline semiconductor films, photosensitizing dyes and electrolytes. As one of the most important components of a DSSC, the sensitizer has been a hotspot for researchers. Through the structural modification of sensitizers, the spectral response of DSSCs can be broadened, and the photoelectric conversion efficiency and stability can be improved.3–5 At present, photosensitized dyes in DSSCs mainly contain ruthenium complexes, zinc porphyrins, phthalocyanins, metal-free organic dyes, and so on.6–14 Metal-free dyes have been extensively investigated and have shown record power conversion efficiencies of over 14% under AM 1.5 G irradiation.15 However, due to the high cost and limited resources associated with ruthenium dyes, the prospects for metal-free organic dyes will be very broad once adequate stability and efficiency have been achieved. Metal-free organic dyes began to receive more attention around the year 2000. Since 2001, large numbers of donor groups, acceptor groups and conjugated units connecting them have been combined in various ways, resulting in a wide variety of metal-free organic dyes.16–32In general, the most effective means to enhance efficiency is to enhance the photocurrent and photovoltaic voltage. The efficiency of photocurrent generation is related to three factors: light capture efficiency, electron injection efficiency and electron collection efficiency. DSSCs have high light-trapping efficiency, which means that the absorption spectrum is broad and the absorbance is large. The former is related to the light absorption width of the dye, and the latter is determined by the molar extinction coefficient and light adsorption amount of the dye.33 Absorption in the visible region mainly occurs due to intra-molecular charge transfer (ICT) transition in dyes, and the basis for this transition is the existence of a molecular electronic push–pull effect. The electron donor and acceptor in a D–π–A dye act as a push–pull electron system; the stronger the push–pull electron effect, the more obvious the ICT effect and the more the corresponding absorption band is red-shifted. On the other hand, the molar extinction coefficient and molecular structure have a very close relationship. Grätzel et al. achieved remarkable results by optimizing the molecular structure to increase the molar extinction coefficient of metal ruthenium dyes.34 It has been reported that changing the length of the conjugated chains and the twist angle are very important in improving the molar extinction coefficient. A planar conjugated bridge structure can not only increase the degree of molecular conjugation, but can also effectively increase the molar extinction coefficient of the dye molecule. Undoubtedly, it is interesting to introduce a large planar conjugated π-bridge structure in the molecule to obtain dye molecules with high absorptivity in the visible and near-infrared regions.
Dithieno[3,2-b:20,30-d]pyrrole (DTP) has a completely flat crystal structure, which means that the introduction of DTP units can effectively improve conjugation, conductivity and charge carrier mobility. Combining a suitable donor group and acceptor group, DTP-based dyes have been shown to be excellent sensitizers for high efficiency DSSCs.35–42 Triphenylamine has been widely used as the electron donor of sensitizers, due to its good electron donating and transporting capabilities. In addition, the nonplanar property of triphenylamine contributes to the reduction of dye aggregation and charge recombination. In contrast, as another common donor unit, the electron-donating ability of carbazole is relatively weaker than that of triphenylamine, and its spatial structure is almost planar, but it is more favorable for electron transport.
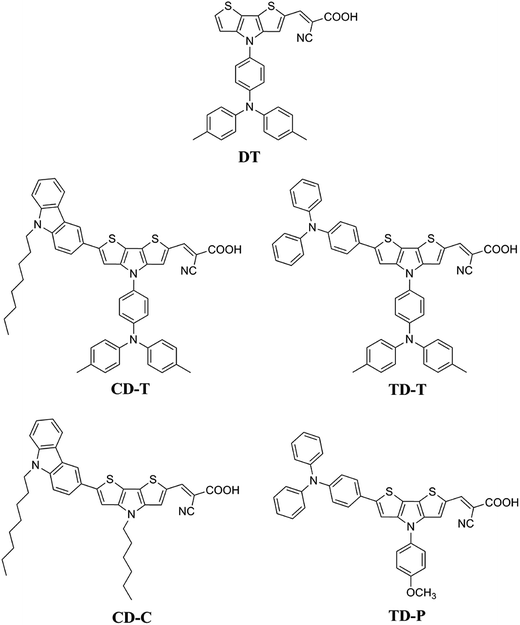
Taking all these factors into account, the current effort was made to find a well-suited structure for DSSCs. Towards this aim, we have designed and synthesized five novel organic dyes with DTP moieties. In this paper, a structure–performance relationship was studied, and in particular, the effect of different electron donors attached at different sites was explored. Furthermore, spectroscopic and electrochemical studies, theoretical calculations and J–V experiments were carried out. IPCE and electrochemical impedance spectroscopic analyses of the dyes DT, CD-T, TD-T, CD-C and TD-P were performed in detail. Efforts were also put forward to understand how subtle structural variations in the sensitizers affect the photovoltaic performance in DSSCs.
2. Materials and instruments
Dry THF and toluene were distilled over sodium/benzophenone. Other reagents were purchased from commercial sources and used without further purification. All glassware was dried under infrared, assembled hot, and cooled to room temperature in a desiccator. The transfer of liquids was done using standard syringe techniques, and all reactions were performed under a stream of dry argon. Reactions were monitored by using TLC, and chromatographic separations were performed using standard column methods with silica gel (300–400 mesh).2.1. Synthesis of dyes
![[thin space (1/6-em)]](https://www.rsc.org/images/entities/char_2009.gif) :
:![[thin space (1/6-em)]](https://www.rsc.org/images/entities/char_2009.gif) MeOH = 20
MeOH = 20![[thin space (1/6-em)]](https://www.rsc.org/images/entities/char_2009.gif) :
:![[thin space (1/6-em)]](https://www.rsc.org/images/entities/char_2009.gif) 1 as eluent) as an orange powder in 87.8% (200 mg) yield. Mp 243–245 °C. 1H NMR (DMSO-d6, 400 MHz): δ ppm 8.52 (s, 1H), 8.18 (s, 1H), 7.75–7.74 (m, 1H), 7.53–7.51 (m, 2H), 7.30–7.28 (m, 1H), 7.17–7.15 (m, 4H), 7.04–7.00 (m, 6H), 2.29 (s, 6H). 13C NMR (DMSO-d6, 100 MHz): δ ppm 164.1, 147.9, 146.4, 144.4, 142.9, 133.3, 132.9, 131.3, 131.2, 130.2, 124.9, 124.8, 123.6, 122.0, 117.3, 116.2, 112.3, 20.4. HRMS (ESI, m/z): [M]+ calcd for (C32H23N3O2S2): 545.1226, found: 545.1209.
1 as eluent) as an orange powder in 87.8% (200 mg) yield. Mp 243–245 °C. 1H NMR (DMSO-d6, 400 MHz): δ ppm 8.52 (s, 1H), 8.18 (s, 1H), 7.75–7.74 (m, 1H), 7.53–7.51 (m, 2H), 7.30–7.28 (m, 1H), 7.17–7.15 (m, 4H), 7.04–7.00 (m, 6H), 2.29 (s, 6H). 13C NMR (DMSO-d6, 100 MHz): δ ppm 164.1, 147.9, 146.4, 144.4, 142.9, 133.3, 132.9, 131.3, 131.2, 130.2, 124.9, 124.8, 123.6, 122.0, 117.3, 116.2, 112.3, 20.4. HRMS (ESI, m/z): [M]+ calcd for (C32H23N3O2S2): 545.1226, found: 545.1209.2.2. Measurement and characterization
1H and 13C NMR spectra were recorded on a Bruker 400 MHz spectrometer in CDCl3 or DMSO-d6 with tetramethylsilane as the inner reference. The melting points were taken on a Tektronix X4 microscopic melting point apparatus and were uncorrected. The absorption and emission spectra of the dyes in tetrahydrofuran solution (2 × 10⁻⁵ M) were measured at room temperature on a Shimadzu UV-2450 UV-Vis spectrophotometer and Fluorolog III photoluminescence spectrometer, respectively. Electrochemical redox potentials were measured using Cyclic Voltammetry (CV), with three electrode cells and an Ingsens 1030 electrochemical workstation (Ingsens Instrument Guangzhou, Co. Ltd., China) in one compartment at a scan rate of 50 mV s−1. Ag/AgCl electrode in KCl (3 M) solution and an auxiliary platinum wire were utilized as reference and counter electrodes, respectively, while dye-coated TiO2 films were used as the working electrodes. Tetrabutylammonium perchlorate (n-Bu4NClO4) 0.1 M in THF was used as the supporting electrolyte. All electrochemical measurements were calibrated by using ferrocene as a standard (0.63 V vs. NHE). The current voltage characteristics were recorded using a Keithley 2400 source meter under simulated AM 1.5 G (100 mW cm−2) illumination with a solar light simulator (Pecell-L15). A 1000 W xenon arc lamp (Oriel, Model: 6271) served as a light source and its incident light intensity was calibrated with a BS-520 standard Si solar cell. The incident monochromatic photon-to-current conversion efficiency (IPCE) spectra were measured as a function of wavelength from 350 to 800 nm using a PEC-S20 action spectrum measurement system. The electrochemical impedance spectra (EIS) measurements were conducted on an electrochemical workstation (Zahner Zennium) under dark conditions, with an applied bias potential of −0.8 V. A 10 mV AC sinusoidal signal was employed over the constant bias with the frequency ranging between 1 MHz and 0.1 Hz. The impedance parameters were determined by fitting the impedance spectra using Z-view software. The amount of dye loaded was measured by desorbing the dye from the films with 0.1 M NaOH in THF/H2O (1![[thin space (1/6-em)]](https://www.rsc.org/images/entities/char_2009.gif) :
:![[thin space (1/6-em)]](https://www.rsc.org/images/entities/char_2009.gif) 1) and measuring the UV-Vis spectrum.
1) and measuring the UV-Vis spectrum.
2.3. Fabrication of DSSCs
A TiO2 (anatase) film (∼12 μm in thickness) with a scattering layer (∼4 μm) was prepared according to a previous procedure.43 The active area of the TiO2 film was 0.4 × 0.4 cm−2. The TiO2 electrodes were immersed in a solution of the dyes for 16 h in the dark (0.5 mM dye in DCM/THF (1![[thin space (1/6-em)]](https://www.rsc.org/images/entities/char_2009.gif) :
:![[thin space (1/6-em)]](https://www.rsc.org/images/entities/char_2009.gif) 1)). The dye-adsorbed TiO2 films were washed with THF and dried. The dye-sensitized TiO2/FTO photoanodes and Pt/FTO counter electrodes were assembled into sandwich-type solar cells. The electrolyte (0.6 M 1-methyl-3-propylimidazolium iodide (PMII), 0.1 M guanidinium thiocyanate, 0.07 M I2, 0.05 M LiI, and 0.5 M tert-butylpyridine in acetonitrile) was injected into the seam between the two electrodes.
1)). The dye-adsorbed TiO2 films were washed with THF and dried. The dye-sensitized TiO2/FTO photoanodes and Pt/FTO counter electrodes were assembled into sandwich-type solar cells. The electrolyte (0.6 M 1-methyl-3-propylimidazolium iodide (PMII), 0.1 M guanidinium thiocyanate, 0.07 M I2, 0.05 M LiI, and 0.5 M tert-butylpyridine in acetonitrile) was injected into the seam between the two electrodes.
3. Results and discussion
3.1. Synthesis and characterization
The synthetic route to the five dyes containing the DTP moiety, i.e., DT, CD-T, TD-T, CD-C and TD-P, is depicted in Scheme 1. The starting materials 1-X, 2-X and 3-X were synthesized according to our previous report.44 The subsequent Suzuki–Miyaura cross-coupling reaction of 9-octyl-3-(4,4,5,5-tetramethyl-1,3,2-dioxaborolan-2-yl)-9H-carbazole with 3-X, under modified conditions and tetrakis(triphenylphosphine)-palladium(0) as the catalyst precursor in a biphasic mixture of aqueous Na2CO3 and THF, afforded the corresponding aldehyde 4-X in yields of 68.7% and 91.9%, respectively. The same procedure was applied for the preparation of 5-X from a reaction of 3-X and [4-(diphenylamino)phenyl]-boronic acid. The target products were then obtained by the reaction of the corresponding precursors with cyanoacetic acid via the Knoevenagel condensation reaction in the presence of piperidine to yield CD-C, CD-T, TD-T and TD-P (74.8–89.2%). The structures of the new compounds were confirmed by 1H NMR, 13C NMR and HRMS spectra.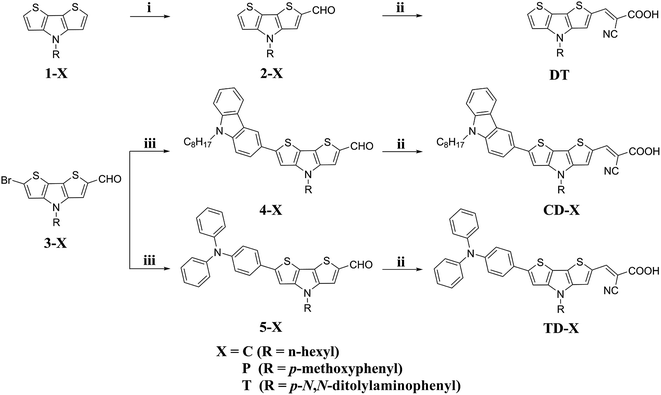 | ||
| Scheme 1 Synthetic route for the target dyes: (i) DMF, POCl3, 1,2-dichloroethane, 40 °C, 4 h; (ii) cyanoacetic acid, piperidine, CHCl3, reflux, 20 h; (iii) Pd(PPh3)4, K2CO3, THF, 80 °C, 20 h. | ||
3.2. Absorption properties in solution
The UV-Vis absorption spectra of the organic dyes DT, CD-T, TD-T, CD-C and TD-P in CH2Cl2/THF (1![[thin space (1/6-em)]](https://www.rsc.org/images/entities/char_2009.gif) :
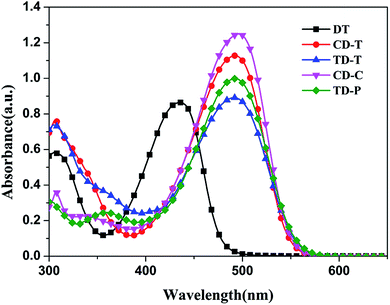
:![[thin space (1/6-em)]](https://www.rsc.org/images/entities/char_2009.gif) 1) solution are displayed in Fig. 2 and the parameters are listed in Table 1. Each of these dyes exhibited two major distinct absorption bands at 300–350 nm and 400–550 nm. The former is ascribed to a localized aromatic π–π* transition and the latter exhibits intramolecular charge-transfer (ICT) characteristics.45 The absorption maxima (ICT) for DT, CD-T, TD-T, CD-C and TD-P in solution are 436 nm, 492 nm, 492 nm, 496 nm and 493 nm in the visible region, respectively, indicating that the donor unit at the 6-position of DTP ring can lead to a better absorption performance compared to the donor unit at the 4-position (N-atom) of DTP ring. Except for DT, the spectra of CD-T, TD-T, CD-C and TD-P are quite similar, but the molar extinction coefficients (ε) of TD-T (ε = 44
1) solution are displayed in Fig. 2 and the parameters are listed in Table 1. Each of these dyes exhibited two major distinct absorption bands at 300–350 nm and 400–550 nm. The former is ascribed to a localized aromatic π–π* transition and the latter exhibits intramolecular charge-transfer (ICT) characteristics.45 The absorption maxima (ICT) for DT, CD-T, TD-T, CD-C and TD-P in solution are 436 nm, 492 nm, 492 nm, 496 nm and 493 nm in the visible region, respectively, indicating that the donor unit at the 6-position of DTP ring can lead to a better absorption performance compared to the donor unit at the 4-position (N-atom) of DTP ring. Except for DT, the spectra of CD-T, TD-T, CD-C and TD-P are quite similar, but the molar extinction coefficients (ε) of TD-T (ε = 44![[thin space (1/6-em)]](https://www.rsc.org/images/entities/char_2009.gif) 555 M−1 cm−1) and TD-P (ε = 49
555 M−1 cm−1) and TD-P (ε = 49![[thin space (1/6-em)]](https://www.rsc.org/images/entities/char_2009.gif) 945 M−1 cm−1) are smaller than those of CD-T (ε = 56
945 M−1 cm−1) are smaller than those of CD-T (ε = 56![[thin space (1/6-em)]](https://www.rsc.org/images/entities/char_2009.gif) 370 M−1 cm−1) and CD-C (ε = 62
370 M−1 cm−1) and CD-C (ε = 62![[thin space (1/6-em)]](https://www.rsc.org/images/entities/char_2009.gif) 471 M−1 cm−1), which indicates the superiority of the carbazole donor in its light harvesting capability. When a triphenylamine group was attached to the nitrogen atom of the DTP ring, the absorption ranges of CD-T and TD-T show slight narrowing and the molar extinction coefficients are obviously decreased compared with those of CD-C and TD-P (see Fig. 1), which is consistent with our previous report.44
471 M−1 cm−1), which indicates the superiority of the carbazole donor in its light harvesting capability. When a triphenylamine group was attached to the nitrogen atom of the DTP ring, the absorption ranges of CD-T and TD-T show slight narrowing and the molar extinction coefficients are obviously decreased compared with those of CD-C and TD-P (see Fig. 1), which is consistent with our previous report.44
| Dye | (HOMO/LUMO)b /eV | Band gapb | (λabsc/nm)/(ε/M−1 cm−1) | HOMOd (vs. NHE)/V | E0-0/eV | LUMOe (vs. NHE)/V |
|---|---|---|---|---|---|---|
a ε: absorption coefficient; E0-0: 0-0 transition energy measured at the onset of absorption spectra.b DFT/B3LYP calculated values.c Absorptions due to charge-transfer transitions were measured in CH2Cl2/THF (1![[thin space (1/6-em)]](https://www.rsc.org/images/entities/char_2009.gif) : :![[thin space (1/6-em)]](https://www.rsc.org/images/entities/char_2009.gif) 1).d HOMO of dyes measured using cyclic voltammetry in 0.1 M tetrabutylammonium perchlorate in THF solution as supporting electrolyte, Ag/AgCl as reference electrode and Pt as counter electrode.e LUMO was calculated by HOMO − E0-0. 1).d HOMO of dyes measured using cyclic voltammetry in 0.1 M tetrabutylammonium perchlorate in THF solution as supporting electrolyte, Ag/AgCl as reference electrode and Pt as counter electrode.e LUMO was calculated by HOMO − E0-0. |
||||||
| DT | −5.19/−2.45 | 2.74 | 436(43![[thin space (1/6-em)]](https://www.rsc.org/images/entities/char_2009.gif) 200) 200) |
0.51(−5.26) | 2.84 | −2.42 |
| CD-T | −5.07/−2.35 | 2.72 | 492(56![[thin space (1/6-em)]](https://www.rsc.org/images/entities/char_2009.gif) 370) 370) |
0.79(−5.54) | 2.52 | −3.02 |
| TD-T | −4.97/−2.41 | 2.56 | 492(44![[thin space (1/6-em)]](https://www.rsc.org/images/entities/char_2009.gif) 555) 555) |
0.52(−5.27) | 2.52 | −2.75 |
| CD-C | −5.10/−2.37 | 2.73 | 496(62![[thin space (1/6-em)]](https://www.rsc.org/images/entities/char_2009.gif) 471) 471) |
0.60(−5.35) | 2.50 | −2.85 |
| TD-P | −4.98/−2.43 | 2.55 | 493(49![[thin space (1/6-em)]](https://www.rsc.org/images/entities/char_2009.gif) 945) 945) |
0.71(−5.46) | 2.52 | −2.94 |
3.3. Electrochemical properties
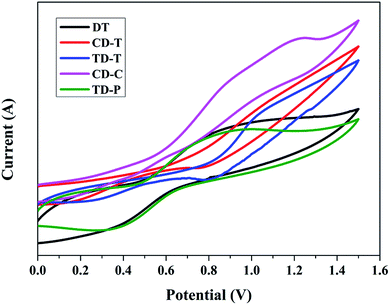
To study the redox potentials of all the dyes (DT, CD-T, TD-T, CD-C and TD-P) and their energy levels, the electrochemical behaviors were studied using cyclic voltammetry (CV) in THF solution (Fig. 3). Quasi-reversible oxidation waves (Eox) were used to estimate the highest occupied molecular orbital (HOMO) energies, whereas quasi-reversible reduction waves (Ered) were used to estimate the lowest unoccupied molecular orbital (LUMO) energies. As shown in Table 1, all the five dyes exhibit more negative LUMO levels (−2.33, −1.73, −2.00, −1.90 and −1.81 V) than the conductive band of TiO2 (−0.5 V vs. NHE), indicating that the electron injection process is energetically permitted. The first oxidation potentials, corresponding to the HOMO energy levels of sensitizers DT, CD-T, TD-T, CD-C and TD-P, were determined to be 0.51, 0.79, 0.52, 0.60 and 0.71 V, respectively, which are more positive than the I−/I3− redox couple (0.4 V vs. NHE), providing a thermodynamic driving force for efficient dye regeneration. The zero–zero band gaps (E0-0), estimated from the onset of the UV-Vis absorption spectra, were in the range of 2.50–2.84 eV.3.4. Molecular calculations
To obtain further insight into the geometrical and electronic distribution of these dyes, density functional theory (DFT) calculations were performed at the B3LYP/6-31G* level. The ground-state structures of the five dyes are shown in Fig. 4. As can be easily seen, the dihedral angles of the carbazole-dithienopyrrole moiety in the optimized structures of CD-C and CD-T are 30.3° and 26.9°, respectively, while the dihedral angles of the triphenylamine-dithienopyrrole moiety in the dyes of TD-P and TD-T are 23.8° and 24.5°, respectively, indicating that the bulky triphenylamine groups attached to the DTP ring do not twist the conjugation system. Thus, this configuration not only maintains charge transfer through the whole conjugation system, but also prevents π–π* stacking between the planar structures. The torsional angle between the phenyl group on the side chain and the DTP plane in DT is 48.5°. For CD-T, TD-T and TD-P, the torsional angles of the corresponding units are 48°, 49.3° and 51.7°, respectively. As the dihedral angles between these two aromatic units are relatively large, conjugation between the side chains and the DTP rings is disrupted. This disruption of the conjugation is reflected in the experimental optical spectra of the chromophores in CD-C and CD-T, which have almost the same absorption range.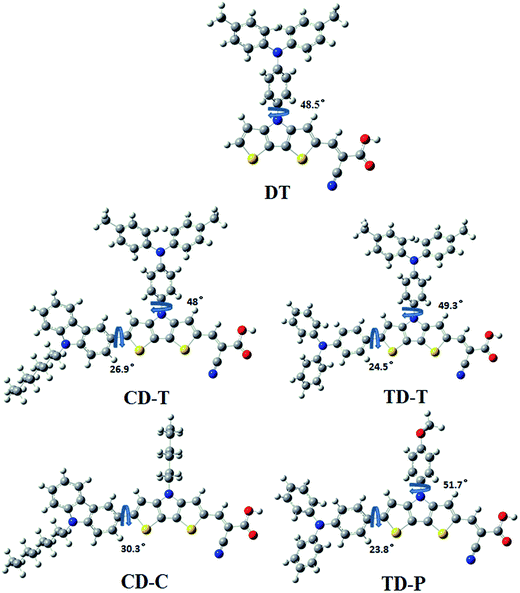 | ||
| Fig. 4 Optimized ground state geometry and related dihedral angels for the sensitizers DT, CD-T, TD-T, CD-C and TD-P. | ||
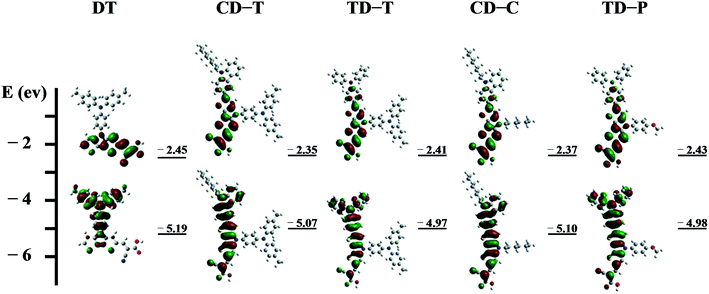
The energies and the electronic distributions of the frontier molecular orbitals (HOMOs and LUMOs) of the dyes computed are presented in Fig. 5. The electron distributions of the HOMO and LUMO of CD-T, TD-T, CD-C and TD-P are similar. The HOMO levels of these dye molecules are mainly dominated by a π-orbital contribution of the triphenylamine or carbazole donor with a small contribution from the DTP ring π-orbital. Meanwhile, the LUMO levels are delocalized through the DTP units and cyanoacrylic acid fragments, with a sizable contribution from the latter. It is also worthwhile to note that in the optimized structure of the dye DT, the HOMO level is delocalized over the triphenylamine group attached to the N-atom of the DTP ring, but there is nearly no electron distribution of the HOMO on the DTP substituents in other dyes.
3.5. Adsorption amount
The amount of the dye adsorbed on the TiO2 film (12 μm) was measured by dipping the films into a 0.1 M aqueous solution of NaOH/THF (1![[thin space (1/6-em)]](https://www.rsc.org/images/entities/char_2009.gif) :
:![[thin space (1/6-em)]](https://www.rsc.org/images/entities/char_2009.gif) 1) and measuring the absorbance of the desorbed dye solution. As listed in Table 2, the amounts of dye absorbed on the TiO2 films were 2.97, 3.03, 3.79, 4.05 and 5.74 × 10⁻⁷ mol cm−2 for DT, CD-T, TD-T, CD-C and TD-P, respectively. Compared with CD-C and TD-P, the TPA-substituted DT, CD-T and TD-T showed lower uptake, which may be due to the bulky groups on the side chain, leading to weak electronic coupling with nanoporous TiO2 and hence, decreased dye uptake. This is also the reason why the DT dye-sensitized cell showed the lowest current density (7.09 mA cm−2). In addition, the dye adsorption amount of TD-P was higher than that of CD-C, which indicates that the incorporation of appropriate size groups in the side chain not only inhibits the π–π aggregation of dye molecules, but also does not cause a decrease in molecular adsorption.
1) and measuring the absorbance of the desorbed dye solution. As listed in Table 2, the amounts of dye absorbed on the TiO2 films were 2.97, 3.03, 3.79, 4.05 and 5.74 × 10⁻⁷ mol cm−2 for DT, CD-T, TD-T, CD-C and TD-P, respectively. Compared with CD-C and TD-P, the TPA-substituted DT, CD-T and TD-T showed lower uptake, which may be due to the bulky groups on the side chain, leading to weak electronic coupling with nanoporous TiO2 and hence, decreased dye uptake. This is also the reason why the DT dye-sensitized cell showed the lowest current density (7.09 mA cm−2). In addition, the dye adsorption amount of TD-P was higher than that of CD-C, which indicates that the incorporation of appropriate size groups in the side chain not only inhibits the π–π aggregation of dye molecules, but also does not cause a decrease in molecular adsorption.
| Dye | Jsc (mA cm−2) | Voc (mV) | FF | η (%) | Amount of dye load (mol cm−2) |
|---|---|---|---|---|---|
| DT | 7.09 | 0.62 | 0.79 | 3.68 | 2.97 × 10⁻⁷ |
| CD-T | 14.55 | 0.71 | 0.64 | 6.63 | 3.03 × 10⁻⁷ |
| TD-T | 13.39 | 0.69 | 0.65 | 5.96 | 3.79 × 10⁻⁷ |
| CD-C | 14.71 | 0.70 | 0.63 | 6.50 | 4.05 × 10⁻⁷ |
| TD-P | 14.79 | 0.72 | 0.61 | 6.44 | 5.74 × 10⁻⁷ |
3.6. Photovoltaic properties of the DSSCs
The incident monochromatic photo-to-current conversion efficiency (IPCE) as a function of incident wavelength for DSSCs based on the dyes using a liquid electrolyte is shown in Fig. 6a. These results are in good agreement with the UV-Vis absorption results (Fig. 1), and the IPCE action spectra for the DSSC based on DT is narrower than for the DSSCs based on the others. It is evident that all five dyes can efficiently convert visible light into photocurrent in the region from 400 nm to 700 nm. The IPCE exceeds 60% in the range of 410–580 nm for CD-T, 450–530 nm for TD-T, 420–580 nm for CD-C and 410–580 nm for TD-P, with the highest value of 69.3% at 490 nm for CD-T, 63.1% at 490 nm for TD-T, 66.2% at 510 nm for CD-C and 66.3% at 490 nm for TD-P. However, the highest value of IPCE for DT was only 52.9% at 470 nm. The differences in the maximum IPCE values arise from three factors, i.e., the difference between the LUMO and the conduction band edge, the absorption capacity (Fig. 1 and Table 1), and the amount of dye adsorbed on the TiO2 film.45–47 Among these five dyes, it can be easily seen that the IPCE for DT displayed the poorest performance with low IPCE values and narrow IPCE spectra, while the IPCE for CD-T exhibited the best performance with high IPCE values over a broad spectral region, indicating that a CD-T-sensitized TiO2 electrode would generate a higher conversion yield compared to those of the other four dyes. The IPCE values of CD-T, based on the carbazole donor, are obviously higher than those of TD-T, based on triphenylamine donor, which may be a result of the high molar extinction coefficient. Generally, a high molar extinction coefficient means a good light harvesting ability, suggesting that the dye would convert light to electricity more efficiently.48 Thus, the high molar extinction coefficients would allow the carbazole donor dye to display good IPCE performance. On the other hand, although TD-T has almost the same IPCE spectrum as TD-P, the IPCE performance of the TD-P device is much higher than that of the TD-T device. Consistent with the absorption spectra of the dyes in solution, the higher IPCE values for the TD-P-based DSSC may also be attributed to its higher absorption. The relatively higher IPCE of the TD-P-based cell may lead to a higher short-circuit photocurrent density compared with that of TD-T.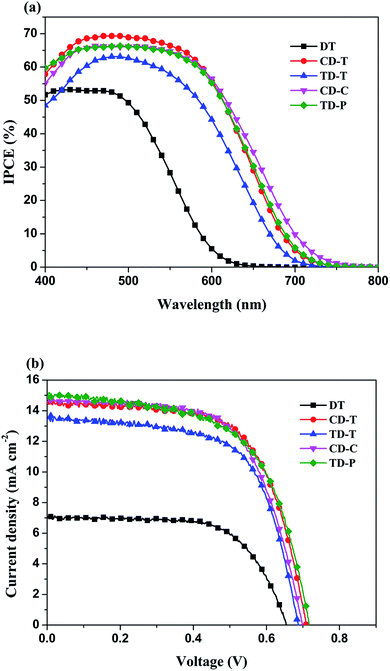 | ||
| Fig. 6 (a) IPCE action spectra and (b) current-density–voltage (J–V) curves for the DSSCs based on DT, CD-T, TD-T, CD-C and TD-P. | ||
The photocurrent–voltage (I–V) plots of the DSSCs fabricated with these dyes are shown in Fig. 6b. The detailed parameters, i.e., short circuit current (Jsc), open-circuit photovoltage (Voc), fill factor (FF), and solar-to-electrical energy conversion efficiency (η) measured under AM 1.5 solar light (100 mW cm−2) are summarized in Table 2.
As compared in Table 2 and Fig. 6, the overall efficiencies of the DTP-sensitized DSSCs follow the order: CD-T > CD-C > TD-P > TD-T > DT. The superior performance of the CD-T, CD-C and TD-P cells can be understood via their better photovoltaic characteristics. The Jsc, Voc, and FF values of the CD-T, CD-C and TD-P cells are (14.55 mA cm−2, 0.71 mV, 0.64), (14.71 mA cm−2, 0.70 mV, 0.63) and (14.79 mA cm−2, 0.72 mV, 0.61), respectively, yielding higher overall efficiencies of 6.63%, 6.50% and 6.44%, respectively. In contrast, TD-T and DT show poorer Jsc, Voc, and FF values of (13.39 mA cm−2, 0.69 mV, 0.65) and (7.09 mA cm−2, 0.62 mV, 0.79), respectively, leading to inferior conversion efficiencies of 5.96% and 3.68%, respectively. There are two major structural factors worthy of attention: (1) the effects of different donor groups and (2) the influence induced by the substituent at the N-atom of the DTP ring.
Adding a substituent at the N-atom of the DTP ring seems to have a beneficial effect. It was found that the Voc increases from 0.70 to 0.71 mV when the substituent was changed from the hexyl (CD-C) to the TPA (CD-T) unit. This was assigned to the reduced recombination ability at the TiO2/dye/electrolyte interface by insulating the bulky phenyl groups on the dyes.
A similar result can also be detected in the Bode plot. The higher frequency peak (>100 Hz in Fig. 7a) represents the electron transfer processes at the Pt/electrolyte interface, while the lower frequency peak (<100 Hz) represents the electron transfer processes at the TiO2/dye/electrolyte interface. From Fig. 7a it is clear that the positions of the high-frequency peaks for the two dyes did not change much, but the low-frequency peaks show a significant difference.
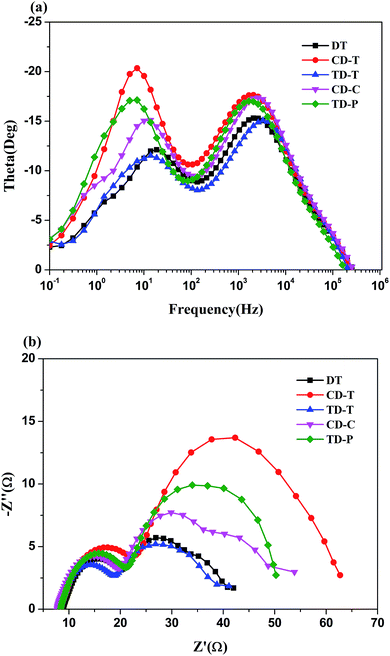 | ||
| Fig. 7 (a) EIS Bode plots and (b) EIS Nyquist plots for DSSCs based on the five sensitizers measured in the dark under −0.8 V bias. | ||
3.7. Electrochemical impedance spectroscopy analysis
Electrochemical impedance spectroscopy (EIS) analysis was employed to investigate the transfer and suppression of electrons in the DSSCs. The Nyquist plots for the DSSCs based on the dyes under a forward bias of −0.8 V in the dark with a frequency range of 0.1 Hz to 106 Hz are displayed in Fig. 7b. The five sensitizers all exhibit two semicircles. The first semicircle (Rce) is assigned to charge transfer at the Pt/electrolyte interface, while the larger semicircle (Rrec) at lower frequencies relates to the charge transfer at the TiO2/dye/electrolyte interface.49,50 Obviously, the radius of the large semicircle increased in the order of TD-T < DT < CD-C < TD-P < CD-T, indicating that the CD-T-based device had the largest Rrec. In the Bode phase plots (Fig. 7a), the peak with the middle frequency is related to the electron lifetime, while the lower frequency peak corresponds to a longer electron lifetime. The electron lifetime (τr) can be estimated from τr = 1/(2πfmax), where fmax is the peak frequency in lower frequency region.51,52 As shown in Fig. 7a, the fmax value decreases in the order of DT (18.62 Hz) > TD-T (13.79 Hz) > CD-C (11.91 Hz) > CD-T (7.15 Hz) > TD-P (6.07 Hz). Thus, the electron lifetimes of the five dyes increase in the order of DT (8.5 ms) < TD-T (11.5 ms) < CD-C (13.4 ms) < CD-T (22.3 ms) < TD-P (26.2 ms). A longer electron lifetime corresponds to a lower dark current. Thus, the DSSC based on TD-P has the highest Voc. It is shown that triphenylamine used as an electron donor and the introduction of a benzene ring in the π-side chain are beneficial to the inhibition of electron recombination. However, the position and number of the benzene ring have a great influence on the electron lifetime.4. Conclusion
In summary, five novel metal-free organic dyes containing a DTP unit as the π-spacer were successfully synthesized and utilized in DSSCs. In this study, we focused on the different effects of spatial structures and connection positions within the DSSCs. The results show that the smaller the dihedral angle between the donor unit and the bridging unit in the dye molecule, the higher the molar extinction coefficient of the molecule and the stronger the ability to capture light. In addition, the open circuit voltage (Voc) was improved by attaching a benzene ring unit to the DTP unit (compared to an alkyl chain), which proved to be an effective strategy to reduce the π–π aggregation of the dyes on the TiO2 films and suppress charge recombination. It is worth noting that the open-circuit photovoltage of the TD-P cell is superior to that of the TD-T cell. In addition, the dye adsorption amount of TD-P is also higher than that of TD-T, which indicates that the introduction of a suitable group in the side chain may lead to better results.Acknowledgements
We are grateful to the National Natural Science Foundation of China (21462054 and 61368006), the Science and Technology Cooperation Project of GuiZhou Province, China (LH[2015]7036 and LH[2015]7048) and the Science and Technology Cooperation talent Project of ZunYi City, China ([2016]14) for the financial support.References
- B. O'Regan and M. Grätzal, Nature, 1991, 353, 737–740 CrossRef.
- A. Hagfeldt, G. Boschloo, L. Sun, L. Kloo and H. Pettersson, Chem. Rev., 2010, 110, 6595–6663 CrossRef CAS PubMed.
- J. Yang, P. Ganesan, J. Teuscher, T. Moehl, Y. J. Kim, C. Yi, P. Comte, K. Pei, T. W. Holcombe, M. K. Nazeeruddin, J. Hua, S. M. Zakeeruddin, H. Tian and M. Grätzel, J. Am. Chem. Soc., 2014, 136, 5722–5730 CrossRef CAS PubMed.
- J. Mao, N. He, Z. Ning, Q. Zhang, F. Guo, L. Chen, W. Wu, J. Hua and H. Tian, Angew. Chem., Int. Ed., 2012, 51, 9873–9876 CrossRef CAS PubMed.
- S. D. Sousa, S. Lyu, L. Ducasse, T. Toupance and C. Olivier, J. Mater. Chem. A, 2015, 3, 18256–18264 Search PubMed.
- P. Wang, C. Klein, R. Humphry-Baker, S. M. Zakeeruddin and M. Grätzel, J. Am. Chem. Soc., 2005, 127, 808–809 CrossRef CAS PubMed.
- Z. S. Wang and H. Sugihara, Langmuir, 2006, 22, 9718–9722 CrossRef CAS PubMed.
- F. D. Angelis, S. Fantacci, A. Selloni, M. Grätzel and M. K. Nazeeruddin, Nano Lett., 2007, 7, 3189–3195 CrossRef PubMed.
- S. Mori, M. Nagata, Y. Nakahata, K. Yasuta, R. Goto, M. Kimura and M. Taya, J. Am. Chem. Soc., 2010, 132, 4054–4055 CrossRef CAS PubMed.
- Y. Xie, Y. Tang, W. Wu, Y. Wang, J. Liu, X. Li, H. Tian and W. Zhu, J. Am. Chem. Soc., 2015, 137, 14055–14058 CrossRef CAS PubMed.
- S. Arrechea, J. N. Clifford, L. Pellejà, A. Aljarilla, P. d. l. Cruz, E. Palomares and F. Langa, Dyes Pigm., 2016, 126, 147–153 CrossRef CAS.
- C. Li, L. Luo, D. Wu, R. Jiang, J. Lan, R. Wang, L. Huang, S. Yang and J. You, J. Mater. Chem. A, 2016, 4, 11829–11834 CAS.
- J. Luo, J. Zhang, K. Huang, Q. Qi, S. Dong, J. Zhang, P. Wang and J. Wu, J. Mater. Chem. A, 2016, 4, 8428–8434 CAS.
- C. Yi, F. Giordano, N. Cevey-Ha, H. N. Tsao, S. M. Zakeeruddin and M. Grätzel, ChemSusChem, 2014, 7, 1107–1113 CrossRef CAS PubMed.
- K. Kakiage, Y. Aoyama, T. Yano, K. Oya, J. Fujisawa and M. Hanaya, Chem. Commun., 2015, 51, 15894–15897 RSC.
- T. Horiuchi, H. Miura and S. Uchida, Chem. Commun., 2003, 3036–3037 RSC.
- Z. Ning, Q. Zhang, W. Wu, H. Pei, B. Liu and H. Tian, J. Org. Chem., 2008, 73, 3791–3797 CrossRef CAS PubMed.
- H. Zhu, Y. Wu, J. Liu, W. Zhang, W. Wu and W. Zhu, J. Mater. Chem. A, 2015, 3, 10603–10609 CAS.
- D. P. Hagberg, T. Edvinsson, T. Marinado, G. Boschloo, A. Hagfeldt and L. Sun, Chem. Commun., 2006, 21, 2245–2247 RSC.
- S. S. Park, Y. S. Won, Y. C. Choi and J. H. Kim, Energy Fuels, 2009, 23, 3732–3736 CrossRef CAS.
- H.-Y. Yang, Y.-S. Yen, Y.-C. Hsu, H.-H. Chou and J. T. Lin, Org. Lett., 2010, 12, 16–19 CrossRef CAS PubMed.
- S. Paek, H. Choi, H. Choi, C.-W. Lee, M.-S. Kang, K. Song, M. K. Nazeeruddin and J. Ko, J. Phys. Chem. C, 2010, 114, 14646–14653 CAS.
- W. Li, Y. Wu, X. Li, Y. Xie and W. Zhu, Energy Environ. Sci., 2011, 4, 1830–1837 CAS.
- J. Mao, N. He, Z. Ning, Q. Zhang, F. Guo, L. Chen, W. Wu, J. Hua and H. Tian, Angew. Chem., Int. Ed., 2012, 51, 9873–9876 CrossRef CAS PubMed.
- X. Ren, S. Jiang, M. Cha, G. Zhou and Z.-S. Wang, Chem. Mater., 2012, 24, 3493–3499 CrossRef CAS.
- L. Yang, Z. Zheng, Y. Li, W. Wu, H. Tian and Z. Wang, Chem. Commun., 2015, 51, 4842–4845 RSC.
- K. Pei, Y. Wu, H. Li, Z. Geng, H. Tian and W. Zhu, ACS Appl. Mater. Interfaces, 2015, 7, 5296–5304 CAS.
- A. Shao, Y. Xie, S. Zhu, Z. Guo, S. Zhu, J. Guo, P. Shi, T. D. James, H. Tian and W. Zhu, Angew. Chem., Int. Ed., 2015, 127, 7383–7388 CrossRef.
- N. Zhou, K. Prabakaran, B. Lee, S. H. Chang, B. Harutyunyan, P. Guo, M. R. Butler, A. Timalsina, M. J. Bedzyk, M. A. Ratner, S. Vegiraju, S. Yau, C. Wu, R. P. H. Chang, A. Facchetti, M. Chen and T. J. Marks, J. Am. Chem. Soc., 2015, 137, 4414–4423 CrossRef CAS PubMed.
- N. Kaneza, J. Zhang, H. Liu, P. S. Archana, Z. Shan, M. Vasiliu, S. H. Polansky, D. A. Dixon, R. E. Adams, R. H. Schmehl, A. Gupta and S. Pan, J. Phys. Chem. C, 2016, 120, 9068–9080 CAS.
- T. N. Murakami, N. Koumura, E. Yoshida, T. Funaki, S. Takano, M. Kimura and S. Mori, Langmuir, 2016, 32, 1178–1183 CrossRef CAS PubMed.
- J. Yang, P. Ganesan, J. Teuscher, T. Moehl, Y. J. Kim, C. Yi, P. Comte, K. Pei, T. W. Holcombe, M. K. Nazeeruddin, J. Hua, S. M. Zakeeruddin, H. Tian and M. Grätzel, J. Am. Chem. Soc., 2014, 136, 5722–5730 CrossRef CAS PubMed.
- R. Y.-Y. Lin, F.-L. Wu, C.-H. Chang, H.-H. Chou, T.-M. Chuang, T.-C. Chu, C.-Y. Hsu, P.-W. Chen, K.-C. Ho, Y.-H. Lo and J. T. Lin, J. Mater. Chem. A, 2014, 2, 3092–3101 Search PubMed.
- M. Wang, S.-J. Moon, M. Xu, K. Chittibabu, P. Wang, N.-L. Cevey-Ha, R. Humphry-Baker, S. M. Zakeeruddin and M. Grätzel, Small, 2010, 6(2), 319–324 CrossRef CAS PubMed.
- G. Schulz, M. Löbert, I. Ata, M. Urdanpilleta, M. Lindén, A. Mishra and P. Bäuerle, J. Mater. Chem. A, 2015, 3, 13738–13748 CAS.
- Z. Wang, M. Liang, Y. Tan, L. Ouyang, Z. Sun and S. Xue, J. Mater. Chem. A, 2015, 3, 4865–4874 CAS.
- Z. Wang, H. Wang, M. Liang, Y. Tan, F. Cheng, Z. Sun and S. Xue, ACS Appl. Mater. Interfaces, 2014, 6, 5768–5778 CAS.
- Z. Wang, M. Liang, H. Wang, P. Wang, F. Cheng, Z. Sun and X. Song, ChemSusChem, 2014, 7, 795–803 CrossRef CAS PubMed.
- Y. Wang, L. Yang, M. Xu, M. Zhang, Y. Cai, R. Li and P. Wang, J. Phys. Chem. C, 2014, 118, 16441–16446 CAS.
- N. Cai, J. Zhang, M. Xu, M. Zhang and P. Wang, Adv. Funct. Mater., 2013, 23, 3539–3547 CrossRef CAS.
- A. Gupta, M. M. A. Kelson, V. Armel and A. Bilic, Tetrahedron, 2014, 70, 2141–2150 CrossRef CAS.
- I. R. Perera, A. Gupta, W. Xiang, T. Daeneke, U. Bach, R. A. Evans, C. A. Ohlin and L. Spiccia, Phys. Chem. Chem. Phys., 2014, 16, 12021–12028 RSC.
- H. Zhang, J. Fan, Z. Iqbal, D.-B. Kuang, L. Wang, D. Cao and H. Meier, Dyes Pigm., 2013, 99, 74–81 CrossRef CAS.
- H. Zhang, J. Fan, Z. Iqbal, D.-B. Kuang, L. Wang, H. Meier and D. Cao, Org. Electron., 2013, 14, 2071–2081 CrossRef CAS.
- W. Wu, J. Zhang, H. Yang, B. Jin, Y. Hu, J. Hua, C. Jing, Y. Long and H. Tian, J. Mater. Chem., 2012, 22, 5382–5389 RSC.
- A. Hagfeldt, G. Boschloo, L. Sun, L. Kloo and H. Pettersson, Chem. Rev., 2010, 110, 6595–6663 CrossRef CAS PubMed.
- K. Pei, Y. Wu, A. Islam, S. Zhu, L. Han, Z. Geng and W. Zhu, J. Phys. Chem. C, 2014, 118, 16552–16561 CAS.
- H. Chen, H. Huang, X. Huang, J. N. Clifford, A. Forneli, E. Palomares, X. Zheng, L. Zheng, X. Wang, P. Shen, B. Zhao and S. Tan, J. Phys. Chem. C, 2010, 114, 3280–3286 CAS.
- S. Cai, X. Hu, Z. Zhang, J. Su, X. Li, A. Islam, L. Han and H. Tian, J. Mater. Chem. A, 2013, 1, 4763–4772 CAS.
- D. Wang, W. Ying, X. Zhang, Y. Hu, W. Wu and J. Hua, Dyes Pigm., 2015, 112, 327–334 CrossRef CAS.
- K. Pei, Y. Wu, A. Islam, Q. Zhang, L. Han, H. Tian and W. Zhu, ACS Appl. Mater. Interfaces, 2013, 5, 4986–4995 CAS.
- Z.-S. Huang, X.-F. Zang, T. Hua, L. Wang, H. Meier and D. Cao, ACS Appl. Mater. Interfaces, 2015, 7, 20418–20429 CAS.
Footnote |
| † Electronic supplementary information (ESI) available. See DOI: 10.1039/c7ra05716d |
| This journal is © The Royal Society of Chemistry 2017 |

