
 Open Access Article
 This Open Access Article is licensed under a
 Creative Commons Attribution 3.0 Unported Licence
Matrix composition determines the dimensions of Bacillus subtilis NCIB 3610 biofilm colonies grown on LB agar†
Sara Kesela,
Benedikt von Bronk‡
a,
Carolina Falcón García‡b,
Alexandra Götza,
Oliver Lieleg b and
Madeleine Opitz*a
b and
Madeleine Opitz*a
aCenter for NanoScience, Faculty of Physics, Ludwig-Maximilians-Universität München, Munich, Germany. E-mail: opitz@physik.uni-muenchen.de
bInstitute of Medical Engineering IMETUM, Department of Mechanical Engineering, Technische Universität München, Garching, Germany
First published on 21st June 2017
Abstract
The production of biomolecules can provide new functionalities to the synthesizing organism. One important example is the secretion of extracellular polymeric substances (EPS) by biofilm forming bacteria. This biofilm matrix protects the individual bacteria within the biofilm from external stressors such as antibiotics, chemicals and shear flow. Previous studies have determined several main matrix components of biofilms formed by Bacillus subtilis. However, how these matrix components influence the growth behavior and final dimensions of B. subtilis biofilms has not yet been determined. Here, we combine different experimental techniques with theoretical modeling to assess this relation. In particular, we quantify the area covered by the biofilm and the biofilm height by performing time-lapse microscopy and light profilometry, respectively. We study the development of biofilms formed by two wild-type strains (B-1 and NCIB 3610) differing in their matrix composition and NCIB 3610 mutant strains lacking the ability to produce specific EPS. Based on the experimentally obtained growth dynamics, we develop a mathematical model that allows us to quantify the influence of three key biofilm matrix components on the final NCIB 3610 biofilm colony dimensions. In detail, we show that two matrix components, the exopolysaccharide produced by the epsA-O operon and the surface layer protein BslA control the area covered by the biofilm colony. The height of these mature biofilm colonies is mostly affected by BslA. Together, our results emphasize the importance of the biofilm matrix composition for biofilm growth and the final dimensions of mature B. subtilis NCIB 3610 biofilm colonies.
Introduction
Biofilms are spatially structured surface-attached communities of microbes where the individual cells are surrounded by a matrix of secreted macromolecules.1,2 This biofilm matrix can be composed of various extracellular polymeric substances (EPS) such as proteins, exopolysaccharides, lipids or nucleic acids.3–5 The EPS promotes biofilm adhesion to surfaces, provides the mechanical stability of the biofilm, and protects cells within the biofilm from chemical stresses and invasion of foreign bacteria.3,6 Although biofilm formation can be beneficial for industrial applications7 such as waste water treatment,8 biofilms growing on medical implants can cause serious infections and device failure.1,9 Biofilm formation comprises four phases: the attachment of single cells to surfaces, followed by two-dimensional cell growth and the formation of microcolonies (microcolony growth), followed by three-dimensional growth of the entire biofilm colony and biofilm maturation (macrocolony growth), and finally biofilm dispersal.10 The process of biofilm formation often involves division of labor, such as the differentiation into distinct cell types within an isogenic population seen in the bacterial species Myxococcus xanthus, Bacillus subtilis and Pseudomonas aeruginosa.11 In the case of B. subtilis, biofilm formation also includes the production of communal goods that form the biofilm matrix.2,12 In the past years, the main matrix composition has been resolved for many bacterial biofilms.2,4,13–16 Improvements in computational analyses allowed quantification of biofilm structure for biofilms grown in liquid conditions17–20 and recent technical advances in high-resolution optical microscopy enabled the investigation of the extracellular matrix structure,21,22 even at the single cell level.23 Together, those studies provided crucial information that is urgently needed to prevent or control biofilm formation,9,24 such as the fundamental role of the biofilm matrix in establishing emergent biofilm properties.25While many bacteria produce biofilms on surfaces under water-saturated conditions (in liquid),17,20,23 B. subtilis forms biofilms on solid nutrient surfaces in air, or at liquid–air interfaces.10,12,26 For these types of biofilm formation, quantitative aspects of biofilm formation have been addressed theoretically,27–30 but studies investigating how EPS production influences biofilm dimensions are just emerging.28,31,32 For example, it has been suggested that the physical mechanism responsible for the spreading of biomass in B. subtilis biofilms is the pressure generated by bacterial division.33 Two growth parameters that are typically used to describe the dimensions of a biofilm are the area covered by the biofilm and the biofilm height.34 However, it remains unclear how the different molecular components of the biofilm matrix quantitatively modulate B. subtilis biofilm growth. Deletion mutants which are unable to produce selected biofilm components can be a helpful tool to unravel the contribution of specific biomolecules on the macroscopic biofilm properties. The use of deletion mutants of B. subtilis has enabled to demonstrate that the protein BslA contributes to the strong wetting resistance35 as well as the surface stiffness and roughness of B. subtilis biofilms.36
Here, we employ a similar approach and quantify the formation of biofilm colonies grown on solid agar surfaces of two B. subtilis wild type strains (B-1 and NCIB 3610) that differ in their biofilm matrix composition,35,37–39 and a biofilm defective B. subtilis strain (BD630) which is unable to produce a biofilm on solid LB agar surfaces. Using a combination of time-lapse microscopy and light profilometry, we show that for the well-studied B. subtilis strain NCIB 3610, for which the main components of the biofilm matrix are known,35,38,39 specific matrix components control the dimensions of mature biofilm colonies. Furthermore, by fitting a logistic growth model to our experimentally obtained data for the wild-type NCIB 3610 and selected mutant strains, and separating the composed parameters into their constituting factors using a multiplicative model, we quantify the impact of these matrix elements on biofilm area coverage and biofilm height.
Materials and methods
Strains and growth conditions
The B. subtilis strains used in this study are BD630, B-1, NCIB 3610, CA017, ZK3660, N24, and bslA/tasA, as described in Table 1. LB Medium (Luria/Miller; Carl Roth GmbH, Karlsruhe, Germany) served as complex medium for all B. subtilis strains and contained the corresponding antibiotic (Table 1). Bacteria were cultivated overnight in 5 ml medium at 37 °C and 300 rpm agitation. The cultures were then diluted to an OD600 of 0.05 and grown until an OD600 of 0.1 was reached, representing the beginning of the exponential growth phase. The cultures were again diluted to an OD600 of 0.05 and 18 droplets of 0.5 μL per bacterial strain were applied to an LB-agar plate (1.5% agar, 1.5 g per 100 ml w/v). This allowed for investigating biofilm colony growth starting from single cells distributed across the agar plate. Biofilm colony growth was then investigated over a time-course of 17 h. Longer growth times were not studied as no considerable change in area or increase in height was obtained for the biofilm forming wild-type strains used in this study thereafter.| Strain | Genotype | Remaining main matrix composition | Antibiotic and concentration | Reference |
|---|---|---|---|---|
| a * Strain BD630 is a derivative of B. subtilis 168, that has the same ancestor as NCIB 3610, the so-called Marburg strain.61 B. subtilis 168 is not able to produce a proper biofilm matrix compared to NCIB 3610 due to several mutations and the lack of a plasmid required for biofilm formation.61 Hence, this strain is not able to form a biofilm and can therefore serve as a biofilm-growth negative control. + These strains are non-isogenic derivatives of strain NCIB 3610. # We confirmed deletion of the TasA protein in strain CAO17 by PCR analysis and sequencing (Fig. S7). | ||||
| B-1 | Wild type | Mainly γ-polyglutamate | None | 37 |
| NCIB 3610 | Wild type | Proteins TasA & BslA, exopolysaccharide | None | 48 |
| CA017+# | tasA::kan | Protein BslA, exopolysaccharide | Kanamycin 50 μg ml−1 | 39 |
| N24+ | bslA::cat | Protein TasA, exopolysaccharide | Chloramphenicol 5 μg ml−1 | 35 |
| ZK3660+ | epsA-O::tet | Proteins TasA & (BslA) | Tetracycline 12.5 μg ml−1 | 38 |
| bslA/tasA+ | bslA::cat, tasA::kan | Exopolysaccharide | Chloramphenicol 5 μg ml−1, kanamycin 50 μg ml−1 | This study |
| BD630 | Wild type* | Unable to form proper biofilm including exopolysaccharide | None | 49 |
For motility measurements (Fig. S1†) the cultures of NCIB 3610 and the epsA-O mutant were prepared as described above. Then, 5 droplets of 0.5 μL each were applied to LB-agar plates with varying agar concentrations (1.25% (1.25 g per 100 ml w/v), 1.50% (1.5 g per 100 ml w/v), 1.75% (1.75 g per 100 ml w/v) and 2.00% (2 g per 100 ml w/v)) and grown for 21 h in an incubator at 37 °C. Pictures of the area covered by the colonies were taken with a Nikon SMZ 25 stereoscopic microscope (Nikon, Germany).
To test if growth conditions such as medium composition and growth temperature affect the size of biofilm colonies, the tasA mutant and NCIB 3610 wild type strain were grown and plated similarly to expansion measurements, but on different plate compositions. LB agar and MSgg agar plates (minimal medium containing 5 mM potassium phosphate, 100 mM Mops, 2 mM MgCl2, 700 μM CaCl2, 50 μM MnCl2, 50 μM FeCl3, 1 μM ZnCl2, 2 μM thiamine, 0.5% glycerol, 0.5% glutamate, 50 μg ml−1 tryptophan, 50 μg ml−1 phenylalanine, and 50 μg ml−1 threonine) were used and both types of plates were incubated at 30 °C and 37 °C for different time-spans (Fig. S2†).
Construction of the bslA/tasA double deletion mutant
For the construction of the bslA/tasA double deletion mutant, genomic DNA of the CA017 mutant (Table 1) was purified using the MasterPure™ Gram positive DNA Purification Kit (Epicentre). Then, 1 μg ml−1 of the genomic DNA was transformed into the N24 strain (Table 1). Transformants were selected on LB agar plates containing kanamycin (50 μg ml−1) and chloramphenicol (5 μg ml−1). Successful transformation was confirmed by sequencing.Analysis of area coverage
The area covered by a bacterial colony of a strain unable to form a biofilm (BD630, Table 1) or a strain able to form a biofilm (biofilm colony, all other strains) was recorded using an upright microscope (90i, Nikon, Düsseldorf, Germany). Bright field images were taken with a DS-Qi1MC digital camera (Nikon). For the first 90 min, an image was obtained for each droplet every 15 min using a 50× objective. After 90 min, the bacteria had covered the initial area, and the following images were taken every hour with a 1× objective for a total time span of 17 h. To prevent dehydration of the agar plates and to ensure a constant temperature of 37 °C over the whole time-course of the experiment, the agar plates were kept in a custom made climate chamber (Pecon GmbH, Erbach, Germany) on the microscope. Experiments were conducted on three different days resulting in ∼36 data curves for each strain. Image analysis was performed using a self-written script in MatLab (Version 2013b). Microscopy images presented in Fig. 1A were obtained with a Nikon SMZ 25 stereoscopic microscope. Images of biofilm colony morphology (Fig. 2A and 3A) were obtained with a stereomicroscope (Nikon SMZ1000) and the colonies were grown in an incubator (INNOVA 4200, New Brunswick) for 17 h. Consequently, their final biofilm colony size differs slightly from biofilm colonies grown directly on the microscope. However, the biofilm colony morphology is comparable to biofilm colonies grown on the upright microscope used for the quantitative analysis of area coverage.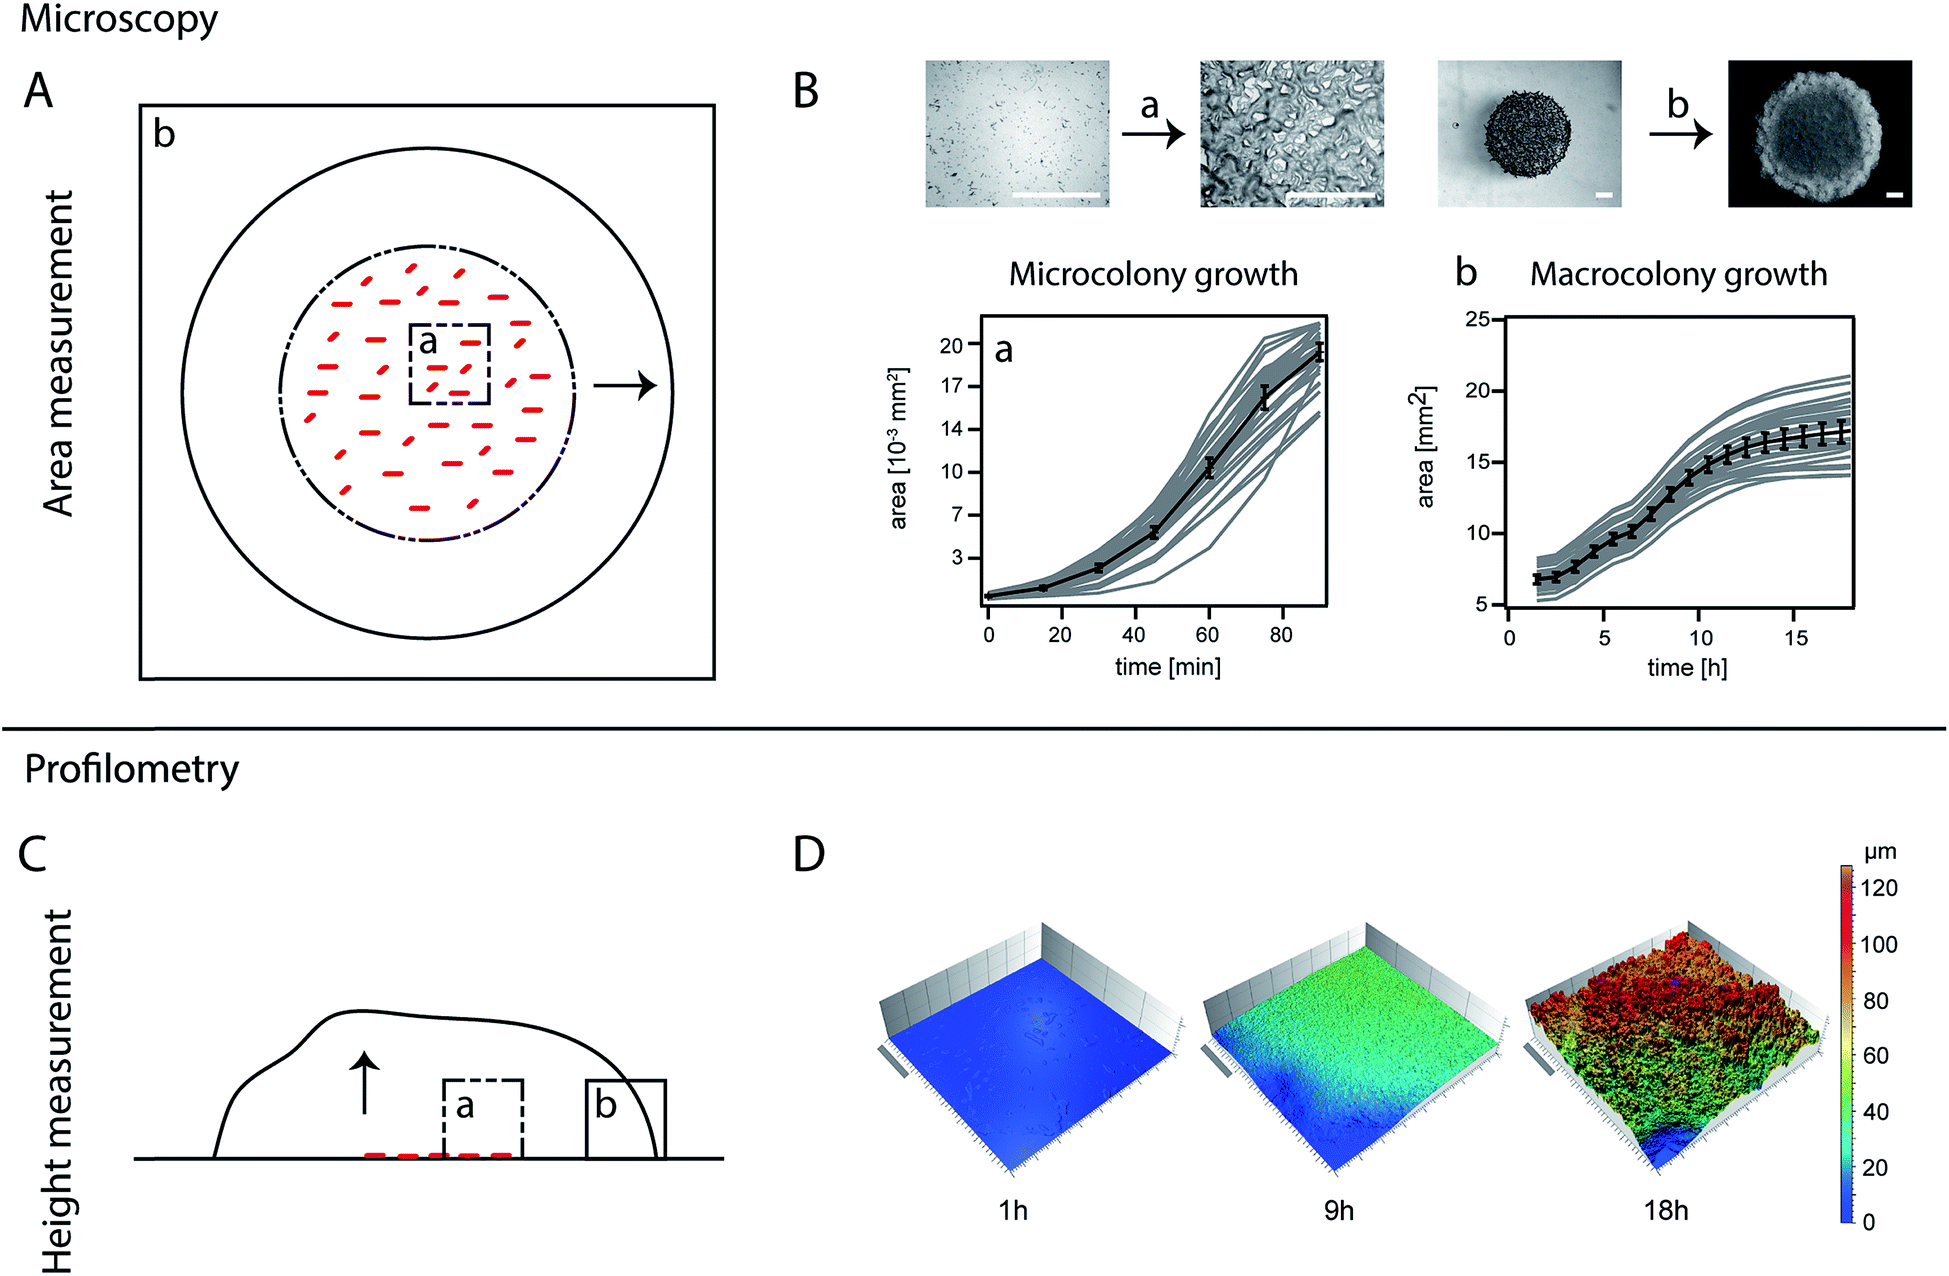 | ||
| Fig. 1 Display of methods. (A) Scheme of area measurement using upright time-lapse microscopy. The dotted line circle represents the initial area covered by the applied droplet. Single cell growth is detected using a 50× objective in image section (a). As the microcolonies grow together, the initial area is fully covered and growth takes place also in the third dimension. Hence the growth of the macrocolony (represented by the arrow) is detected with a 1× objective and observed in image section (b). (B) Biofilm colony growth of Bacillus subtilis NCIB 3610 is detected (microscopic growth (a) and macroscopic (b)). Single biofilm colony growth traces (light grey) are averaged (black). The error bars represent the 95% confidence intervals. Above the graphs, example microscopy images are shown for the beginning and end points of each graph. The last image of image section (a) is taken at the same time point as the first image of image section (b), namely 90 min, at different magnifications. The scale bar for image section (a) and (b) corresponds to 500 μm. (C) Scheme of the relative height measurement with light profilometry. Throughout the whole experiment, images were taken with a 20× objective. The image section (a) was moved gradually at each time-point (b), as the colony grew in area and in height (arrow), in order to always have a small section of the agar in one corner of the image as reference of ground. (D) Example images show the relative height development of Bacillus subtilis NCIB 3610 biofilm colonies beginning with single cells on the agar surface (1 h) up to fully grown biofilms at 18 h. The same images were additionally used to calculate the biofilm colony surface roughness. The scale bar is 0.2 mm. | ||
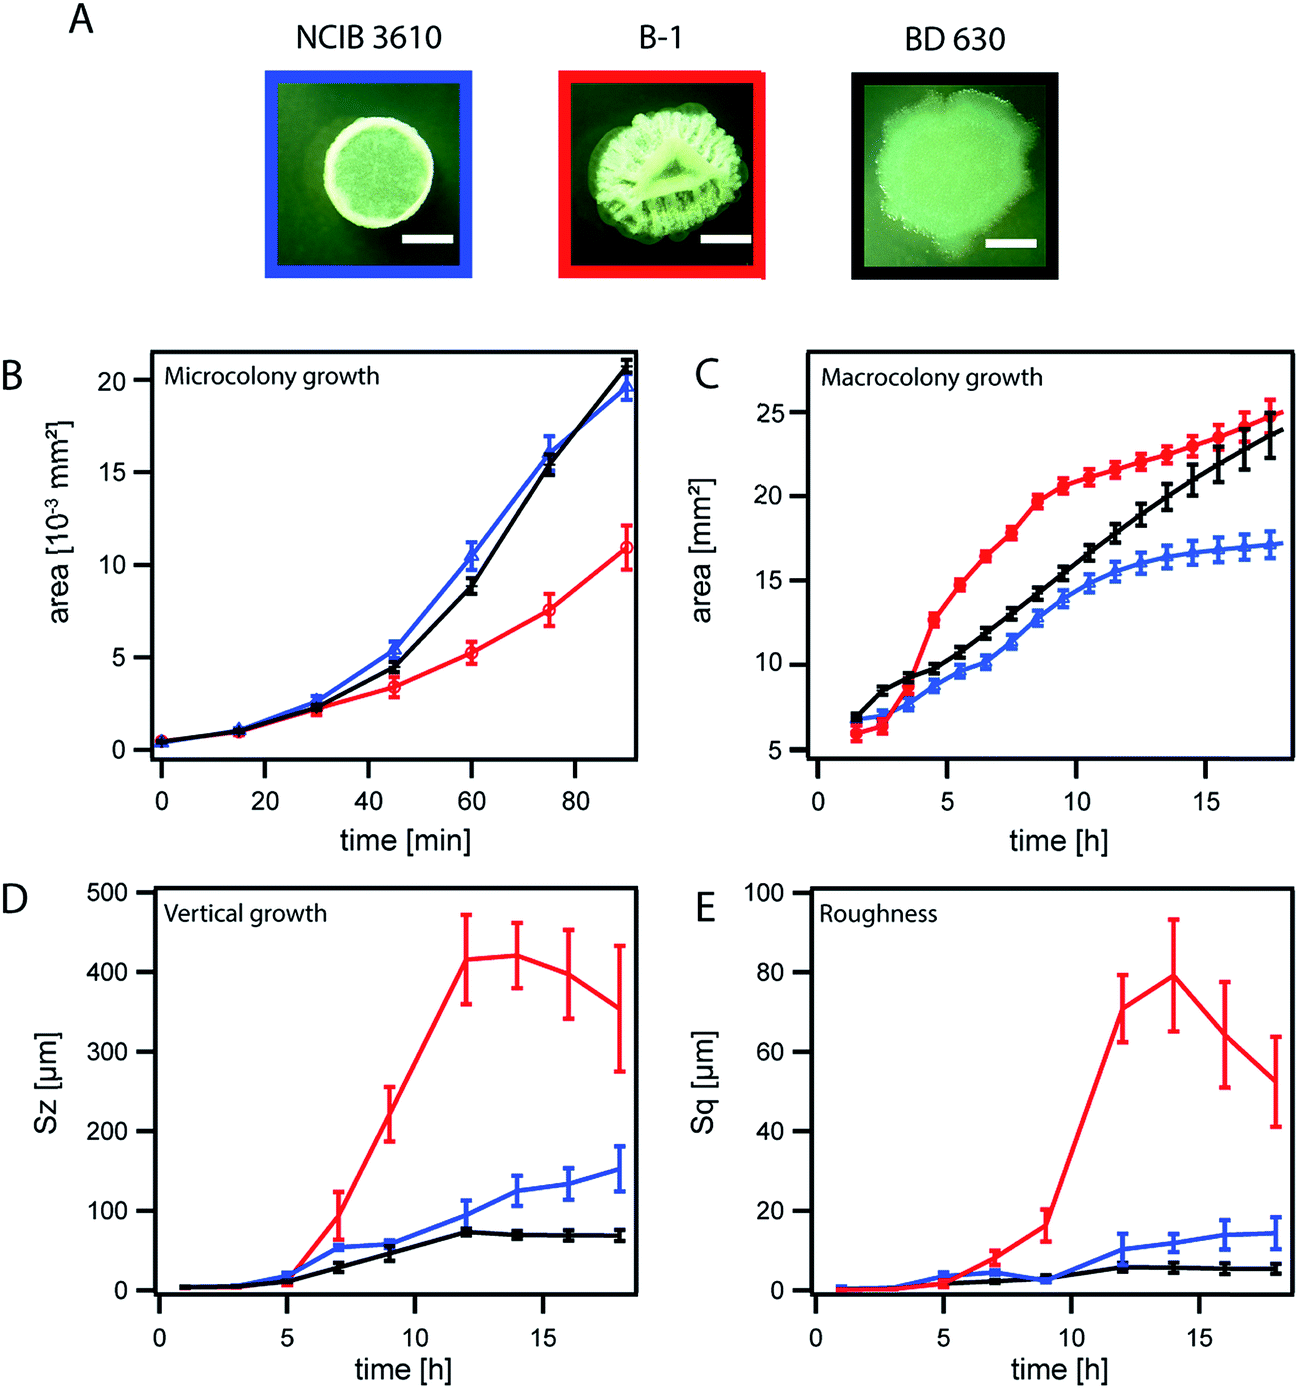 | ||
| Fig. 2 Biofilm colony growth for the wild-type strains B. subtilis NCIB 3610 and B-1 in comparison to non-biofilm forming strain BD630. NCIB 3610 is depicted in blue, B-1 in red and BD630 in black. The error bars are the 95% confidence intervals. (A) Images of biofilm macrocolonies taken at 18 h of growth, the scale bar represents 2 mm. (B) Microcolony area growth. (C) Macrocolony area growth. (D) Relative biofilm height increase (vertical growth) given by the Sz value. (E) Increase in biofilm surface roughness, given by the parameter Sq. | ||
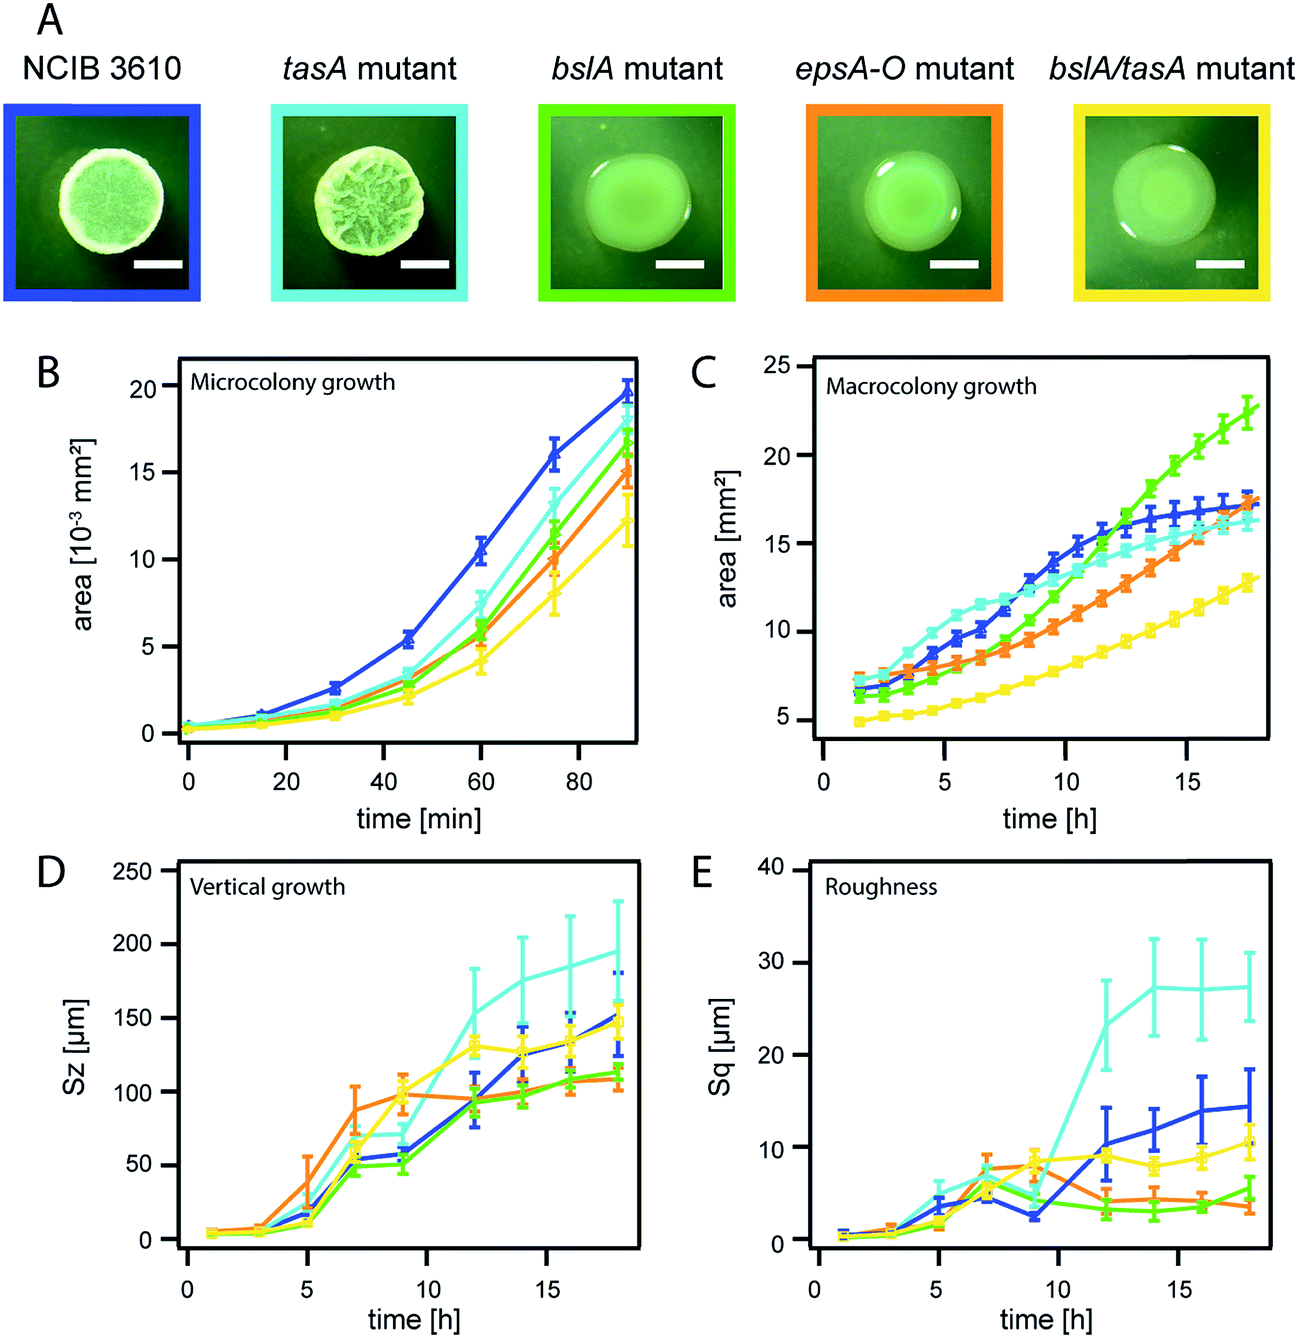 | ||
| Fig. 3 Biofilm matrix composition determines the dimensions of mature Bacillus subtilis NCIB 3610 biofilm colonies. NCIB 3610 is depicted in blue, the tasA deletion mutant in turquoise, the bslA deletion mutant in green, the epsA-O deletion mutant in orange and the bslA/tasA double deletion mutant in yellow. The error bars are the 95% confidence intervals. (A) Images of biofilm macrocolonies at 18 h. The scale bar represents 2 mm. Please note that the same image of strain NCIB 3610 is given as in Fig. 2A. (B) Microcolony area growth. (C) Macrocolony area growth. (D) Relative biofilm height (vertical growth) represented by the parameter Sz. (E) Increase in biofilm surface roughness, represented by the parameter Sq. | ||
Analysis of biofilm colony height and biofilm colony roughness
To investigate the height and roughness development of growing biofilm colonies, light profilometry images of these colonies were obtained for a period of 17 h. The measurements were performed on two different days, resulting in 14 data curves per strain. The images were acquired at an edge of the biofilm colonies, such that a corner of the image would not contain biofilm (Fig. S3†). Profilometry surface images were taken every two hours with a NanoFocus μsurf profilometer (NanoFocus AG, Oberhausen Germany) using a 20× objective, resulting in surface images with an area of 800 × 772 μm. The data was evaluated with the software μsoft (Version 6.0, NanoFocus AG, Oberhausen, Germany) to obtain two metrological surface parameters: the root mean squared surface roughness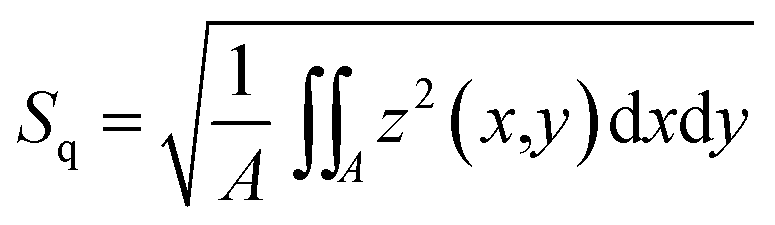 , and the maximum height Sz, which represents the distance between the highest peak and the deepest valley of a given image. For the calculation of both parameters, a correction method was applied to early stage biofilms so that the agar structure below the biofilm colonies does not contribute to the calculated parameters. This agar layer was subtracted using a linear correction method which removes the tilt of the surface (see Fig. S3a–c†). The resulting image shows a surface profile corresponding to the biofilm colony only (Fig. S3c†). At later stages (growth times > 5 h), the biofilm colonies form a continuous layer on the agar surface. For these images, it is not possible to perform the same correction anymore as it is very difficult to distinguish the tilted agar layer from a (potentially also tilted) continuous biofilm layer. Therefore, at these growth times, values for Sz were calculated from the uncorrected profilometry images (Fig. S3a†). For the calculation of Sq at growth times later than 5 h (when a continuous biofilm layer had formed), only data from the image quadrant (a region of 400 × 382 μm) opposite to the agar border was analyzed (Fig. S3e†). This procedure ensured that the edge of the biofilm colony itself did not contribute to the calculated Sq values. Data presentation was partly performed using Igor Pro 6.37.
Bacterial population growth
Bacterial population growth (Fig. S4†) was analyzed with a plate reader (POLARstar OPTIMA, BMG Labtech). Overnight cultures were generated as described above, and diluted to an OD600 of 0.05 in 0.5 ml LB medium. Bacterial population growth was followed for ∼6 h while the cultures were maintained at constant shaking at 37 °C. Optical density was measured at 600 nm every 15 min. The resulting population growth curves represent a mean of at least eleven wells. From this data, after blank correction, the population growth rate (GR) was obtained as follows: population growth curves as represented by OD600 were fitted using the linear fit function (fL = a + b × x, with a the y-intercept and b the slope of the function) of the IGOR PRO 6.36 software to fit the natural logarithm of the population growth curves. Then, population growth rate (GR) was calculated according to:40 GR = b/ln(2).Mathematical fitting of the growth parameters area coverage and biofilm height
Each matrix component can affect the final dimensions of the biofilm colony (area covered by the biofilm and biofilm height) in three different ways: (a) by simply adding biomass, (b) by changing the growth rate of the respective strain in the macroscopic growth rate regime, as it has been shown that the fitness of non-matrix producing cells increases under planktonic conditions,41 and (c) by crosslinking the individual cells within the biofilm. As these different mechanisms are closely interconnected and cannot clearly be disentangled, we chose to fit the experimentally obtained data, to retrieve the carrying capacity as a measure of the final dimension of the biofilm colony in the absence or presence of a particular matrix component. Hence, the carrying capacity quantifies how the dimensions of the biofilm colony are affected by a particular matrix component, as a sum of all of the above described mechanisms. The fitting of the experimental data is described in the following. How the carrying capacity is used in the subsequent mathematical model to calculate the influence of each matrix component on the final biofilm colony dimensions is described in the next main paragraph.In the experiments, we observed sigmoidal data curves in the macrocolony regime for the development of the area covered by the biofilm colony and for biofilm colony height. From a variety of different sigmoidal functions,42 we chose the solution of the logistic differential equation (eqn (1)) for modeling our data.
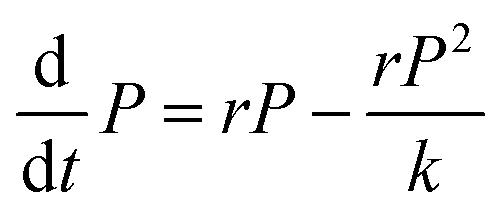 | (1) |
The advantage of this model is its simplicity, as it only requires three free fitting parameters. Moreover, since its introduction in the 19th century43 it became textbook knowledge for the modeling of population dynamics.44 In this model, a population with P individuals grows with rate r until it reaches the carrying capacity k. The sigmoidal solution has the following form (eqn (2)):
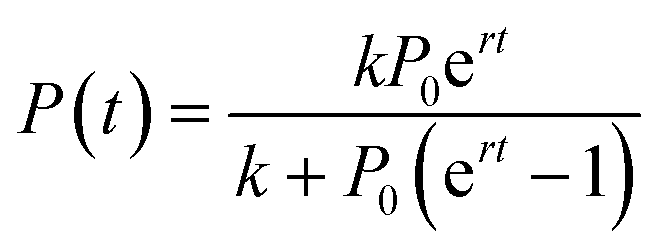 | (2) |
We assumed that, within a given strain, there are always forces that act in favor or against the development of a biofilm colony's characteristic dimensions, such as area covered by the biofilm colony and the biofilm colony height. Furthermore, we assumed, that those forces influence both the rate of development (r) and the final level (k) of these dimensions. This reasoning motivated us to apply the logistic growth model to the two growth parameters of interest (area covered by the biofilm colony and biofilm colony height) (eqn (3)). As the biofilm roughness also increased sigmoidally with time, the same fitting procedure was applied to the surface roughness data (Fig. S5†).
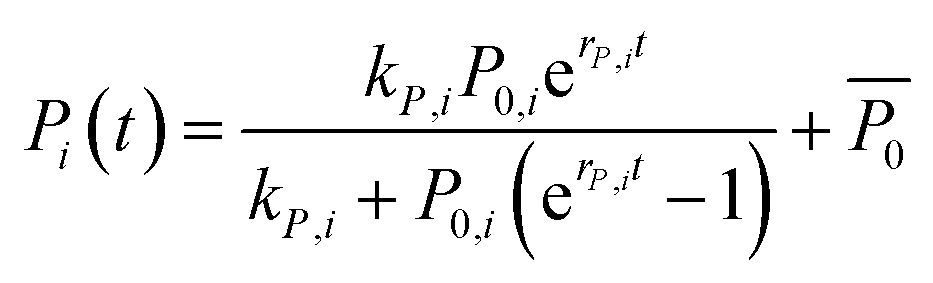 | (3) |
Here, Pi(t) describes the temporal development of the dimension of interest P (biofilm colony area coverage or biofilm colony height) for a strain i. The fitted parameters kP,i, P0,i, and rP,i describe the carrying capacity (saturation value of the respective growth parameter corresponding to the final dimension of the biofilm colony), the level at t = 0, and the rate of increase of the two growth parameters, respectively. 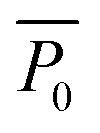 is not a fitting parameter but describes the average initial value for the considered strains.
With this model, we performed nonlinear least square regression using the Levenberg–Marquardt algorithm45 as implemented in the Matlab Curve fitting toolbox. Initial values of kP,i and P0,i for the optimization procedure were taken from the final and first value of the considered time trace of the two growth parameters, respectively.
To determine the inflection points of the biofilm colony area growth curves, we calculated the maximum difference between subsequent values of the sigmoidal fit curves numerically. This is equivalent to calculating the maximum of the first derivative, that is the inflection point.
In order to calculate the uncertainty of the fitting parameters (fitting parameter vector θ = (k, P0, r)), the weighted Jacobian matrix  was explicitly calculated in the vicinity of the optimal fitting parameters. Here, σi is the standard deviation of the experimentally observed data measured at time ti. Then, we used the following formula to estimate the variance of the fitting parameters Δθj2 = var(θj) = ([XTX]−1)j,j as described in ref. 46.
Mathematical model of biofilm matrix composition affecting biofilm colony growth
In the sigmoidal model (eqn (3)), the final saturation value of the biofilm colony dimensions P (biofilm area coverage and biofilm height) is given by the carrying capacity kP,i for each strain i. For clarity, we restricted ourselves to show the reasoning for just one biofilm colony dimension and omit the index P in the following. We assumed that the carrying capacities of biofilm colony dimensions are primarily determined by growth through cell division of the individual bacterial cells within the biofilm colony and are independent of the biofilm matrix elements. Then, this biofilm colony growth due to bacterial cell division contributes a basal level β0 to the carrying capacity. However, the embedding of cells in the extracellular matrix can increase or decrease the strain's ability to develop the considered biofilm colony dimension (biofilm area coverage and biofilm height) compared with the basal level β0. This effective phenomenological alteration can be modeled through multiplication by a factor βi for a biofilm matrix element i. This motivates the following multiplicative ansatz for the carrying capacity of a given mutant strain
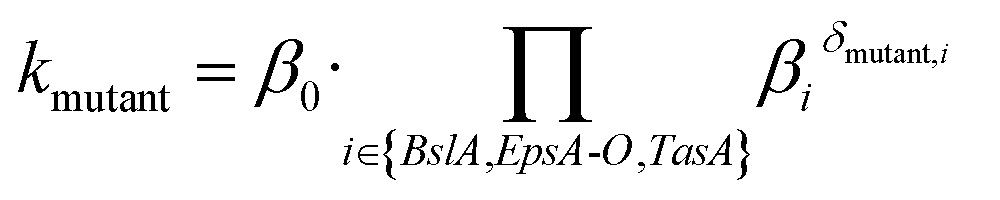 | (4) |
Here, the contribution indicator 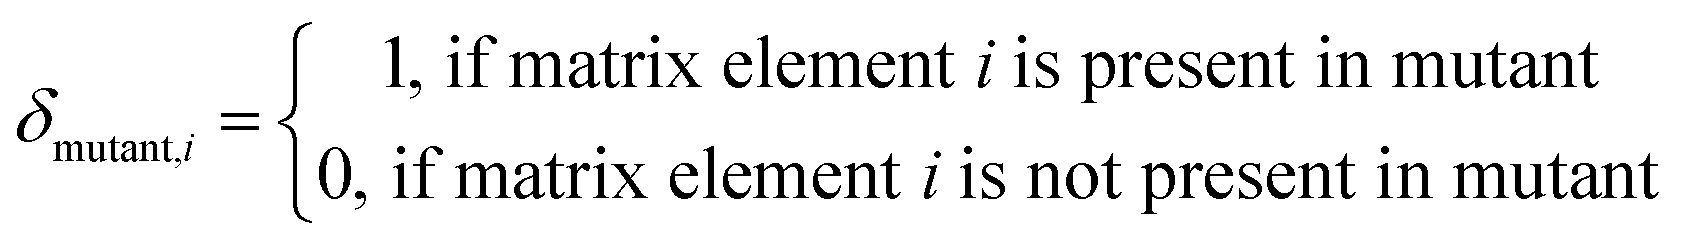 is used.
Kobayashi and Iwano, 201235 have shown that the production of the surface layer protein BslA depends on the expression of the epsA-O operon, which is responsible for the production of the exopolysaccharide. Hence, δEpsA-O,i is set to zero for both biofilm matrix components (BslA and the exopolysaccharide) in the epsA-O mutant. Ostrowski et al., 201147 showed that BslA is not involved in the synthesis, export, or polymerization of the TasA amyloid fibers or the exopolysaccharide. Therefore, a feedback effect of BslA on the expression of TasA or the exopolysaccharide is not incorporated into our model. In addition, further feedback mechanisms or unknown factors that might contribute to the biofilm matrix are not considered.
More explicitly, this leads to the following system of equations for the carrying capacities of the NCIB 3610 and the three single deletion mutants bslA, tasA and epsA-O:
| kWT = β0·βBslA·βEpsA-O·βTasA |
| ktasA = β0·βBslA·βEpsA-O·1 |
| kbslA = β0·1·βEpsA-O·βTasA |
| kepsA-O = β0·1·1·βTasA | (5) |
For the wild-type strain, the carrying capacity includes all factors; the basal rate β0 and the contributions of all matrix elements: βBslA, βEpsA-O, and βTasA. For the single deletion strains of the proteins TasA or BslA, the contributions of the lacking matrix components are absent. The carrying capacity of the epsA-O mutant does not have contributions from both the exopolysaccharide and BslA because the production of the exopolysaccharide is necessary for BslA production.35 This system of four equations with four unknowns (eqn (5)) can be easily solved to obtain values for the individual factor βj of each of the matrix elements (Table S3†). Note that βEpsA-O only contains contributions due to its own activity and not due to its coupling to BslA production. Uncertainties of the factors Δβj are calculated from the uncertainties of the carrying capacities Δki by uncertainty propagation. Please note, that the same set of equations (eqn (5)) have also been used to model the development of the biofilm colony surface roughness (Table S3†).
Based on the model described above, we can calculate the carrying capacity of the bslA/tasA double deletion mutant using the following equation:
| kbslAtasA = β0·1·βEpsA-O·1 | (6) |
This predicted value of the double deletion mutant is then compared to the value of the carrying capacity calculated by fitting the experimentally obtained growth parameters: biofilm area coverage and biofilm height. This procedure allows us to investigate possible feedback effects between the BslA and the TasA protein (Table S2†).
Results
Biofilm colony growth of B. subtilis wild type strains
The dimensions of a mature bacterial biofilm colony can be described by two growth parameters: the area covered by the biofilm and the biofilm height. We investigated biofilm colony growth (biofilm colony development over time) starting from single cells distributed across the agar plate (Fig. 1A and B, Section a), and followed this growth over a time-course of 17 h to allow the analysis of micro and macrocolony biofilm growth (Fig. 1A). To determine the area increase for growing Bacillus subtilis biofilm colonies, we performed time-lapse microscopy (Methods), and investigated the area coverage for both the micro and macrocolony biofilm growth phases (Fig. 1A). During the microcolony growth phase, single cells dividing in the initially spotted zone first fill up this area and then start to grow into the third dimension approximately 60–90 min after inoculation. This phase is followed by the macrocolony growth phase; here, the whole three-dimensional biofilm colony expands in range. During this expansion, the biofilm colony is not only expected to increase its thickness but also to develop a rough surface.36 Hence, a parallel analysis of the biofilm colony surface roughness can serve as an indicator for accurate biofilm colony formation. To quantify biofilm height development and alterations in biofilm surface roughness, we performed light profilometry (Fig. 1B). As the biofilm height of all studied strains did not increase within the first three hours (microcolony growth phase) (Table 1), we did not distinguish micro and macrocolony growth in our profilometer studies. The Sz value was calculated, as it is a parameter that describes the absolute height of the biofilm surface, and the parameter Sq was chosen to quantify the biofilm surface roughness (see Methods and Fig. S3†).In the first experiment, we analyzed the two biofilm colony growth-parameters: area coverage and biofilm height, for two biofilm forming Bacillus subtilis wild type strains (B-1![[thin space (1/6-em)]](https://www.rsc.org/images/entities/char_2009.gif) 37 and NCIB 361048 ) that differ in their biofilm matrix composition (Table 1). Whereas the biofilm matrix of NCIB 3610 is described to be mainly composed of two proteins (BslA and TasA) and an exopolysaccharide;35,38,39 the biofilm matrix of strain B-1 is described to be mainly composed of γ-polyglutamate.37 The results obtained for these biofilm forming strains was compared to data obtained for a B. subtilis strain (BD630,49 Table 1) that is unable to form a biofilm (Fig. 2A). We observed that the strains NCIB 3610 and BD630 exhibit a similar microcolony growth behavior, whereas strain B-1 grew considerably slower (Fig. 2B). The previous finding was unexpected as these three strains grow similarly in a well-mixed liquid environment (Fig. S4 and Table S1†) and possess a similar cell size when grown on LB agar plates (Fig. S6a and b†). A possible explanation for the observed slower microcolony area growth of strain B-1 in comparison to strain NCIB 3610 could be that B-1 initiates growth into the third dimension at earlier time points and thus invests less biomass into lateral expansion. However, this was not the case (Fig. S6c†), which led us to the hypothesis that the slower microcolony growth observed for B. subtilis B-1 on LB agar plates might be attributed to the presence of γ-polyglutamate (γ-PGA).37 Basal expression of this matrix element, which is absent in NCIB 3610 biofilms, could interconnect single bacterial cells, resulting in a reduced lateral-expansion-rate during microcolony growth. In contrast, it was shown that biofilm matrix gene expression is induced at later time-points in strain NCIB 3610, i.e., when a critical colony thickness (growth into the third dimension = macrocolony growth) is reached.28 Furthermore, EPS expression at the single cell level can only be triggered by reducing nutrient concentration.28 Such nutrient limiting conditions are, however, absent in the microcolony growth phase when cells are grown on nutrient-rich LB medium as done in this study.
37 and NCIB 361048 ) that differ in their biofilm matrix composition (Table 1). Whereas the biofilm matrix of NCIB 3610 is described to be mainly composed of two proteins (BslA and TasA) and an exopolysaccharide;35,38,39 the biofilm matrix of strain B-1 is described to be mainly composed of γ-polyglutamate.37 The results obtained for these biofilm forming strains was compared to data obtained for a B. subtilis strain (BD630,49 Table 1) that is unable to form a biofilm (Fig. 2A). We observed that the strains NCIB 3610 and BD630 exhibit a similar microcolony growth behavior, whereas strain B-1 grew considerably slower (Fig. 2B). The previous finding was unexpected as these three strains grow similarly in a well-mixed liquid environment (Fig. S4 and Table S1†) and possess a similar cell size when grown on LB agar plates (Fig. S6a and b†). A possible explanation for the observed slower microcolony area growth of strain B-1 in comparison to strain NCIB 3610 could be that B-1 initiates growth into the third dimension at earlier time points and thus invests less biomass into lateral expansion. However, this was not the case (Fig. S6c†), which led us to the hypothesis that the slower microcolony growth observed for B. subtilis B-1 on LB agar plates might be attributed to the presence of γ-polyglutamate (γ-PGA).37 Basal expression of this matrix element, which is absent in NCIB 3610 biofilms, could interconnect single bacterial cells, resulting in a reduced lateral-expansion-rate during microcolony growth. In contrast, it was shown that biofilm matrix gene expression is induced at later time-points in strain NCIB 3610, i.e., when a critical colony thickness (growth into the third dimension = macrocolony growth) is reached.28 Furthermore, EPS expression at the single cell level can only be triggered by reducing nutrient concentration.28 Such nutrient limiting conditions are, however, absent in the microcolony growth phase when cells are grown on nutrient-rich LB medium as done in this study.
During macrocolony growth, the area growth curves of the two biofilm forming wild-type strains possess a sigmoidal shape with a clear saturation. In contrast, the area growth-curve obtained for the non-biofilm forming strain BD630 is almost linear and does not saturate within the time-course of the experiment (Fig. 2C). When applying a sigmoidal fit to this data (Methods, Fig. S5a†), we observed that for both biofilm forming strains the inflection point of the sigmoidal fit lies below or close to 6 h. For the strain unable to form a biofilm, however, this inflection point occurs significantly later, i.e., somewhat after 9 h (Fig. S5a and e†).
Together, the data obtained for microcolony and macrocolony biofilm growth indicate that it is not the individual growth rates of the different strains, but other factors such as the composition of the biofilm matrix, that determine the lateral expansion of biofilm macrocolonies. During the macrocolony growth phase, the biofilm matrix could serve either as a structural element interconnecting individual cells within the biofilm colony, or simply as additional biomass allowing for faster biofilm spreading.
We next assessed the development of the biofilm height over time for the three strains NCIB 3610, B-1 and BD630 using light profilometry. At the edge of the biofilm colony, we observed that the two biofilm formers develop more height over time than the non-biofilm forming strain (Fig. 2D). Furthermore, the height increase of strain B-1 biofilm colonies is by a factor of 2.3 larger than that of biofilm colonies formed by strain NCIB 3610. This can be explained by the larger amount of biomass produced by B-1 biofilms.36 We next speculated that a higher amount of produced biomass should also result in an increased surface roughness. To verify this hypothesis, we also analyzed the surface roughness of biofilm colonies formed by the three B. subtilis strains over time. Indeed, B-1 biofilm colonies exhibit the strongest increase in surface roughness, followed by strain NCIB 3610 (Fig. 2E). In contrast, BD630 exhibited a smooth colony surface (Fig. 2A and E). The final surface roughness values at 17 h obtained for biofilm colonies formed by strains B-1 and NCIB 3610 agree with previous investigations36 and correlate well with the rough biofilm colony morphology seen in microscopy images (Fig. 2A).
Interestingly, strain B-1 exhibited a reduction in both biofilm colony height and surface roughness at later time-points. We believe, that the strong formation of wrinkles observed for strain B-1 (Fig. 2A) (a feature that is less pronounced for biofilm colonies generated by strain NCIB 3610 and fully absent for colonies generated by strain BD630) leads to an increase in the experimental error for data obtained with the profilometer at time-points later than 12 h. After 12 h the local area that is imaged with the profilometer to obtain the Sz and Sq values (Methods) differs at each time-point. Hence, for biofilm colonies generated by strain B-1, the profilometric images might be obtained either on top of a wrinkle or within a valley, which increases the error at later time-points.
Matrix composition determines the dimensions of mature NCIB 3610 B. subtilis biofilm colonies
Up to now, we have investigated the temporal development of two biofilm colony growth parameters, area coverage and height increase, for two biofilm forming and one non-biofilm forming strains. We detected compelling differences in both growth parameters for the biofilm formers in comparison to the non-biofilm forming strain. This indicated that the matrix produced by the biofilm forming strains could affect these growth parameters. To further investigate the influence of the matrix composition on the dimensions of mature biofilm colonies, we focused on the well-studied strain NCIB 3610, for which the main components of the biofilm matrix are known. The matrix of B. subtilis strain NCIB 3610 biofilms is mainly composed of an exopolysaccharide produced by the gene products of the epsA-O operon38 and an amyloid fiber-forming protein, TasA.39,50 A second biofilm matrix protein, BslA, is a self-assembling hydrophobin which is primarily found on the surface of B. subtilis NCIB 3610 biofilms.35,51 To quantify the influence of those three matrix biomolecules, we next analyzed the temporal evolution of the two biofilm colony growth parameters for three different mutants of strain NCIB 3610. Each of these mutant strains lacks the ability to produce a particular matrix component. The data obtained for biofilm colonies formed by these mutant strains was then compared to the data obtained for the NCIB 3610 wild type strain (Fig. 3A). We noted similar development in biofilm area coverage for all studied NCIB 3610 strains during microcolony biofilm growth (Fig. 3B), which underscores that the individual strain growth rate (Fig. S4 and Table S1†) does not affect micro and macrocolony growth behavior.During macrocolony growth, the lateral expansion of biofilm colonies formed by the mutant strain unable to produce the TasA fiber forming protein does not considerably differ from the lateral expansion obtained for the wild-type NCIB 3610 strain (Fig. 3C). This finding was unexpected, as the tasA mutant forms notably smaller biofilm colonies than the NCIB 3610 wild-type when grown on MSgg medium.39 We attributed this observation to the different growth conditions used in this study (Fig. S2†). Whereas the absence of TasA (Fig. S7†) does not affect the lateral biofilm expansion of biofilm colonies grown on LB agar, the absence of the surface layer protein BslA leads to a delay in macrocolony growth (Fig. 3C), but results in a larger final biofilm area coverage compared to the wild-type strain. A third mutant, one that is unable to produce the exopolysaccharide, showed an even longer delay in macrocolony growth but reached a similar biofilm area coverage as the wild-type strain at the end of the experiment (Fig. 3C). This shows that both the surface layer protein BslA and the exopolysaccharide affect the area covered by the biofilm colony.
When investigating the height increase for biofilm colonies formed by these mutant strains, we obtained a different picture. Absence of the TasA fiber forming protein resulted in an increase of the final biofilm height by ∼30% compared to the wild-type strain (Fig. 3D). Again, this finding was unexpected as tasA biofilm pellicles formed on MSgg medium are considerable decreased in biofilm height compared to pellicles generated by the wild-type strain.52 Whereas the absence of the TasA protein leads to an increased biofilm height for biofilm colonies grown on LB agar plates, the absence of the BslA protein led to a decrease of the final biofilm height by ∼30%. A similar result was obtained for biofilm colonies formed by the epsA-O mutant strain. As the production of the exopolysaccharide is required for the production of the BslA protein,35 we can mostly attribute the decrease of the final biofilm height observed in biofilm colonies formed by the epsA-O mutant to the absence of BlsA in these biofilms. In summary, two main matrix components: the surface layer protein BslA and the TasA fiber forming protein, contribute to controlling the height of biofilm colonies formed by the strain NCIB 3610.
In a next step, we analyzed the increase in biofilm colony surface roughness by calculating the Sq value (see Methods) at different time points of biofilm formation. We observed that the biofilm colony formed by the mutant unable to produce the TasA protein has the roughest final biofilm surface, followed by the surface of NCIB 3610 wild-type biofilms. In contrast, biofilm colonies formed by the epsA-O mutant and the bslA mutant show smooth surfaces (Fig. 3E). This finding, together with the small height increase observed for these two mutant strains, indicates that biofilm formation by these strains is heavily impaired. This conclusion also agrees with the colony morphology seen in microscopy images (Fig. 3A).
The kinetics of the lateral biofilm colony expansion data also showed differences for the three mutant strains (Fig. S5†). Here, the macrocolony growth curves of both the tasA mutant and the NCIB 3610 wild type strain have an inflection point at ∼6 h, whereas in the data obtained for the bslA mutant and the epsA-O mutant, the inflection points occurred considerably later, at ∼11 and 13 h, respectively (Fig. S5†). Hence, we conclude that the quality of biofilm formation by bacteria of the genera B. subtilis can be estimated by the inflection point of the sigmoidal fit applied to the biofilm area coverage data, where an early inflection point indicates efficient three-dimensional biofilm colony formation.
Quantifying the contribution of matrix biomolecules on NCIB 3610 B. subtilis biofilm colony dimensions
Our experimental analysis demonstrated that specific matrix components control the dimensions of mature B. subtilis NCIB 3610 biofilm colonies when grown on LB agar plates. Next, we aimed at quantifying the influence of these main matrix components on the dimensions of mature NCIB 3610 biofilm colonies. To do so, we set up a mathematical model to analyze the saturation values calculated by fitting the experimental data curves obtained for the two growth parameters: biofilm area coverage and biofilm height (Methods). We assumed that the saturation values of mature biofilm colony dimensions are primarily determined by growth through cell division of the individual bacterial cells within the biofilm colony, and that this basal biofilm growth rate is independent of the presence or absence of specific biofilm matrix elements. However, in the presence of biofilm matrix elements, the bacterial cells embed themselves in an extracellular matrix. Compared with the basal biofilm growth rate (cell division occurring at all phases of biofilm formation), this embedding process may increase or decrease the strain's ability to expand laterally or grow in height. We translated this assumption into a multiplicative model (Methods) where the influence of each of the main biofilm matrix elements (TasA, BslA and the exopolysaccharide) on the growth parameters (biofilm area coverage and biofilm height) are considered in terms of a simple factor which can either boost or retard basal biofilm growth. In this model, we also accounted for the fact that BslA biosynthesis depends on the expression of the epsA-O operon responsible for the production of the exopolysaccharide35 (Methods). The quantitative results obtained from applying this model to the investigated biofilm colony growth are given in the inset of Fig. 4A. Values equal to one indicate no influence, values above 1 indicate that this matrix component leads to an increase in the respective biofilm growth parameter, and values below 1 indicate that this matrix component retards biofilm colony growth. Our results suggest that the surface layer protein BslA decreases lateral expansion of the biofilm during macrocolony growth, whereas TasA and the exopolysaccharide stimulate it. In contrast, TasA reduces the final height of mature biofilm colonies grown on LB agar, whereas the exopolysaccharide and primarily BslA increase biofilm height. Hence, our mathematical model underscores our previous conclusions and quantifies the impact of the NCIB 3610 main matrix components on the final dimensions of mature biofilm colonies formed by this strain.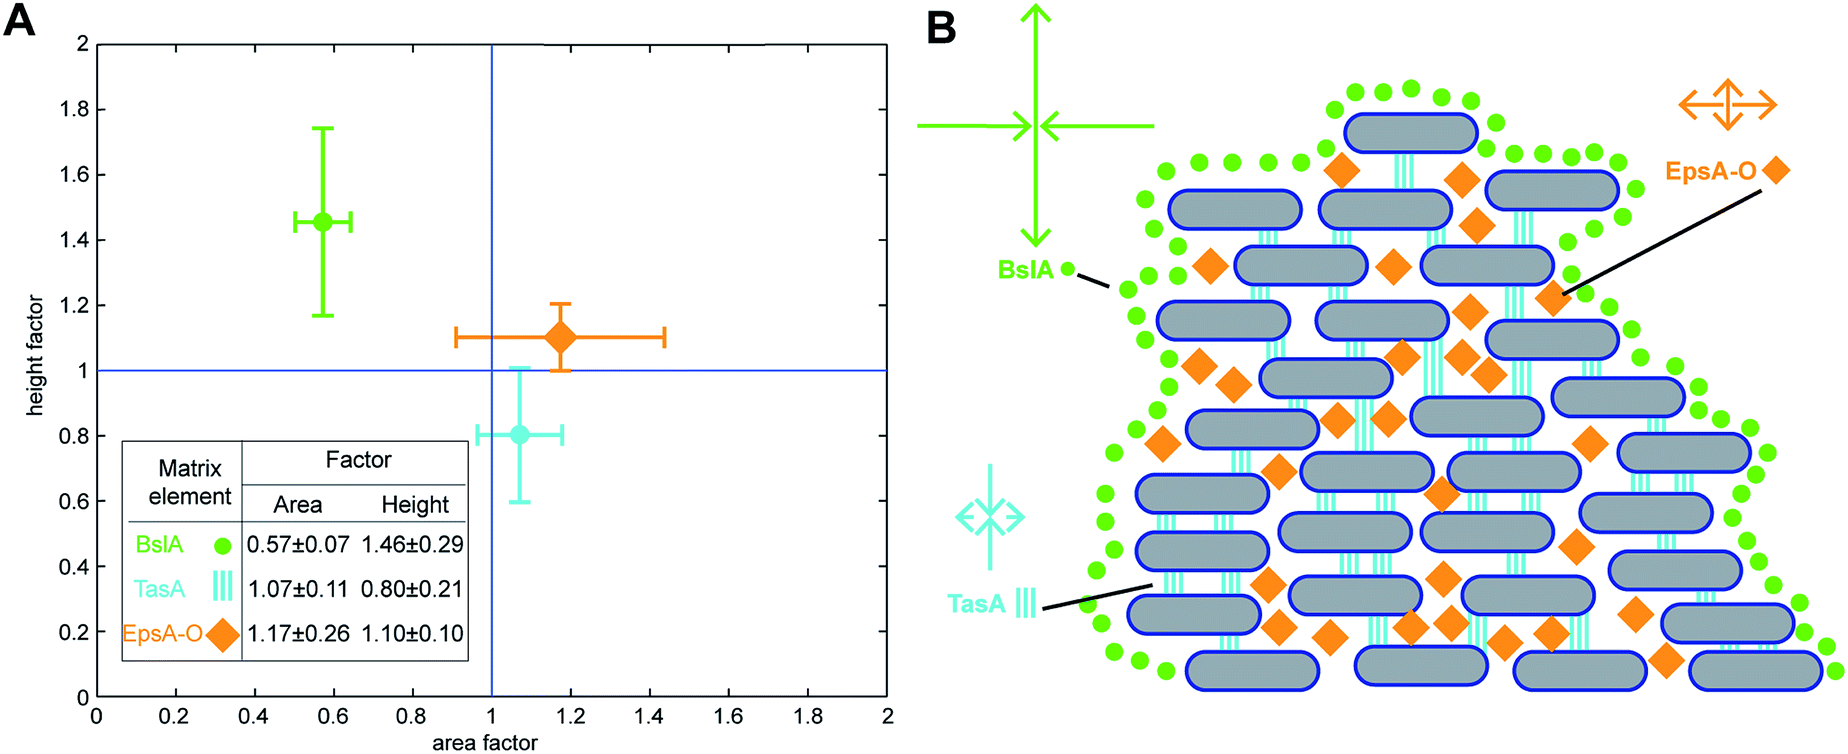 | ||
| Fig. 4 Contribution of biofilm matrix components to growth parameters. (A) Quantitative analysis as performed by mathematical modeling retrieving the influence of specific matrix elements of B. subtilis NCIB 3610 biofilm colonies for the final relative biofilm height and area covered by the biofilm (Table S3†). The error is given as the standard deviation. (B) Schematic of the proposed major influences of the specific matrix elements on biofilm colony structure. The BslA protein coats the entire B. subtilis biofilm,12 thereby restricting both lateral and vertical biofilm colony growth. The TasA protein primarily reduces biofilm height, possibly by vertically interconnecting the individual bacteria within the biofilm colony via amyloid fibers.50,58 The exopolysaccharide slightly increases the area covered by the biofilm colony, possibly by serving as a gliding material55 or simply by increasing biomass. | ||
Furthermore, our data indicate that one role of the BslA protein could be to counteract the influence of TasA. To test this hypothesis, we constructed a bslA/tasA double deletion mutant (Table 1, Methods). For such a bslA/tasA deletion mutant, our model predicts a carrying capacity for area coverage of 17.72 mm2, and for biofilm height of 134.60 μm (Table S2†). Whereas this prediction agrees well with the experimentally determined biofilm height of 131.88 μm (Fig. 3), fitting the experimentally obtained data for area growth returns a value of 13.85 mm2, which differs from the model prediction by 20%. As our model does not include any coupling effects between these two biofilm matrix components (BslA and TasA), this result may indicate that a coupling between BslA and TasA might be relevant for modelling the lateral expansion of the biofilm colony in detail. However, with regard to the biofilm height, BslA seems to counteract the action of TasA. Whereas we obtained a decreased and increased biofilm height for the bslA and tasA mutant, respectively; the final biofilm height of the bslA/tasA double deletion mutant is comparable to that of the wild-type strain.
When the same model was applied to the surface roughness data (Table S3†), we found that BslA is the main player affecting the surface roughness of NCIB 3610 biofilm colonies. This agrees with previous results where it was shown that the surface layer protein BslA is mainly responsible for the surface properties of mature NCIB 3610 biofilms.36
Discussion
In this study, we present a quantitative, time-resolved analysis of two biofilm growth parameters to describe the dimensions of mature Bacillus subtilis biofilm colonies: the area covered by the biofilm and biofilm height. We find that the macrocolony growth of B. subtilis biofilm formers can be quantitatively distinguished from that of strains impaired in biofilm formation by determining the position of the corresponding inflection points in the time-resolved biofilm area growth data. This quantitative approach could serve as a quality control measure to validate the accurate formation of B. subtilis biofilm colonies, but might also be transferable to the process of biofilm formation of other bacterial species.53,54In the past years, mathematical efforts have been made to address B. subtilis biofilm formation theoretically. Focusing on B. subtilis biofilm formation on solid substrates as in the case of this study, many of these mathematical and experimental investigations27,28,32,33 analyzed how nutrient availability affects biofilm growth27,28,32 or how bacterial division generates pressure that leads to the spreading of biomass in B. subtilis biofilms.33 Other mathematical models describe B. subtilis biofilm formation at the air–liquid interface.29,30 For example, Angelini et al. 2009 (ref. 29) demonstrate how the spreading of B. subtilis biofilms at the air–liquid interface is dependent on surfactant production. Ardre et al. 2015 (ref. 30) present an individual-based model of B. subtilis biofilm formation at the air–liquid interface that accounts for two different bacterial phenotypes: motile cells and matrix-producing cells. However, only few studies investigated how specific matrix components quantitatively affect biofilm growth and final dimensions in a B. subtilis biofilm, and the existing studies focus on the influence of one particular matrix component only, i.e., the exopolysaccharide.28,32 For B. subtilis strain NCIB 3610 biofilms, for which the main components of the biofilm matrix are known (the proteins BslA, TasA and an exopolysaccharide), we here provide a detailed experimental and mathematical analysis of how these three different biofilm matrix components determine the final dimensions of mature biofilm colonies grown on solid LB agar surfaces. Our experimental findings, in combination with the quantitative results of our mathematical analysis suggest the following model (Fig. 4B): the lateral expansion during NCIB 3610 biofilm colony growth is restricted by the surface layer protein BslA encapsulating the biofilm,51 and the area covered by the biofilm is slightly increased in the presence of the exopolysaccharide. In the case of the exopolysaccharide, it might simply increase the biomass and thus the total covered area of the biofilm, or it may serve as a gliding material55 leading to an increased distance between the individual cells on the agar surface after cell division. Exopolysaccharides have also been described to facilitate the colonization of surfaces and the long-term attachment of biofilms,56 and both effects may contribute to an increased lateral expansion of a biofilm. A further important factor that might influence the lateral biofilm expansion is bacterial motility, although this is inhibited during B. subtilis NCIB 3610 biofilm formation. Regulation by SinI/SinR leads to the repression of the fla/che operon transcript abundance inhibiting de novo flagellar gene expression.57 However, as flagella are numerous and stable, preventing the production of the fla/che operon transcript is insufficient to inhibit motility. Here, a second mechanism comes into play: the short term inhibition of flagellar rotation by EpsE, which is produced by the epsA-O operon.57 In the case of the epsA-O mutant, the whole epsA-O operon has been deleted; therefore, this strain is not able to produce EpsE and lacks the short term inhibition of flagellar rotation. In theory, if motile cells are present in biofilms formed by the epsA-O mutant, this should lead to an enhanced lateral expansion as compared to the wild-type strain. However, we observed that the lateral expansion is delayed in this mutant strain, (Fig. 3) and its biofilm colony final area is constant for a broad range of agar concentrations and does not exceed area coverage values obtained for the NCIB 3610 wild type strain (Fig. S1†). Hence, we concluded, that motility does not play a major role in our investigations.
The height of mature NCIB 3610 biofilm colonies is primarily controlled by two matrix components: the surface layer protein BlsA and the amyloid fiber forming protein TasA. The TasA protein reduces the biofilm height possibly by vertically interconnecting the individual bacteria within the biofilm via amyloid fibers.50,58 The importance of interconnecting amyloid fibers has already been shown for biofilms formed by Staphyolococcus aureus,2 where PSM (phenol soluble modulins) amyloid fibers are involved in the formation of channels within the biofilm. BslA, the surface layer protein, shows the strongest contribution in controlling the height of mature NCIB 3610 biofilm colonies. By encasing the entire biofilm, BslA might stabilize the biofilm and allow for an increased final biofilm height, counteracting the action of the TasA protein.
In this study, we show that the production of specific matrix components of B. subtilis NCIB 3610 biofilms influence biofilm colony growth in different ways. In particular, our findings indicate that the two proteins BslA and TasA act in concert to tune wild-type biofilm height. An intricate interplay of multiple matrix components has already been shown for many biofilm forming bacteria with regard to biofilm structure.2 For instance, bacterial cells within biofilms formed by Escherichia coli are encased by curli fibers, while cellulose serves as an architectural element.21,22 In Vibrio cholerae biofilms, cell–cell adhesion is mediated by the protein RbmA and the proteins Bap1 and RbmC, whereas the Vibrio polysaccharide encases bacterial cell clusters.13 With regard to Pseudomonas aeruginosa, quantitative studies demonstrated that the Psl polysaccharide is required for bacterial attachment to surfaces and intercellular adhesion affecting biofilm structure.59,60 However, much more quantitative research is needed to unravel the function of each biofilm matrix component, and to relate a particular biofilm property to the biofilm matrix composition.
Acknowledgements
We thank R. Kolter for Bacillus subtilis strains NCIB 3610, CA017 and ZK3660. We thank K. Kobayashi for strain N24 and M. Morikawa for strain B. subtilis B-1. For technical assistance we thank A. Weiß and M. Heinlein. This study was supported by the Deutsche Forschungsgemeinschaft through project B11 in the framework of SFB863. Additional financial support by the Center for Nanoscience (CeNS) is gratefully acknowledged. CFG acknowledges a CONACYT fellowship granted by the Mexican government. B. v. B was supported by a DFG Fellowship through the Graduate School of Quantitative Biosciences Munich (QBM).References
- L. Hall-Stoodley, J. W. Costerton and P. Stoodley, Bacterial biofilms: from the natural environment to infectious diseases, Nat. Rev. Microbiol., 2004, 2(2), 95–108 CrossRef CAS PubMed.
- L. Hobley, C. Harkins, C. E. MacPhee and N. R. Stanley-Wall, Giving structure to the biofilm matrix: an overview of individual strategies and emerging common themes, FEMS Microbiol. Rev., 2015, 39(5), 649–669 CrossRef PubMed.
- H. C. Flemming and J. Wingender, The biofilm matrix, Nat. Rev. Microbiol., 2010, 8(9), 623–633 CAS.
- M. Marvasi, P. T. Visscher and L. Casillas Martinez, Exopolymeric substances (EPS) from Bacillus subtilis: polymers and genes encoding their synthesis, FEMS Microbiol. Lett., 2010, 313(1), 1–9 CrossRef CAS PubMed.
- I. Sutherland, Biofilm exopolysaccharides: a strong and sticky framework, Microbiology, 2001, 147(1), 3–9 CrossRef CAS PubMed.
- C. D. Nadell, K. Drescher, N. S. Wingreen and B. L. Bassler, Extracellular matrix structure governs invasion resistance in bacterial biofilms, ISME J., 2015, 9(8), 1700–1709 CrossRef PubMed.
- M. Morikawa, Beneficial biofilm formation by industrial bacteria Bacillus subtilis and related species, J. Biosci. Bioeng., 2006, 101(1), 1–8 CrossRef CAS PubMed.
- T. L. Wood, R. Guha, L. Tang, M. Geitner, M. Kumar and T. K. Wood, Living biofouling-resistant membranes as a model for the beneficial use of engineered biofilms, Proc. Natl. Acad. Sci. U. S. A., 2016, 113(20), E2802–E2811 CrossRef CAS PubMed.
- P. Gupta, S. Sarkar, B. Das, S. Bhattacharjee and P. Tribedi, Biofilm, pathogenesis and prevention–a journey to break the wall: a review, Arch. Microbiol., 2016, 198(1), 1–15 CrossRef CAS PubMed.
- H. Vlamakis, Y. Chai, P. Beauregard, R. Losick and R. Kolter, Sticking together: building a biofilm the Bacillus subtilis way, Nat. Rev. Microbiol., 2013, 11(3), 157–168 CrossRef CAS PubMed.
- J. van Gestel, H. Vlamakis and R. Kolter, Division of Labor in Biofilms: the Ecology of Cell Differentiation, Microbiol. Spectrum, 2015, 3(2) DOI:10.1128/microbiolspec.MB-0002-2014.
- L. S. Cairns, L. Hobley and N. R. Stanley-Wall, Biofilm formation by Bacillus subtilis: new insights into regulatory strategies and assembly mechanisms, Mol. Microbiol., 2014, 93(4), 587–598 CrossRef CAS PubMed.
- V. Berk, J. C. Fong, G. T. Dempsey, O. N. Develioglu, X. Zhuang and J. Liphardt, et al., Molecular architecture and assembly principles of Vibrio cholerae biofilms, Science, 2012, 337(6091), 236–239 CrossRef CAS PubMed.
- C. Hung, Y. Zhou, J. S. Pinkner, K. W. Dodson, J. R. Crowley and J. Heuser, et al., Escherichia coli biofilms have an organized and complex extracellular matrix structure, mBio, 2013, 4(5), e00645–13 CrossRef PubMed.
- Q. Wei and L. Z. Ma, Biofilm matrix and its regulation in Pseudomonas aeruginosa, Int. J. Mol. Sci., 2013, 14(10), 20983–21005 CrossRef PubMed.
- J. Valle, C. Latasa, C. Gil, A. Toledo-Arana, C. Solano and J. R. Penades, et al., Bap, a biofilm matrix protein of Staphylococcus aureus prevents cellular internalization through binding to GP96 host receptor, PLoS Pathog., 2012, 8(8), e1002843 CAS.
- A. Heydorn, A. T. Nielsen, M. Hentzer, C. Sternberg, M. Givskov and B. K. Ersboll, et al., Quantification of biofilm structures by the novel computer program COMSTAT, Microbiology, 2000, 146(10), 2395–2407 CrossRef CAS PubMed.
- A. P. Stapper, G. Narasimhan, D. E. Ohman, J. Barakat, M. Hentzer and S. Molin, et al., Alginate production affects Pseudomonas aeruginosa biofilm development and architecture, but is not essential for biofilm formation, J. Med. Microbiol., 2004, 53(7), 679–690 CrossRef CAS PubMed.
- H. Koo, J. Xiao, M. I. Klein and J. G. Jeon, Exopolysaccharides produced by Streptococcus mutans glucosyltransferases modulate the establishment of microcolonies within multispecies biofilms, J. Bacteriol., 2010, 192(12), 3024–3032 CrossRef CAS PubMed.
- J. Xiao, M. I. Klein, M. L. Falsetta, B. Lu, C. M. Delahunty and J. R. Yates 3rd, et al., The exopolysaccharide matrix modulates the interaction between 3D architecture and virulence of a mixed-species oral biofilm, PLoS Pathog., 2012, 8(4), e1002623 CAS.
- D. O. Serra, A. M. Richter and R. Hengge, Cellulose as an architectural element in spatially structured Escherichia coli biofilms, J. Bacteriol., 2013, 195(24), 5540–5554 CrossRef CAS PubMed.
- D. O. Serra, A. M. Richter, G. Klauck, F. Mika and R. Hengge, Microanatomy at cellular resolution and spatial order of physiological differentiation in a bacterial biofilm, mBio, 2013, 4(2), e00103–13, DOI:10.1128/mBio.00103-13.
- K. Drescher, J. Dunkel, C. D. Nadell, S. van Teeffelen, I. Grnja and N. S. Wingreen, et al., Architectural transitions in Vibrio cholerae biofilms at single-cell resolution, Proc. Natl. Acad. Sci. U. S. A., 2016, 113(14), E2066–E2072 CrossRef CAS PubMed.
- M. Simoes, L. C. Simoes and M. J. Vieira, A review of current and emergent biofilm control strategies, LWT--Food Sci. Technol., 2010, 43, 573–583 CrossRef CAS.
- H. C. Flemming, J. Wingender, U. Szewzyk, P. Steinberg, S. A. Rice and S. Kjelleberg, Biofilms: an emergent form of bacterial life, Nat. Rev. Microbiol., 2016, 14(9), 563–575 CrossRef CAS PubMed.
- R. Gallegos-Monterrosa, E. Mhatre and A. T. Kovacs, Specific Bacillus subtilis 168 variants form biofilms on nutrient-rich medium, Microbiology, 2016, 162(11), 1922–1932 CrossRef CAS PubMed.
- X. Wang, G. Wang and M. Hao, Modeling of the Bacillus subtilis Bacterial Biofilm Growing on an Agar Substrate, Comput. Math. Methods Med., 2015, 2015, 581829 Search PubMed.
- W. Zhang, A. Seminara, M. Suaris, M. P. Brenner, D. A. Weitz and T. E. Angelini, Nutrient depletion in Bacillus subtilis biofilms triggers matrix production, New J. Phys., 2014, 16, 015028 CrossRef.
- T. E. Angelini, M. Roper, R. Kolter, D. A. Weitz and M. P. Brenner, Bacillus subtilis spreads by surfing on waves of surfactant, Proc. Natl. Acad. Sci. U. S. A., 2009, 106(43), 18109–18113 CrossRef CAS PubMed.
- M. Ardre, H. Henry, C. Douarche and M. Plapp, An individual-based model for biofilm formation at liquid surfaces, Phys. Biol., 2015, 12(6), 066015 CrossRef PubMed.
- J. van Gestel, H. Vlamakis and R. Kolter, From cell differentiation to cell collectives: Bacillus subtilis uses division of labor to migrate, PLoS Biol., 2015, 13(4), e1002141 Search PubMed.
- X. Zhang, X. Wang, K. Nie, M. Li and Q. Sun, Simulation of Bacillus subtilis biofilm growth on agar plate by diffusion-reaction based continuum model, Phys. Biol., 2016, 13(4), 046002 CrossRef PubMed.
- J. Dervaux, J. C. Magniez and A. Libchaber, On growth and form of Bacillus subtilis biofilms, Interface Focus, 2014, 4(6), 20130051 CrossRef PubMed.
- G. Melaugh, J. Hutchison, K. N. Kragh, Y. Irie, A. Roberts and T. Bjarnsholt, et al., Shaping the Growth Behaviour of Biofilms Initiated from Bacterial Aggregates, PLoS One, 2016, 11(3), e0149683 Search PubMed.
- K. Kobayashi and M. Iwano, BslA(YuaB) forms a hydrophobic layer on the surface of Bacillus subtilis biofilms, Mol. Microbiol., 2012, 85(1), 51–66 CrossRef CAS PubMed.
- S. Kesel, S. Grumbein, I. Gumperlein, M. Tallawi, A. K. Marel and O. Lieleg, et al., Direct Comparison of Physical Properties of Bacillus subtilis NCIB 3610 and B-1 Biofilms, Appl. Environ. Microbiol., 2016, 82(8), 2424–2432 CrossRef CAS PubMed.
- M. Morikawa, S. Kagihiro, M. Haruki, K. Takano, S. Branda and R. Kolter, et al., Biofilm formation by a Bacillus subtilis strain that produces gamma-polyglutamate, Microbiology, 2006, 152(9), 2801–2807 CrossRef CAS PubMed.
- S. S. Branda, F. Chu, D. B. Kearns, R. Losick and R. Kolter, A major protein component of the Bacillus subtilis biofilm matrix, Mol. Microbiol., 2006, 59(4), 1229–1238 CrossRef CAS PubMed.
- H. Vlamakis, C. Aguilar, R. Losick and R. Kolter, Control of cell fate by the formation of an architecturally complex bacterial community, Genes Dev., 2008, 22(7), 945–953 CrossRef CAS PubMed.
- E. Hebisch, J. Knebel, J. Landsberg, E. Frey and M. Leisner, High variation of fluorescence protein maturation times in closely related Escherichia coli strains, PLoS One, 2013, 8(10), e75991 CAS.
- M. Martin, A. Dragos, T. Holscher, G. Maroti, B. Balint and M. Westermann, et al., De novo evolved interference competition promotes the spread of biofilm defectors, Nat. Commun., 2017, 8, 15127 CrossRef PubMed.
- M. H. Zwietering, I. Jongenburger, F. M. Rombouts and K. van 't Riet, Modeling of the bacterial growth curve, Appl. Environ. Microbiol., 1990, 56(6), 1875–1881 CAS.
- P.-F. Verhulst, Recherches mathematiques sur la loi d'accroissement de la population, Nouveaux Memoires de l'Academie Royale des Science et Belles-Lettres de Bruxelles, 1845, vol. 8, pp. 1–42 Search PubMed.
- M. A. Novak, Evolutionary Dynmaics: Exploring the Equations of Life, Belknap Press of Harvard University Press, Cambridge, MA, USA, 1st edn, 2006 Search PubMed.
- D. W. Marquardt, An Algorithm for Least-Squares Estimation of Nonlinear Parameters, J. Soc. Ind. Appl. Math., 1963, 11, 431–441 CrossRef.
- T. Strutz, Data Fitting and Uncertainty: A practical introduction to weighted least squares and beyond, Vieweg and Teubner, Wiesbaden, Germany, 1st edn, 2011 Search PubMed.
- A. Ostrowski, A. Mehert, A. Prescott, T. B. Kiley and N. R. Stanley-Wall, YuaB functions synergistically with the exopolysaccharide and TasA amyloid fibers to allow biofilm formation by Bacillus subtilis, J. Bacteriol., 2011, 193(18), 4821–4831 CrossRef CAS PubMed.
- S. S. Branda, J. E. Gonzalez-Pastor, S. Ben-Yehuda, R. Losick and R. Kolter, Fruiting body formation by Bacillus subtilis, Proc. Natl. Acad. Sci. U. S. A., 2001, 98(20), 11621–11626 CrossRef CAS PubMed.
- M. Albano, J. Hahn and D. Dubnau, Expression of competence genes in Bacillus subtilis, J. Bacteriol., 1987, 169(7), 3110–3117 CrossRef CAS PubMed.
- D. Romero, C. Aguilar, R. Losick and R. Kolter, Amyloid fibers provide structural integrity to Bacillus subtilis biofilms, Proc. Natl. Acad. Sci. U. S. A., 2010, 107(5), 2230–2234 CrossRef CAS PubMed.
- L. Hobley, A. Ostrowski, F. V. Rao, K. M. Bromley, M. Porter and A. R. Prescott, et al., BslA is a self-assembling bacterial hydrophobin that coats the Bacillus subtilis biofilm, Proc. Natl. Acad. Sci. U. S. A., 2013, 110(33), 13600–13605 CrossRef CAS PubMed.
- I. Dogsa, M. Brloznik, D. Stopar and I. Mandic-Mulec, Exopolymer diversity and the role of levan in Bacillus subtilis biofilms, PLoS One, 2013, 8(4), e62044 CAS.
- J. Bauer, W. Siala, P. M. Tulkens and F. Van Bambeke, A combined pharmacodynamic quantitative and qualitative model reveals the potent activity of daptomycin and delafloxacin against Staphylococcus aureus biofilms, Antimicrob. Agents Chemother., 2013, 57(6), 2726–2737 CrossRef CAS PubMed.
- D. Millo, An Electrochemical Strategy to Measure the Thickness of Electroactive Microbial Biofilms, ChemElectroChem, 2015, 2, 288–291 CrossRef CAS PubMed.
- B. Khayatan, J. Meeks and D. Risser, Evidence that a modified type iV pilus-like system powers gliding motility and polysaccharide secretion in filamentous cyanobateria, Mol. Microbiol., 2015, 98, 1021–1036 CrossRef CAS PubMed.
- U. U. Nwodo, E. Green and A. I. Okoh, Bacterial exopolysaccharides: functionality and prospects, Int. J. Mol. Sci., 2012, 13(11), 14002–14015 CrossRef CAS PubMed.
- S. B. Guttenplan and D. B. Kearns, Regulation of flagellar motility during biofilm formation, FEMS Microbiol. Rev., 2013, 37(6), 849–871 CrossRef CAS PubMed.
- I. Kolodkin-Gal, D. Romero, S. Cao, J. Clardy, R. Kolter and R. Losick, D-Amino acids trigger biofilm disassembly, Science, 2010, 328(5978), 627–629 CrossRef CAS PubMed.
- K. M. Colvin, Y. Irie, C. S. Tart, R. Urbano, J. C. Whitney and C. Ryder, et al., The Pel and Psl polysaccharides provide Pseudomonas aeruginosa structural redundancy within the biofilm matrix, Environ. Microbiol., 2012, 14(8), 1913–1928 CrossRef CAS PubMed.
- L. Ma, K. D. Jackson, R. M. Landry, M. R. Parsek and D. J. Wozniak, Analysis of Pseudomonas aeruginosa conditional psl variants reveals roles for the psl polysaccharide in adhesion and maintaining biofilm structure postattachment, J. Bacteriol., 2006, 188(23), 8213–8221 CrossRef CAS PubMed.
- A. L. McLoon, S. B. Guttenplan, D. B. Kearns, R. Kolter and R. Losick, Tracing the domestication of a biofilm-forming bacterium, J. Bacteriol., 2011, 193(8), 2027–2034 CrossRef CAS PubMed.
Footnotes |
| † Electronic supplementary information (ESI) available. See DOI: 10.1039/c7ra05559e |
| ‡ Contributed equally. |
| This journal is © The Royal Society of Chemistry 2017 |