
 Open Access Article
 This Open Access Article is licensed under a
 Creative Commons Attribution 3.0 Unported Licence
Photoluminescence and electroluminescence of deep red iridium(III) complexes with 2,3-diphenylquinoxaline derivatives and 1,3,4-oxadiazole derivatives ligands†
Yi-Ming Jinga and
You-Xuan Zheng *ab
*ab
aState Key Laboratory of Coordination Chemistry, RD Center of Shen Zhen High-Tech Research Institute of Nanjing University, Collaborative Innovation Center of Advanced Microstructures, School of Chemistry and Chemical Engineering, Nanjing University, Nanjing 210093, P. R. China. E-mail: yxzheng@nju.edu.cn
bMaAnShan High-Tech Research Institute of Nanjing University, MaAnShan, 238200, P. R. China
First published on 26th July 2017
Abstract
Four iridium(III) complexes (Ir1 to Ir4) containing 2,3-diphenylquinoxaline derivatives with or without fluoro-substituted on different positions (L1: 2,3-diphenylquinoxaline; L2: 6,7-difluoro-2,3-diphenylquinoxaline; L3: 2,3-bis(4-fluorophenyl)quinoxaline; L4: 6,7-difluoro-2,3-bis(4-fluorophenyl)quinoxaline) as main ligands and 2-(5-phenyl-1,3,4-oxadiazol-2-yl)phenol (HPOP) as ancillary ligand were synthesized and investigated. All the complexes emit deep red photoluminescence (PL) (Ir1: λmax: 645 nm; Ir2: λmax: 650 nm; Ir3: λmax: 634 nm; Ir4: λmax: 639 nm). Moreover, the electron mobility of the complexes Ir3 and Ir4 is higher than that of the electron transport material Alq3 (tris-(8-hydroxyquinoline)aluminium), which is beneficial for their performances in organic light-emitting diodes (OLEDs). The OLEDs with single- or double-emitting layers (EML) were fabricated using Ir3 or Ir4 as the emitter. The double-EML device using Ir4 with the structure of ITO (indium-tin-oxide)/MoO3 (molybdenum oxide, 5 nm)/TAPC (di-[4-(N,N-ditolyl-amino)-phenyl]cyclohexane, 30 nm)/TcTa (4,4′,4′′-tris(carbazol-9-yl) triphenylamine): Ir4 (2 wt%, 10 nm)/26DCzPPy (2,6-bis(3-(carbazol-9-yl)phenyl)pyridine): Ir4 (2 wt%, 10 nm)/TmPyPB (1,3,5-tri(m-pyrid-3-yl-phenyl)benzene, 40 nm)/LiF (1 nm)/Al (100 nm) displays good electroluminescence (EL) performances with maximum luminance, current efficiency, power efficiency and external quantum efficiency of up to 20![[thin space (1/6-em)]](https://www.rsc.org/images/entities/char_2009.gif) 676 cd m−2, 14.0 cd A−1, 12.0 lm W−1 and 17.8%, respectively, and the efficiency roll-off ratio is mild. The results suggest that the number and position of fluoro-substituents can affect photophysical, electrochemical and electroluminescent properties of the Ir(III) complexes, which are potential deep red phosphorescent materials for specific OLED applications.
676 cd m−2, 14.0 cd A−1, 12.0 lm W−1 and 17.8%, respectively, and the efficiency roll-off ratio is mild. The results suggest that the number and position of fluoro-substituents can affect photophysical, electrochemical and electroluminescent properties of the Ir(III) complexes, which are potential deep red phosphorescent materials for specific OLED applications.
Introduction
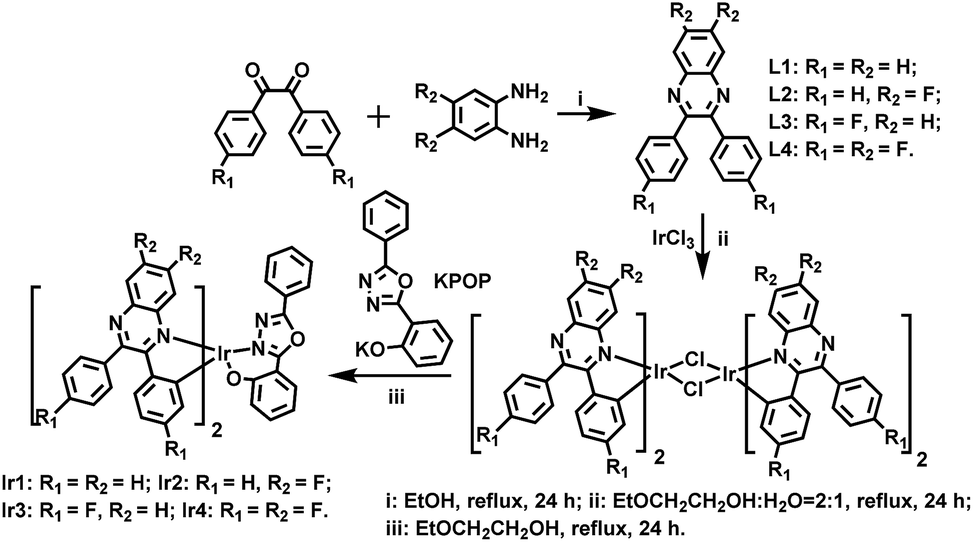
Iridium(III) complexes are widely investigated and utilized in organic light-emitting diodes (OLEDs) due to their encouraging advantages such as thermal stability, flexible color tunability and high quantum efficiencies.1 The energy from both singlet and triplet states can be harvested because of the strong spin–orbit coupling caused by the heavy metal atom, leading to high phosphorescence quantum yields and theoretical internal quantum efficiency of OLEDs up to 100%.2 For high quality red–green–blue (RGB) displays and high color purity white OLEDs (WOLEDs), red and deep red iridium(III) dopants are one of the most essential chromaticity components.3 Additionally, deep red emitters are largely used in specific fields, such as optical signal processing, luminescent sensing, bioimaging and photodynamic therapy.4 However, compared with the well-developed green, yellow and orange phosphors, the development of efficient deep red phosphors and OLEDs remains a challenging issue. The quantum yields of red emitters tend to be reduced for the reason that the low-lying excited state energy can be easily quenched.5 On the other hand, it is known that the hole mobility of most hole transport materials is roughly 2–3 orders of magnitude higher than the electron mobility of electron transport materials, thus, highly efficiency OLEDs suffer from serious efficiency roll-off which is attributed to the deterioration of charge carrier balance. In all, it is imperative to design and synthesize deep red Ir(III) complexes with good electron mobility to fulfill deep red OLEDs with low efficiency roll-off.Ir(III) complexes with 2,3-diphenylquinoxaline (DPQ) derivatives as main ligands were reported to emit saturated red or deep red phosphorescence, but their electroluminescent performances were unsatisfactory.6 In this work, we synthesized four deep red Ir(III) complexes using DPQ derivatives as main ligands with or without fluorine (F) substituted on different positions of phenyl or quinoxaline rings. The lower vibrational frequency of C–F bonds can reduce the rate of nonradioactive deactivation, which will enhance the photoluminescence quantum yields (PLQYs).7 1,3,4-Oxadiazole derivatives with good electron affinity are introduced as the ancillary ligands, which will improve the electron transport ability of Ir(III) complexes, resulting in better balance of charge transport, contributing to high device efficiency and low efficiency roll-off.8 The molecular structures of ligands and complexes are shown in Scheme 1.
 | ||
| Scheme 1 Synthetic routes of ligands and complexes. | ||
Results and discussion
Preparation and X-ray crystallography
Scheme 1 shows the synthetic routes of the ligands and Ir(III) complexes. The cyclometallated ligand L1 was purchased, while the ligands L2, L3 and L4 were synthesized via a condensation reaction from benzil and 1,2-diaminobenzene. The ancillary ligand 2-(5-phenyl-1,3,4-oxadiazol-2-yl)phenol (HPOP) and potassium salt (KPOP) were prepared according to our previous publications.8 The complexes were obtained in two steps with popular methods via Ir(III) chloro-bridged dimer.6 Purification of the mixture by silica gel chromatography provided crude products (Ir1–Ir4), which were further purified by vacuum sublimation. All the new compounds were fully characterized by 1H NMR, 13C NMR, 19F NMR, the electrospray ionization mass spectra (ESI-MS), the high resolution electrospray ionization mass spectra (HR ESI-MS) and elemental analyses. The crystal structures of Ir1 and Ir3 further confirmed the identity of the complexes.Fig. 1 shows the Oak Ridge Thermal Ellipsoidal Plot (ORTEP) diagrams of Ir1 and Ir3 single crystals, the corresponding crystallographic data are summarized in Table S1 (ESI†), and the selected bond lengths and angles are listed in Table S2 (ESI†). The iridium centre adopts a distorted octahedral coordination geometry with two C^N cyclometalated ligands and one monoanionic bidentate N^O ancillary ligand. Apparently, the phenyl rings of the main ligands which do not chelate with the iridium atom are not coplanar with the cyclometalated ligands in order to reduce the steric hindrance. Concerning the POP ancillary ligand with three rings, the phenol ring and the oxadiazole ring chelate with the iridium centre via the O atom and an N atom, respectively, forming a relatively rigid hexatomic coordination ring. The Ir–C and Ir–N bonds between the Ir centre and the C^N main ligands are around 2.0 Å, while the Ir–N and Ir–O bonds between the Ir atom and the ancillary ligand are in the range of 2.14–2.18 Å. Moreover, the C–C and C–N bond lengths and angles are in agreement with the corresponding parameters described in other similarly constituted Ir(III) complexes.6,8
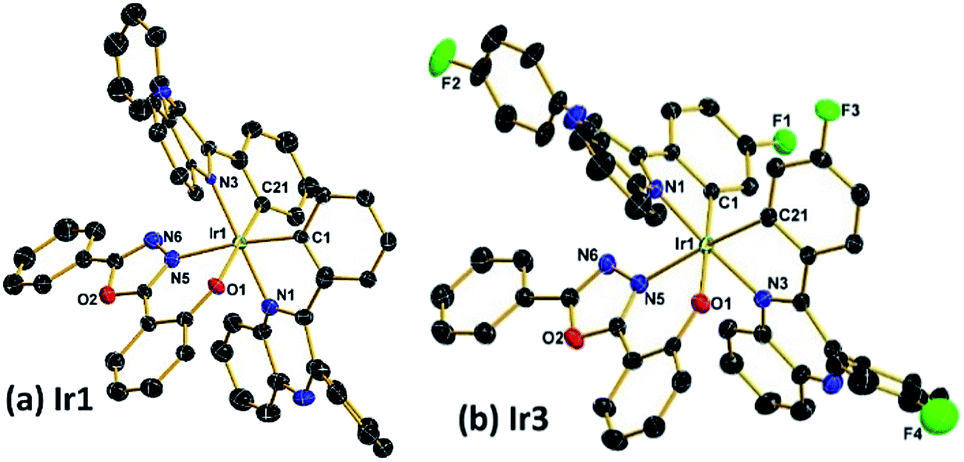 | ||
| Fig. 1 Oak Ridge Thermal Ellipsoidal Plot (ORTEP) diagrams of the complexes (a) Ir1 (CCDC no. 1535471); (b) Ir3 (CCDC no. 1535473†). Hydrogen atoms are omitted for clarity. Ellipsoids are drawn at 30% probability level. | ||
Thermal stability
The thermal stability of emitters is very important for high quality OLEDs. Complexes that are suitable for OLED application should have high enough melting points and decomposition temperatures to be deposited onto the solid face and survive long periods of application without any decomposition. The thermal properties of the complexes were characterized by different scanning calorimetry (DSC) and thermogravimetric (TG) measurements under a nitrogen steam. The DSC curves in Fig. 2(a) give the melting points (Tm) of Ir1, Ir2, Ir3 and Ir4 are as high as 386 °C, 370 °C, 389 °C and 370 °C, respectively. From the TG curves in Fig. 2(b), it can be seen that the decomposition temperature (Td, 5% loss of weight) is 411 °C for Ir1, 402 °C for Ir2, 401 °C for Ir3 and 397 °C for Ir4, respectively. Consequently, all complexes can be vacuum evaporated without decomposition, indicating that all the complexes are potential emitting materials for the fabrication of stable OLEDs.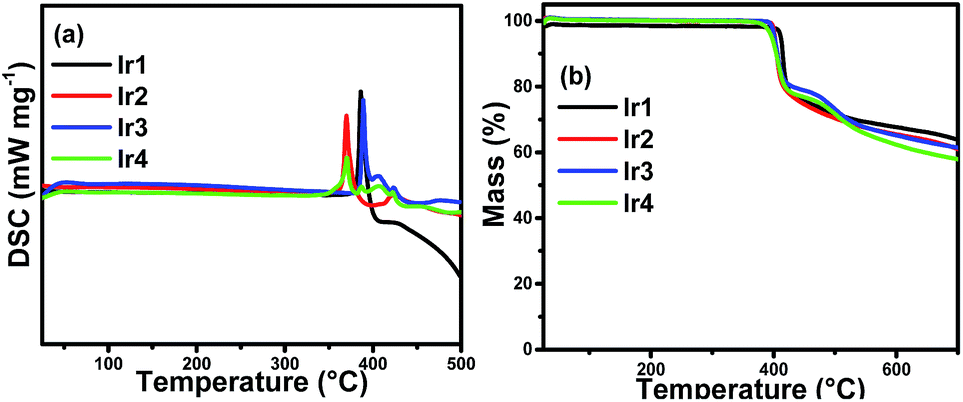 | ||
| Fig. 2 DSC (a) and TG (b) thermograms of the complexes. | ||
Photophysical property
The UV-vis molar absorptivity spectra of the complexes in degassed CH2Cl2 at 5 × 10⁻⁵ mol L−1 are shown in Fig. 3(a) and the photophysical data are listed in Table 1. The intense bands in the range of 250–350 nm are assigned to the spin-allowed ligand-centered 1LC (π–π*) transition of the cyclometalated and ancillary ligands. The relatively weak absorption bands at lower energies extending into the spectral region (350–550 nm) are ascribed to the mixing of the spin-allowed singlet metal-to-ligand charge-transfer (1MLCT), triplet metal-to-ligand charge-transfer (3MLCT) states or LLCT (ligand-to-ligand charge-transfer) transition through strong spin–orbit coupling of iridium atoms.9 From Fig. 3(a) and Table 1 it can be observed that there is no obvious distinction among the absorption spectra of the complexes Ir2 to Ir4, which are red-shifted slightly compared with that of Ir1, suggesting that fluorination on the main ligands has mild effect on the absorption spectra of the iridium complexes.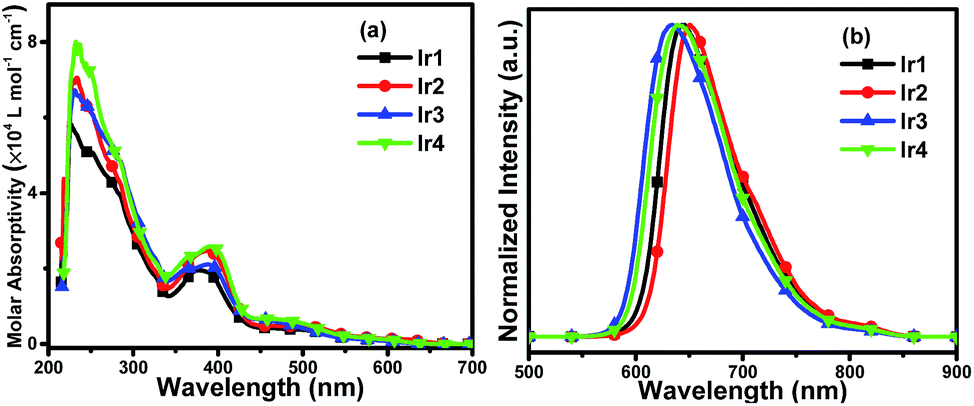 | ||
| Fig. 3 (a) UV-vis molar absorptivity and (b) normalized emission spectra of Ir1, Ir2, Ir3 and Ir4 in degassed CH2Cl2 solutions (5 × 10⁻⁵ mol L−1) at room temperature. | ||
| Complex | Ts/Tm/Tda (°C) | λabsb (nm) [εc (104 L mol−1 cm−1)] | λemd (nm) | Φe (%) | τf (μs) | HOMO/LUMOg (eV) | krh (105 s−1) | knrh (105 s−1) |
|---|---|---|---|---|---|---|---|---|
| a Ts: sublimation temperature at 2.0 × 10⁻⁴ Pa, Tm: melting temperature, Td: decomposition temperature.b Measured in degassed CH2Cl2 solution at a concentration of 5 × 10⁻⁵ mol L−1 at room temperature.c Molar absorptivity.d Measured in degassed CH2Cl2 solution at a concentration of 5 × 10⁻⁵ mol L−1 at 298 K.e Measured in degassed CH2Cl2 solution at room temperature using [Ru(bpy)3]Cl2 as the standard sample (Φ = 0.028).f Measured in degassed CH2Cl2 solution at a concentration of 5 × 10⁻⁵ mol L−1 at room temperature.g From the onset of oxidation potentials of the cyclovoltammetry (CV) diagram using ferrocene as the internal standard in deaerated CH2Cl2 and the optical energy gap from the absorption spectra.h Radiative (kr) and non-radiative (knr) constants are calculated according to the equations: kr = Φ/τ and knr = 1/τ − kr. | ||||||||
| Ir1 | 365/386/411 | 227 (5.81)/378 (1.96) | 645 | 24.8 | 1.86 | −5.26/−3.46 | 1.33 | 4.04 |
| Ir2 | 350/370/402 | 233 (7.06)/387 (2.47) | 650 | 18.3 | 1.85 | −5.36/−3.60 | 0.99 | 4.41 |
| Ir3 | 350/389/401 | 231 (6.72)/388 (2.11) | 634 | 31.2 | 1.83 | −5.33/−3.44 | 1.70 | 3.76 |
| Ir4 | 340/370/397 | 232 (8.01)/391 (2.59) | 639 | 40.6 | 1.98 | −5.45/−3.57 | 2.05 | 3.00 |
Photoluminescence (PL) spectra of the complexes in degassed CH2Cl2 solutions at room temperature are depicted in Fig. 3(b), and the relevant data are summarized in Table 1. The excitation wavelength for the PL spectra of Ir1–Ir4 is 378 nm, 387 nm, 388 nm and 391 nm, respectively. The complexes emitted deep red phosphorescence ranging from 634 nm to 650 nm. It is obvious that the PL spectra of Ir3 and Ir4 exhibit a hypsochromic shift compared with Ir1, which suggests the fluorine substituted on the phenyl rings of the main ligands (DPQ) can affect the emission spectra significantly. Meanwhile, the PL spectrum of Ir2 is red-shifted mildly indicating that fluoro-substituents on the quinoxaline moiety have slight influence on the emission spectra of the Ir(III) complexes, which can be also detected from the comparison between the PL spectra of Ir3 and Ir4.
Additionally, the PL quantum yields (PLQYs) of Ir1 to Ir4 are 24.8%, 18.3%, 31.2% and 40.6%, respectively. The complex Ir4 with fluorination on both the phenyl and quinoxaline rings of the main ligands achieves the highest PLQY, and the PLQY of the complex Ir3 which has fluoro-substituted on the phenyl rings is higher than that of Ir1 with none fluoro-substituents. The results demonstrate that fluorination can enhance the PLQYs of iridium(III) complexes, for the reason that the C–F bond can reduce the rate of nonradioactive deactivation. Thus, the complex Ir4 with fluorine substituted on both phenyl and quinoxaline rings of the main ligand shows the highest PLQY among these complexes. In contrast, the complex Ir2 has lower PLQY than Ir1. In general, the position and number of fluoro-substituents can affect not only the PL spectra of the Ir(III) complexes but also the PLQYs. Furthermore, the phosphorescence lifetime (τ) is an important factor that affects the rate of triplet–triplet annihilation (TTA) in OLEDs. Longer τ values usually cause greater TTA effect.10 The phosphorescence lifetimes of the four complexes are in the range of microseconds (1.83–1.98 μs) at room temperature and are indicative of the phosphorescence origins from triplet metal-to-ligand charge-transfer (3MLCT) and/or triplet ligand-to-ligand charge-transfer (3LLCT) states. To better understand the emission properties of the four complexes, the radiative (kr) and non-radiative (knr) constants are calculated and summarized in Table 1. The complex Ir4 with the highest PLQY has the highest kr value (2.05 × 10⁵ s−1), the kr value of the complex Ir2 with the deepest red emission and the lowest PLQY is as low as 9.89 × 10⁴ s−1. The knr values increase as the maximum peak shifts to the deep red region, the deep red emitter Ir2 has the highest knr as 4.41 × 10⁵ s−1. The low PLQY of the complex Ir2 is partly ascribed to the decrease of radiative transition and the increase of nonradioactive transition.
Electrochemical properties and theoretical calculations
The redox properties, highest occupied molecular orbital (HOMO) and lowest unoccupied molecular orbital (LUMO) energy levels of the dopants are relative to the charge transport ability and the OLED structure. To study these properties and calculate the HOMO/LUMO levels of the complexes, the electrochemical properties of Ir1–Ir4 were measured by cyclic voltammetry in deaerated dichloromethane using ferrocene as the internal standard (Fig. 4(a)). The HOMO levels were calculated from the oxidation peak potential (Eox) and the energy gap (Eg) was calculated from the UV-vis absorption edges.11 Then the LUMO levels were determined according to the equation LUMO = HOMO + Eg. The electrochemical data are collected in Table S3 (ESI†). The cyclic voltammograms of the complexes in the positive range show obvious oxidation peaks, while the reduction peaks are negligible, demonstrating that the redox process of the complexes is not completely reversible, which is also observed in similar Ir(III) complexes containing 1,3,4-oxadiazole units.8 In the negative scan range, the complexes exhibit quasi-reversible redox process, which mainly occurs on the stronger electron-accepting heterocyclic portion of the cyclometalated ligands. Notably, the complexes Ir2, Ir3 and Ir4 show higher oxidation potentials than that of Ir1, which is ascribed to the electronegative effect of the fluorine making the complexes more difficult to lose electron, leading to lower HOMO levels. On the other hand, the reduction potential is decreased by the introduction of F atoms, resulting in a lower LUMO level, which is conducive to the injection and capture of electrons in the OLEDs. The F atoms in the main ligands decrease the HOMO/LUMO levels of the complexes leading to different Eg of the complexes which contributes to the variations in the PL spectra. The complex Ir3 with the largest Eg (1.89 eV) among all the complexes emits phosphorescence with the maximum peak at 634 nm. Whereas, the complex Ir2 has the smallest Eg (1.76 eV), which exhibits the deepest red emission peaking at 650 nm. These phenomena suggest that fluorination on the quinoxaline ring of the main ligands will reduce the energy gap of the Ir(III) complexes resulting in a bathochromic shift of the emission spectra.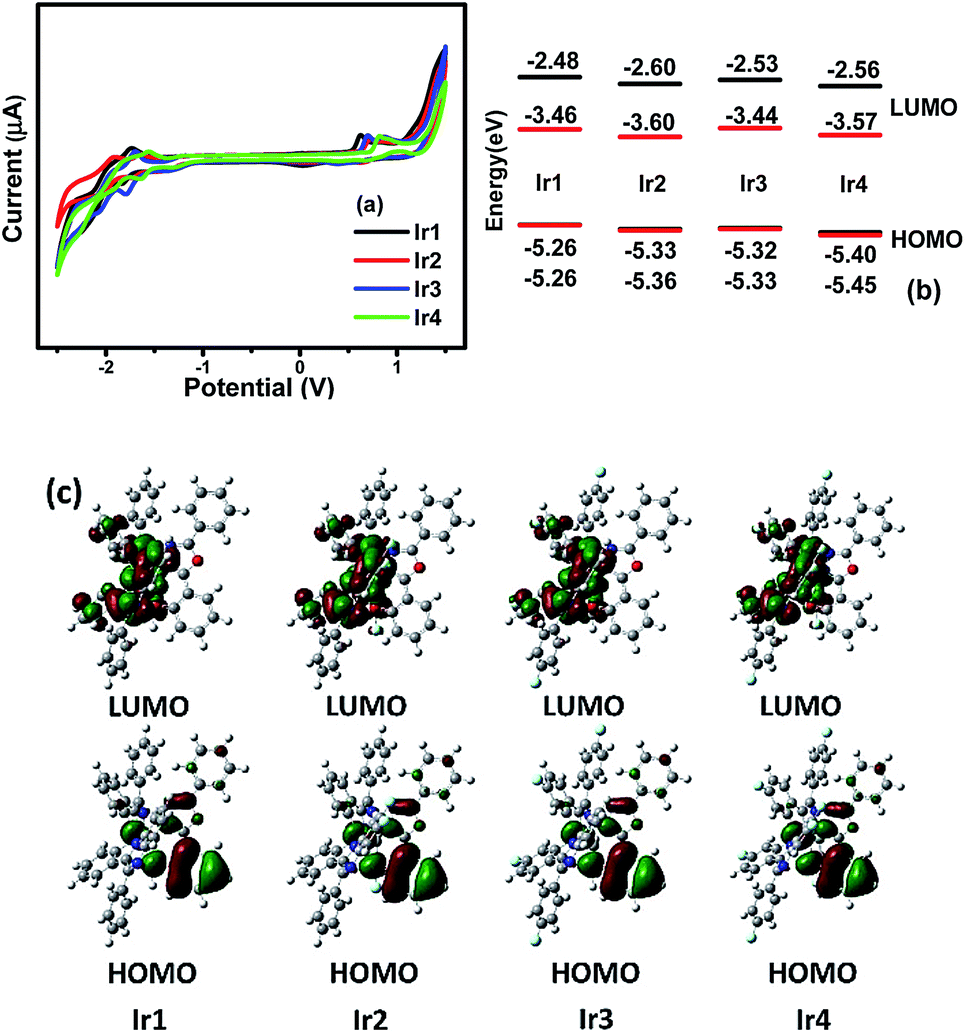 | ||
| Fig. 4 (a) Cyclic voltammogram curves, (b) theoretical (black) and experimental (red) energy levels and (c) contour plots of HOMO/LUMO of Ir1 to Ir4. | ||
To provide further study on the electronic structures of the complexes, theoretical calculations were performed on optimized geometries in CH2Cl2. The calculations on the ground electronic states of the complexes were carried out using density functional theory (DFT) and time-dependent DFT (TD-DFT) at the B3LYP level.12 The basis set used for C, H, N, O and F atoms was 6-31G(d,p) while the LanL2DZ basis set was used for Ir atoms.13 The solvent effect of CH2Cl2 was taken into consideration using conductor-like polarizable continuum model (C-PCM).14 All these calculations were performed with Gaussian 09.15 The QMForge program was used to give accurate percentage data of the frontier molecular orbitals (FMOs).16 Contour plots of FMOs are shown in Fig. 4(c). The energies and percentage composition of ligands and metal orbitals are listed in Table S4 (ESI†). The results are helpful for the assignment of the electron transition characteristics and the discussion on the photophysical variations. For these complexes, the LUMOs are mainly localized on the main ligands (94.55–94.80%) with minor contributions from Ir d orbitals (3.47–3.69%) and the ancillary ligand (1.69–1.81%). Interestingly, the locations of the HOMOs on the POP ligands are over 75% for the four complexes (75.27–77.79%), while the compositions on the d orbitals of Ir atoms and the main ligands are in the range of 14.17–15.86% and 8.04–8.87%, respectively. The rising compositions of HOMOs on the ancillary ligands make the electrochemical oxidation processes occur on both metal centered orbitals and ancillary ligands, leading to the irreversible redox processes of the Ir(III) complexes. Compared with the complex Ir1, the orbital distributions of LUMOs for Ir2, Ir3 and Ir4 have more contributions from the main ligands and less from Ir d orbitals. The calculation results indicate that the fluorination affects the orbital distributions and the HOMO/LUMO levels of the Ir(III) complexes.
Electron mobility
As the hole mobility is roughly 2–3 orders of magnitude higher than the electron mobility in OLEDs,17 their excitation lifetime relies on the electron transport capability. The good electron mobility of the phosphorescent emitters would facilitate the injection and transport of electrons, which will broaden the recombination zone, balance the distribution of hole–electron and reduce leakage current, leading to suppressed TTA and triplet–polaron annihilation (TPA) effects, improved recombination probability, high device efficiency, and low efficiency roll-off.18 As discussed before, introducing 1,3,4-oxadiazole derivatives with good electron affinity may improve the electron mobility of the complexes, which would suppress the TPA effects effectively and obtain phosphorescent OLEDs with low efficiency roll-off.To measure the electron mobility of the complexes, we conducted the transient electroluminescence (TEL) measurement based on the device of ITO (indium tin oxide)/TAPC (di-[4-(N,N-ditolyl-amino)-phenyl]cyclohexane, 50 nm)/Ir3 or Ir4 (60 nm)/LiF (1 nm)/Al (100 nm).19 The TAPC is the hole-transport layer, whereas the Ir(III) complexes perform as both the emissive and electron-transport layers. To check the accuracy of our measurements, we also measured the electron mobility of Alq3 (tris-(8-hydroxyquinoline)aluminum), which is the typically well-known electron transport material, whose electron mobility has been reported in many references.20 The experimental results (Fig. 5) show that the electron mobility in 60 nm Ir3 and Ir4 layers are between 5.49–5.81 × 10⁻⁶ cm2 V−1 s−1 and 6.67–6.90 × 10⁻⁶ cm2 V−1 s−1, respectively, under an electric field from 1150 (V cm−1)1/2 to 1300 (V cm−1)1/2, while that of Alq3 is between 4.74–4.86 × 10⁻⁶ cm2 V−1 s−1. From Fig. 5(c) it can also be observed that Ir3 and Ir4 complexes have higher electron mobility than that of Alq3. The good electron transport ability of Ir3 and Ir4 will facilitate the injection and transport of electrons, which broadens the recombination zone and balances the distribution of holes and electrons, particularly for high doping concentrations. Therefore, efficient OLEDs with suppressed efficiency roll-off are expected.
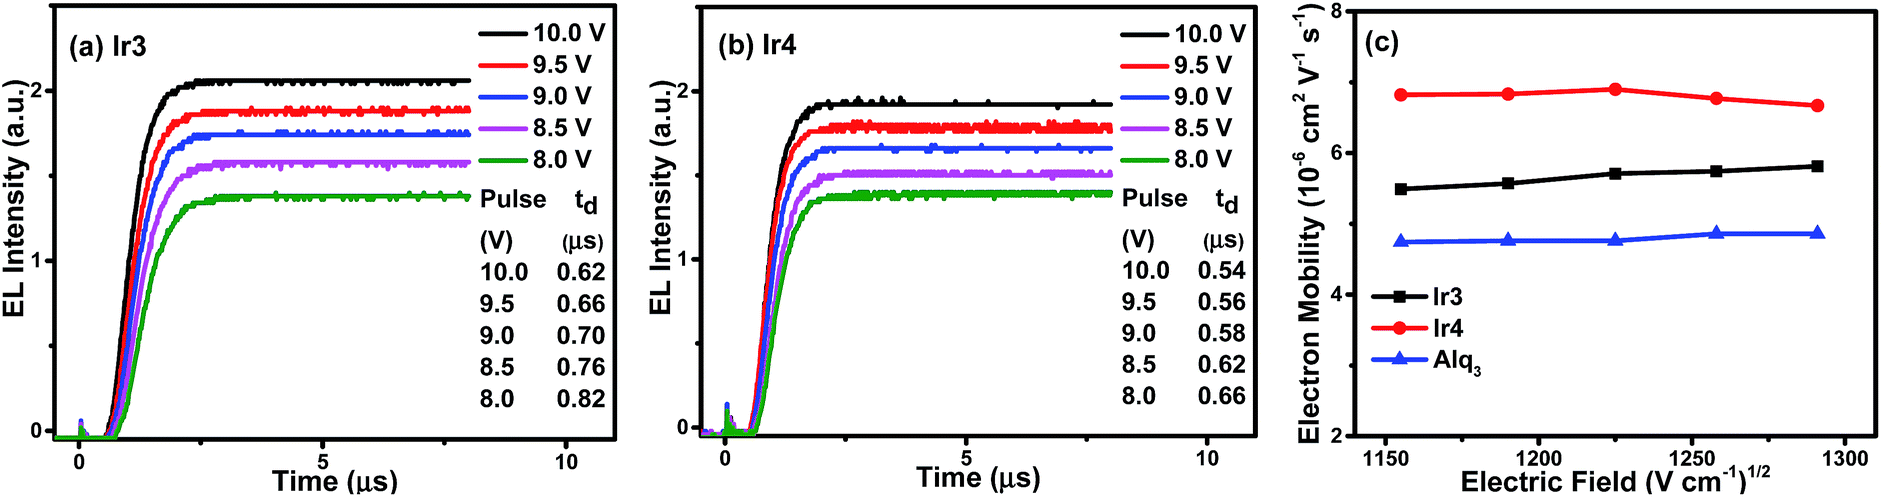 | ||
| Fig. 5 The transient EL signals for the device structure of ITO/TAPC (50 nm)/Ir3 (a) or Ir4 (b) (60 nm)/LiF (1 nm)/Al (100 nm) under different applied fields, and (c) the electric field dependence of charge electron mobility in the thin films of Ir3, Ir4 and Alq3. | ||
OLED performance
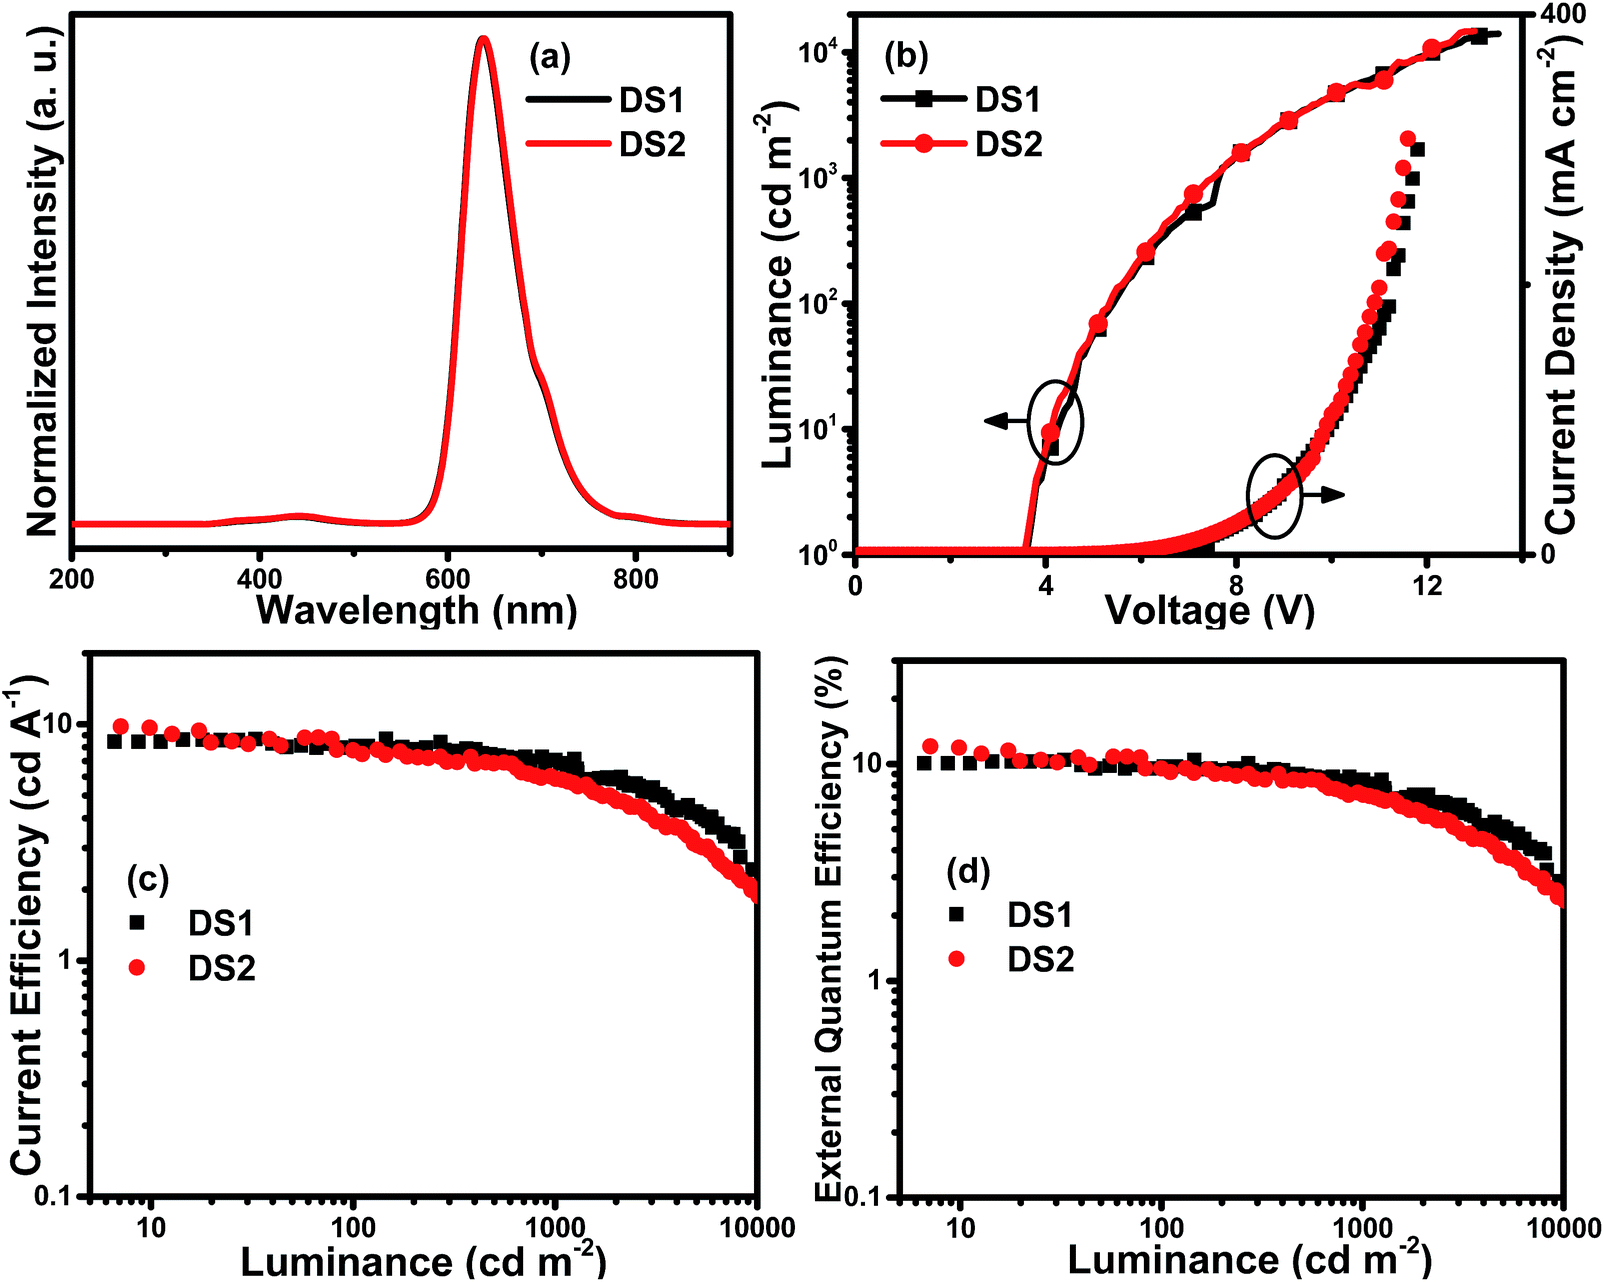
To evaluate the electroluminescent performances of these complexes, the complexes Ir3 and Ir4 with higher PLQYs (31.2% and 40.6%, respectively) were selected to fabricate single emitting layer (EML) devices DS1 and DS2 with the structure of ITO/MoO3 (molybdenum oxide, 5 nm)/TAPC (30 nm)/26DCzPPy (2,6-bis(3-(carbazol-9-yl)phenyl)pyridine): Ir3 or Ir4 (2 wt%, 10 nm)/TmPyPB (1,3,5-tri(m-pyrid-3-yl-phenyl)benzene, 40 nm)/LiF (1 nm)/Al (100 nm). MoO3 and LiF served as hole- and electron-injecting interface modified materials, respectively. TAPC, which has high hole mobility (1 × 10⁻² cm2 V−1 s−1) and high-lying LUMO level (−2.0 eV), was used as the hole transport/electron block layer (HTL/EBL),21 while TmPyPB with high electron mobility (1 × 10⁻³ cm2 V−1 s−1) and low-lying HOMO level (−6.7 eV) was used as the electron transport/hole block layer (ETL/HBL).22 The bipolar material 26DCzPPy was chosen as the host because its electron mobility (μe) and hole mobility (μh) values are nearly equal (1–8 × 10⁻⁵ cm2 V−1 s−1 at an electric field between 6.0 × 10⁵ and 1.0 × 10⁶ V cm−1), which benefits the electron–hole balance in the EML.23 The material chemical structures, as well as the device structure and energy level diagrams, are depicted in Fig. 6. Apparently, the HOMO/LUMO levels of the Ir3 and Ir4 calculated from the CV curves are within those of 26DCzPPy, thus, carriers are expected to transport easily between layers and excellent carrier trapping would be the main mechanism in the devices.24 Notably, carriers would be well confined and recombined within the EML. The EL spectra, current density–luminance–voltage, current efficiency–luminance and external quantum efficiency–luminance characteristics of all the devices are shown in Fig. 7. The key EL data are summarized in Table 2.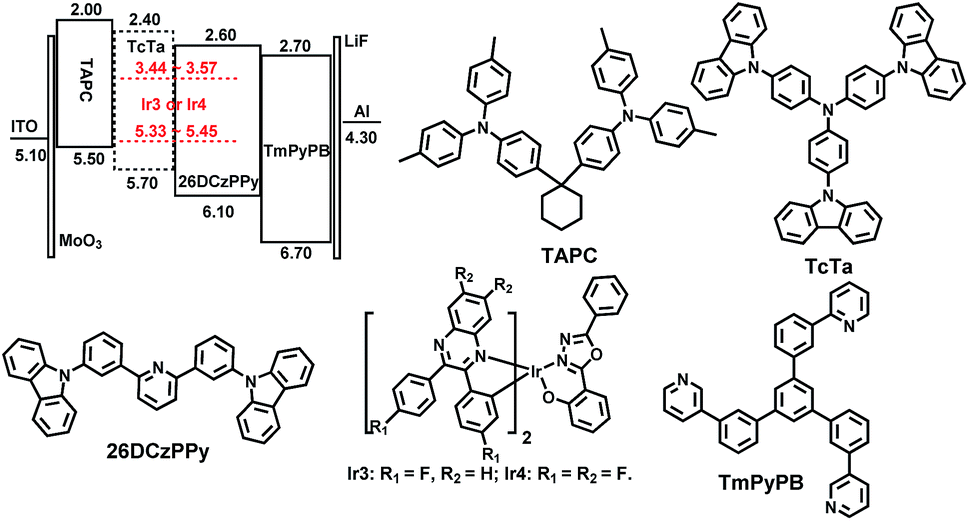 | ||
| Fig. 6 Energy level diagrams of HOMO and LUMO levels (relative to vacuum level) for materials investigated in this work and their molecular structures. | ||
 | ||
| Fig. 7 Characteristics of single-EML devices DS1 and DS2: (a) normalized EL spectra at 8 V; (b) current density–luminance–voltage (J–L–V) curves; (c) current efficiency–luminance (ηc–L) curves and (d) external quantum efficiency–luminance (EQE–L) curves. | ||
| Device | Emitter | Vturn-ona (V) | Lmaxb [cd m−2 (V)] | ηc,maxc (cd A−1) (EQEmaxd) | ηc,L1000e (cd A−1) (EQEL1000f) | ηp,maxg (lm W−1) | λmaxh (nm) | CIEi (x, y) |
|---|---|---|---|---|---|---|---|---|
| a Turn-on voltage recorded at a luminance of 1 cd m−2.b Maximum luminance.c Maximum current efficiency.d Maximum external quantum efficiency (EQE).e Current efficiency at 1000 cd m−2.f EQE at 1000 cd m−2.g Maximum power efficiency.h Values were collected at 8 V.i Commission Internationale de l'Eclairage coordinates (CIE) at 8 V. | ||||||||
| DS1 | Ir3 | 3.6 | 14044 (13.5) |
8.7 (10.1%) | 7.1 (8.5%) | 6.6 | 637 | 0.686, 0.314 |
| DS2 | Ir4 | 3.6 | 14768 (13.0) |
9.8 (12.1%) | 5.9 (7.2%) | 7.7 | 638 | 0.687, 0.312 |
| DD1 | Ir3 | 3.7 | 18503 (13.1) |
11.9 (15.0%) | 9.4 (11.9%) | 10.1 | 638 | 0.689, 0.311 |
| DD2 | Ir4 | 3.5 | 20676 (12.7) |
14.0 (17.8%) | 8.9 (11.4%) | 12.0 | 639 | 0.689, 0.311 |
Both the single-EML devices DS1 and DS2 exhibit typical emissions with peak maxima at 637 and 638 nm, respectively, in accordance with the PL spectra of Ir3 and Ir4 in the solution. The CIE (Commission Internationale de l'Eclairage) coordinates operated at 8 V are corresponded to the deep red region ((0.686, 0.314) for DS1 and (0.687, 0.312) for DS2). Apart from the characteristic emission of the Ir complexes, the devices displayed weak emission ranging from 350–500 nm, which originates from the host 26DCzPPy and is attributed to the accumulation of holes and electrons within the EML implying that few holes and electrons recombine on the host molecules. From Fig. 7 and Table 2, it can be seen that the single-EML device DS2 using Ir4 as the emitter shows better EL performances with the maximum luminance (Lmax), current efficiency (ηc,max), power efficiency (ηp,max) and external quantum efficiency (EQEmax) of up to 14768 cd m−2, 9.8 cd A−1, 7.7 lm W−1 and 12.1%, respectively. This is due to the high electron mobility of Ir4 as well as the low-lying LUMO level which is beneficial for the electron transport and trapping in the EML. These results indicate that fluorine on both the phenyl rings and the quinoxaline ring of the main ligand will enhance the EL performances of the Ir(III) complexes. However, the efficiency roll-off ratios of the devices DS1 and DS2 are apparent as the luminance rises. For example, the current efficiency and EQE of the device DS2 decline to 5.9 cd A−1 and 7.2%, respectively, at the luminance of 1000 cd m−2. In the single-EML devices, hole–electron recombination and exciton accumulation are expected near the interface of the EML (26DCzPPy: Ir complexes) and ETL (TmPyPB) leading to serious TTA/TPA effects and consequently high efficiency roll-off as the current density rises. Subsequently, more devices with double EMLs were prepared and investigated, which would broadens the recombination zone of holes and electrons in result of more balanced hole–electron recombination and better energy transport from the host to the dopant.
To further improve the EL performances of the complexes, double-EML devices named as DD1 and DD2, respectively, with the configuration of ITO/MoO3 (5 nm)/TAPC (30 nm)/TcTa (4,4′,4′′-tris(carbazol-9-yl) triphenylamine): Ir3 or Ir4 (2 wt%, 10 nm)/26DCzPPy: Ir3 or Ir4 (2 wt%, 10 nm)/TmPyPB (40 nm)/LiF (1 nm)/Al (100 nm) were also fabricated. The widely used p-type material TcTa was added as another host material which would also lower the HOMO energy barrier between TAPC and 26DCzPPy due to its matched HOMO level (−5.70 eV, Fig. 6).25 The EL characteristics of these devices are depicted in Fig. 8 and the key EL data are collected in Table 2 as well.
 | ||
| Fig. 8 Characteristics of double-EML devices DD1 and DD2: (a) normalized EL spectra at 8 V; (b) current density–luminance–voltage (J–L–V) curves; (c) current efficiency–luminance (ηc–L) curves and (d) external quantum efficiency–luminance (EQE–L) curves. | ||
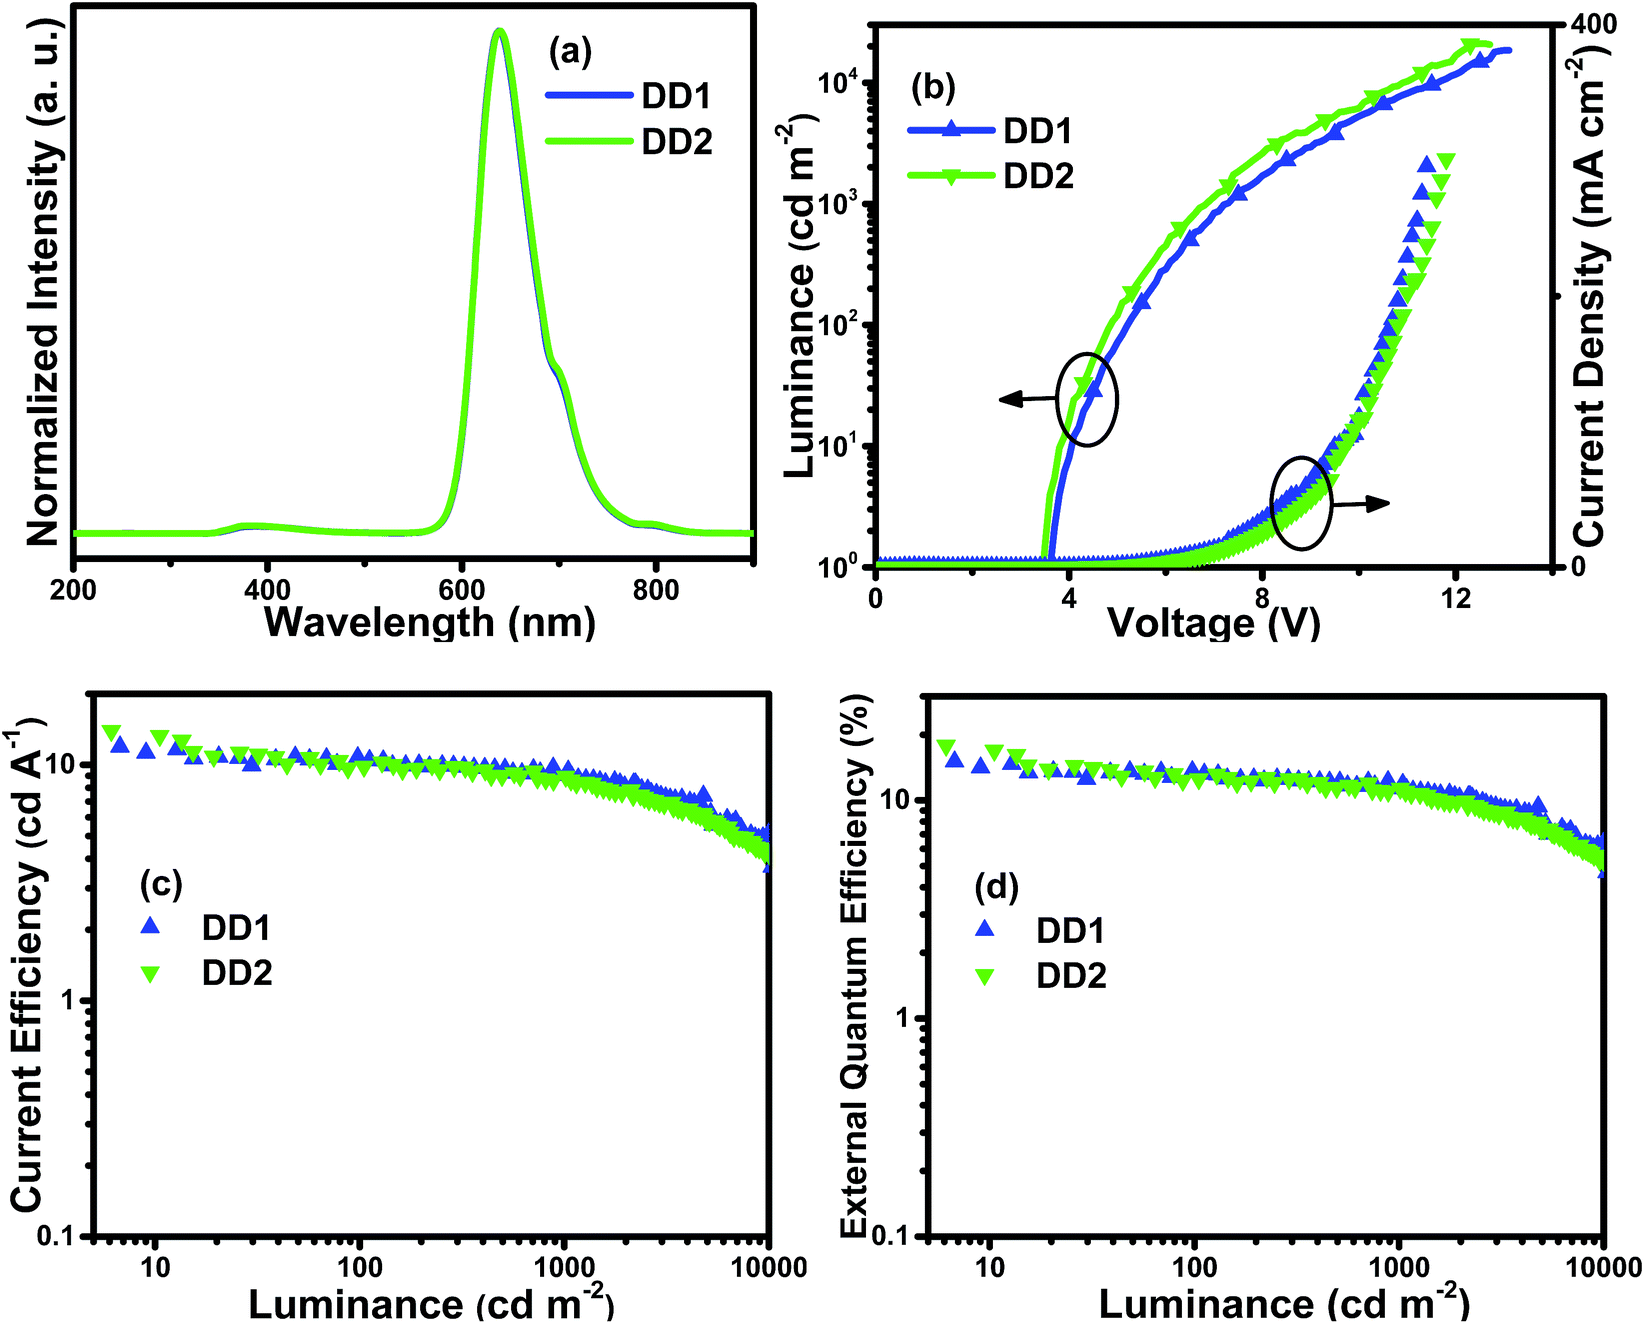
From the EL spectra in Fig. 8(a), it can be observed that both the double-EML devices exhibit deep red emission with the maximum peaks at 638 nm and 639 nm, respectively, which is also proved by the CIE coordinates. Additionally, there is no obvious distinction compared with the EL spectra (Fig. 7(a)) of the single-EML devices and the PL spectra of the complexes in solution (Fig. 3(b)). Weak emission in the range of 350–500 nm was observed in the EL spectra of double-EML devices caused by the emission of TcTa peaked at 385 nm. One reason is that TcTa is well-known as a kind of hole transport material, within the layer the imbalanced distribution of holes and electrons will cause the recombination of excitons on the TcTa molecules. Compared with the single-EML devices, both the double-EML devices display better EL performances with lower efficiency roll-off. The device DD2 with the Ir4 dopant has the best performances with the Lmax, ηc,max, ηp,max and EQEmax of 20676 cd m−2, 14.0 cd A−1, 12.0 lm W−1 and 17.8%, respectively. Furthermore, the efficiency roll-off of both double-EML devices is restrained. For instance, the ηc and EQE of the device DD1 can be retained as 9.4 cd A−1 and 11.9%, respectively, when the luminance rises to 1000 cd m−2. Compared with single-EML devices, double-EML devices possess improved hole injection ability from HTL into EMLs because the HOMO level of TcTa situates between those of TAPC and 26DCzPPy, thus causing the low hole injection barrier. Consequently, double-EML devices obtained better balance of carriers within EMLs, wider recombination zone and lower densities of excitons within EMLs, thus realizing higher luminance and efficiency as well as slighter efficiency roll-off.
Compared with the Ir(III) complexes with the same cyclometalated ligands and tetraphenylimidodiphosphinate (tpip) as the ancillary ligand in our recent work (Lmax: 25926 cd m−2, ηc,max: 16.6 cd A−1, ηp,max: 13.7 lm W−1, EQEmax: 19.9%),26 the devices with Ir3 and Ir4 as the emitters exhibit lower performances, because tpip ligands can improve the charge transport ability of the complexes and suppress TTA and TPA effects more efficiently. But the OLED performances are better than other Ir(III) complexes with similar 2,3-diphenylquinoxaline (DPQ) derivatives as main ligands,7 which is due to the high electron mobility realized by the introduction of 1,3,4-oxadiazole derivatives (POP) with good electron affinity as the ancillary ligands.
The complex Ir4 with fluoro-substituted on both phenyl and quinoxaline rings of the main ligands has better OLED performances than Ir3 with fluoro-substituted only on the phenyl rings, which is attributed to the higher electron mobility and PLQY. The results indicate that fluoro-substituents in the main ligands and the POP ancillary ligand with good electron affinity can improve the electron mobility of the Ir(III) complexes and suppress TTA and TPA effects, resulting in the significant OLED performances.
Conclusions
In conclusion, four novel Ir(III) complexes containing 2,3-diphenylquinoxaline derivatives with or without fluoro-substituents on different positions as the main ligands and 2-(5-phenyl-1,3,4-oxadiazol-2-yl)phenol as the ancillary ligand were thoroughly characterized. All the complexes emit deep red phosphorescence. The complexes Ir3 and Ir4 have higher electron mobility than that of the typical electron transport material Alq3. Compared with the single-EML devices, the double-EML devices with the complexes Ir3 or Ir4 as the emitter display better EL performances and lower efficiency roll-off. The double-EML device DD2 using the Ir4 dopant with four F atoms in the main ligands exhibits the best performances with the maximum luminance, current efficiency, power efficiency and external quantum efficiency of 20676 cd m−2, 14.06 cd A−1, 12.0 lm W−1 and 17.8%, respectively. The results suggest that the positions of fluoro-substitution can affect the photophysical properties and the EL performances of the iridium complexes. These Ir(III) complexes are potential deep red phosphorescent materials for specific applications of OLEDs.
Experimental section
General information
1H and 19F NMR spectra were measured on a Bruker AM 500 spectrometer. Electrospray ionization mass spectra (ESI-MS) were obtained with ESI-MS (LCQ Fleet, Thermo Fisher Scientific). The high resolution electrospray ionization mass spectra (HR ESI-MS) were recorded on an Agilent 6540 UHD Accurate-Mass Q-TOF LC/MS. Elemental analyses for C, H and N were performed on an Elementar Vario MICRO analyzer. TG-DSC measurements were carried out on a DSC 823e analyzer (METTLER). UV-vis absorption and photoluminescence spectra were measured on a Shimadzu UV-3100 and a Hitachi F-4600 spectrophotometer at room temperature, respectively. The luminescence quantum efficiency was calculated by a comparison of a standard sample [Ru(bpy)3]Cl2 in degassed CH2Cl2 solutions of 5 × 10⁻⁵ mol L−1.27 Cyclic voltammetry measurements were conducted on a MPI-A multifunctional electrochemical and chemiluminescent system at room temperature, with a polished Pt plate as the working electrode, platinum thread as the counter electrode and Ag–AgNO3 (0.1 M) in CH3CN as the reference electrode, tetra-n-butylammonium hexafluorophosphate (0.1 M) was used as the supporting electrolyte using Fc+/Fc as the internal standard and scan rate of 0.05 V s−1 in deaerated dichloromethane.X-ray crystallography
X-ray crystallographic measurements of the single crystals were carried out on a Bruker SMART CCD diffractometer (Bruker Daltonic Inc.) using monochromated Mo Kα radiation (λ = 0.71073 Å) at room temperature. Cell parameters were retrieved using SMART software and refined using SAINT28 program in order to reduce the highly redundant data sets. Data were collected using a narrow-frame method with scan width of 0.30° in ω and an exposure time of 5 s per frame. Absorption corrections were applied using SADABS29 supplied by Bruker. The structures were solved by Patterson methods and refined by full-matrix least-squares on F2 using the program SHELXS-2014.30 The positions of metal atoms and their first coordination spheres were located from direct-methods E-maps, other non-hydrogen atoms were found in alternating difference Fourier syntheses and least-squares refinement cycles and during the final cycles refined anisotropically. Hydrogen atoms were placed in calculated position and refined as riding atoms with a uniform value of Uiso.OLEDs fabrication and measurement
All OLEDs were fabricated on the pre-patterned ITO-coated glass substrate with a sheet resistance of 15 Ω sq−1. The deposition rate for organic compounds is 1–2 Å s−1. The phosphor and host were co-evaporated from two separate sources. The cathode consisting of LiF/Al was deposited by evaporation of LiF with a deposition rate of 0.1 Å s−1 and then by evaporation of Al metal with a rate of 3 Å s−1. The effective area of the emitting diode is 0.1 cm2. The characteristics of the devices were measured with a computer controlled KEITHLEY 2400 source meter with a calibrated silicon diode in air without device encapsulation. On the basis of the uncorrected PL and EL spectra, the CIE coordinates were calculated using a test program of the spectra scan PR650 spectrophotometer.Syntheses
Solvents were carefully dried and distilled from appropriate drying agents prior to use. All reactions were performed under nitrogen. The ligand 2,3-diphenylquinoxaline (L1) was purchased and used without further purification. The 2-(5-phenyl-1,3,4-oxadiazol-2-yl)phenol (HPOP) ligand and potassium salt (KPOP) were prepared according to our previous publications.8:ethyl acetate = 30:1) gave white powder for 6,7-difluoro-2,3-diphenylquinoxaline (L2), 2,3-bis(4-fluorophenyl)quinoxaline (L3) or 6,7-difluoro-2,3-bis(4-fluorophenyl)quinoxaline (L4).:1 v/v) was refluxed for 24 h. After cooling to room temperature, the mixture was filtered, and the precipitate was washed with H2O and petroleum ether to give the crude cyclometalated Ir(III) chloro-bridged dimer. The slurry of crude chloro-bridged dimer (0.50 mmol) and KPOP (1.10 mmol) in 2-ethoxyethanol (40 mL) was refluxed for 24 h. The crude product was purified by silica column chromatography (petroleum ether:ethyl acetate = 5:1), which were further purified by sublimation in vacuum.Acknowledgements
This work was supported by the National Natural Science Foundation of China (21371093, 91433113), the Major State Basic Research Development Program (2013CB922101) and the Natural Science Foundation of Jiangsu Province (BK20130054).Notes and references
- (a) S. Lamansky, P. Djurovich, D. Murphy, F. Abdel-Razzaq, H. E. Lee, C. Adachi, P. E. Burrows, S. R. Forrest and M. E. Thompson, J. Am. Chem. Soc., 2001, 123, 4304 CrossRef CAS PubMed; (b) W. Y. Wong and C. L. Ho, J. Mater. Chem., 2009, 19, 4457 RSC; (c) W. Y. Wong and C. L. Ho, Coord. Chem. Rev., 2009, 253, 1709 CrossRef CAS; (d) H. Sun, S. Liu, W. Lin, K. Y. Zhang, W. Lv, X. Huang, F. Huo, H. Yang, G. Jenkins, Q. Zhao and W. Huang, Nat. Commun., 2014, 5, 3601 Search PubMed; (e) L. Ying, C. L. Ho, H. Wu, Y. Cao and W. Y. Wong, Adv. Mater., 2014, 26, 2459 CrossRef CAS PubMed; (f) J. Zhao, Y. Yu, X. L. Yang, X. G. Yan, H. M. Zhang, X. B. Xu, G. J. Zhou, Z. X. Wu, Y. X. Ren and W. Y. Wong, ACS Appl. Mater. Interfaces, 2015, 7, 24703 CrossRef CAS PubMed; (g) K. Y. Zhang, X. Chen, G. Sun, T. Zhang, S. Liu, Q. Zhao and W. Huang, Adv. Mater., 2016, 28, 7137 CrossRef CAS PubMed; (h) Y. H. Zhou, Q. L. Xu, H. B. Han, Y. Zhao, Y. X. Zheng, L. Zhou, J. L. Zuo and H. J. Zhang, Adv. Opt. Mater., 2016, 4, 1726 CrossRef CAS; (i) Z. G. Wu, Y. M. Jing, G. Z. Lu, J. Zhou, Y. X. Zheng, L. Zhou, Y. Wang, J. L. Zuo, Y. Pan and H. J. Zhang, Sci. Rep., 2016, 6, 38478 CrossRef CAS PubMed; (j) R. Z. Cui, W. Q. Liu, L. Zhou, X. S. Zhao, Y. L Jiang, Y. X. Zheng and H. J. Zhang, J. Mater. Chem. C, 2017, 7, 2615 Search PubMed.
- (a) G. Zhou, C. L. Ho, W. Y. Wong, Q. Wang, D. Ma, L. Wang, Z. Lin, T. B. Marder and A. Beeby, Adv. Funct. Mater., 2008, 18, 499 CrossRef CAS; (b) S. Chen, G. Tan, W. Y. Wong and H. S. Kwok, Adv. Funct. Mater., 2011, 21, 3785 CrossRef CAS; (c) Y. Zheng, A. S. Batsanov, M. A. Fox, H. A. Al-Attar, K. Abdullah, V. Jankus, M. R. Bryce and A. P. Monkman, Angew. Chem., Int. Ed., 2014, 53, 11616 CrossRef CAS PubMed; (d) G. Li, D. Zhu, T. Peng, Y. Liu, Y. Wang and M. R. Bryce, Adv. Funct. Mater., 2014, 24, 7420 CrossRef CAS; (e) J. B. Kim, S. H. Han, K. Yang, S. K. Kwon, J. J. Kim and Y. H. Kim, Chem. Commun., 2015, 51, 58 RSC; (f) J. Zhao, Y. Yu, X. Yang, X. Yan, H. Zhang, X. Xu, G. Zhou, Z. Wu, Y. Ren and W. Y. Wong, ACS Appl. Mater. Interfaces, 2015, 7, 24703 CrossRef CAS PubMed; (g) J. Lee, H. F. Chen, T. Batagoda, C. Coburn, P. I. Djurovich, M. E. Thompson and S. R. Forrest, Nat. Mater., 2016, 15, 92 CrossRef CAS PubMed.
- (a) A. Tsuboyama, H. Iwawaki, M. Furugori, T. Mukaide, J. Kamatani, S. Igawa, T. Moriyama, S. Miura, T. Takiguchi, S. Okada, M. Hoshino and K. Ueno, J. Am. Chem. Soc., 2003, 125, 12971 CrossRef CAS PubMed; (b) S. Okada, K. Okinaka, H. Iwawaki, M. Furugori, M. Hashimoto, T. Mukaide, J. Kamatani, S. Igawa, A. Tsuboyama, T. Takiguchi and K. Ueno, Dalton Trans., 2005, 9, 1583 RSC; (c) G. Zhou, C. L. Ho, W. Y. Wong, Q. Wang, D. Ma, L. Wang, Z. Lin, T. B. Marder and A. Beeby, Adv. Funct. Mater., 2008, 18, 499 CrossRef CAS; (d) J. C. Deaton, R. H. Young, J. R. Lenhard, M. Rajeswaran and S. Huo, Inorg. Chem., 2010, 49, 9151 CrossRef CAS PubMed; (e) G. M. Li, D. X. Zhu, T. Peng, Y. Liu, Y. Wang and M. R. Bryce, Adv. Funct. Mater., 2014, 24, 7420 CrossRef CAS; (f) G. J. Li, J. Ecton, B. O'Brien and J. Li, Org. Electron., 2014, 15, 1862 CrossRef CAS; (g) X. L. Yang, X. B. Xu, J. S. Dang, G. J. Zhou, C. L. Ho and W. Y. Wong, Inorg. Chem., 2016, 55, 1720 CrossRef CAS PubMed; (h) J. Kim, K. H. Lee, S. J. Lee, H. W. Lee, Y. K. Kim, Y. S. Kim and S. S. Yoon, Chem.–Eur. J., 2016, 22, 4036 CrossRef CAS PubMed; (i) S. Z. Cao, L. Hao, W. Y. Lai, H. Zhang, Z. Yu, X. W. Zhang, X. Liu and W. Huang, J. Mater. Chem. C, 2016, 4, 4709 RSC.
- (a) J. L. Liao, Y. Chi, S. H. Liu, G. H. Lee, P. T. Chou, H. X. Huang, Y. D. Su, C. H. Chang, J. S. Lin and M. R. Tseng, Inorg. Chem., 2014, 53, 9366 CrossRef CAS PubMed; (b) C. L. Ho, H. Li and W. Y. Wong, J. Organomet. Chem., 2014, 751, 261 CrossRef CAS; (c) H. J. Bae, J. Chuang, H. Kim, J. Park, K. M. Lee, T. W. Koh, Y. S. Lee, S. Yoo, Y. Do and M. H. Lee, Inorg. Chem., 2014, 53, 128 CrossRef CAS PubMed; (d) X. J. Liu, S. M. Wang, B. Yao, B. H. Zhang, C. L. Ho, W. Y. Wong, Y. X. Cheng and Z. Y. Xie, Org. Electron., 2015, 21, 1 CrossRef CAS; (e) T. Fleetham, G. J. Li and J. Li, ACS Appl. Mater. Interfaces, 2015, 7, 16240 CrossRef CAS PubMed; (f) J. X. Jiang, D. H. Hu, M. Hanif, X. L. Li, S. J. Su, Z. Q. Xie, L. L. Liu, S. T. Zhang, B. Yang and Y. G. Ma, Adv. Opt. Mater., 2016, 4, 2109 CrossRef CAS; (g) A. Obolda, X. Ai, M. Zhang and F. Li, ACS Appl. Mater. Interfaces, 2016, 8, 35472 CrossRef CAS PubMed; (h) T. Ly, R. W. Chen-Cheng, H. W. Lin, Y. J. Shiau, S. H. Liu, P. T. Chou, C. S. Tsao, Y. C. Huang and Y. Chi, Nat. Photonics, 2017, 11, 63 Search PubMed.
- (a) J. P. Duan, P. P. Sun and C. H. Cheng, Adv. Mater., 2003, 15, 224 CrossRef CAS; (b) D. Schneidenbach, S. Ammermann, M. Debeaux, A. Freund, M. Zöllner, C. Daniliuc, P. G. Jones, W. Kowalsky and H. H. Johannes, Inorg. Chem., 2010, 49, 397 CrossRef CAS PubMed; (c) C. Yang, S. L. Lai, S. L. F. Chan, K. H. Low, G. Cheng, K. T. Yeung, C. C. Kwok and C. M. Che, Chem.–Asian J., 2014, 9, 3572 CrossRef CAS PubMed; (d) H. U. Kim, J. H. Jang, W. Song, B. J. Jung, J. Y. Lee and D. H. Hwang, J. Mater. Chem. C, 2015, 3, 12107 RSC; (e) Y. Jiao, M. Li, N. Wang, T. Lu, L. Zhou, Y. Huang, Z. Y. Lu, D. B. Luo and X. M. Pu, J. Mater. Chem. C, 2016, 4, 4269 RSC.
- (a) F. M. Hwang, S. Y. Chen, P. S. Chen, C. S. Liu, Y. Chi, C. F. Shu, F. L. Wu, P. T. Chou, S. M. Peng and G. H. Lee, Inorg. Chem., 2005, 44, 1344 CrossRef CAS PubMed; (b) S. Y. Ahn, H. S. Lee, J. H. Seo, Y. K. Kim and Y. Ha, Thin Solid Films, 2009, 517, 4111 CrossRef CAS; (c) S. Y. Ahn, J. H. Seo, Y. K. Kim and Y. Ha, J. Nanosci. Nanotechnol., 2009, 9, 7039 CrossRef CAS PubMed; (d) H. R. Park and Y. Ha, Mol. Cryst. Liq. Cryst., 2011, 538, 67 CrossRef CAS; (e) M. Song, S. J. Yun, K. S. Nam, H. Liu, Y. S. Gal, J. W. Lee, S. H. Jin, J. Y. Leem, S. K. Kang and Y. I. Kim, J. Organomet. Chem., 2015, 794, 197 CrossRef CAS.
- (a) B. Minaev, G. Baryshnikov and H. Agren, Phys. Chem. Chem. Phys., 2014, 16, 1719 RSC; (b) Y. J. Cho, S. Y. Kim, H. J. Son, D. W. Cho and S. O. Kang, Phys. Chem. Chem. Phys., 2017, 19, 8778 RSC.
- (a) H. Y. Li, T. Y. Li, M. Y. Teng, Q. L. Xu, S. Zhang, Y. M. Jin, X. Liu, Y. X. Zheng and J. L. Zuo, J. Mater. Chem. C, 2014, 2, 1116 RSC; (b) Y. M. Jin, C. C. Wang, L. S. Xue, T. Y. Li, S. Zhang, X. Liu, X. Liang, Y. X. Zheng and J. L. Zuo, J. Organomet. Chem., 2014, 765, 39 CrossRef CAS; (c) X. Liu, S. Zhang, Y.-M. Jin, G. Z. Lu, L. Jiang, X. Liang, Q. L. Xu and Y. X. Zheng, J. Organomet. Chem., 2015, 785, 11 CrossRef CAS; (d) Y. M. Jing, Y. Zhao and Y. X. Zheng, Dalton Trans., 2017, 46, 845 RSC; (e) Y. M. Jing, Y. X. Zheng and J. L. Zuo, RSC Adv., 2017, 7, 2615 RSC.
- (a) T. Hofbeck and H. Yersin, Inorg. Chem., 2010, 49, 9290 CrossRef CAS PubMed; (b) S. K. Leung, K. Y. Kwok, K. Y. Zhang and K. K. W. Lo, Inorg. Chem., 2010, 49, 4984 CrossRef CAS PubMed; (c) Y. Tao, C. Yang and J. Qin, Chem. Soc. Rev., 2011, 40, 2943 RSC; (d) E. E. Langdon-Jones, A. J. Hallett, J. D. Routledge, D. A. Crole, B. D. Ward, J. A. Platts and S. J. Pope, Inorg. Chem., 2012, 52, 448 CrossRef PubMed; (e) M. Tavasli, T. N. Moore, Y. Zheng, M. R. Bryce, M. A. Fox, G. C. Griffiths, V. Jankus, H. A. Al-Attar and A. P. Monkman, J. Mater. Chem., 2012, 22, 6419 RSC.
- (a) M. A. Baldo and S. R. Forrest, Phys. Rev. B: Condens. Matter Mater. Phys., 2000, 62, 10958 CrossRef CAS; (b) E. B. Namdas, A. Ruseckas and I. D. W. Samuel, Appl. Phys. Lett., 2005, 86, 091104 CrossRef.
- P. Brulatti, R. J. Gildea, J. A. K. Howard, V. Fattori, M. Cocchi and J. A. Gareth Williams, Inorg. Chem., 2012, 51, 3813 CrossRef CAS PubMed.
- (a) E. Runge and E. K. U. Gross, Phys. Rev. Lett., 1984, 52, 997 CrossRef CAS; (b) C. Lee, W. Yang and R. G. Parr, Phys. Rev. B: Condens. Matter Mater. Phys., 1988, 37, 785 CrossRef CAS; (c) A. D. Becke, J. Chem. Phys., 1993, 98, 5648 CrossRef CAS; (d) B. W. D'Andrade, S. Datta, S. R. Forrest, P. Djurovich, E. Polikarpov and M. E. Thompson, Org. Electron., 2005, 6, 11 CrossRef.
- (a) M. M. Francl, W. J. Pietro, W. J. Hehre, J. S. Binkley, M. S. Gordon, D. J. DeFrees and J. A. Pople, J. Chem. Phys., 1982, 77, 3654 CrossRef CAS; (b) P. J. Hay and W. R. Wadt, J. Chem. Phys., 1985, 82, 299 CrossRef CAS.
- V. Barone and M. Cossi, J. Phys. Chem. A, 1988, 102, 1995 CrossRef.
- M. J. Frisch, G. W. Trucks, H. B. Schlegel, G. E. Scuseria, M. A. Robb, J. R. Cheeseman, G. Scalmani, V. Barone, B. Mennucci, G. A. Petersson, H. Nakatsuji, M. Caricato, X. Li, H. P. Hratchian, A. F. Izmaylov, J. Bloino, G. Zheng, J. L. Sonnenberg, M. Hada, M. Ehara, K. Toyota, R. Fukuda, J. Hasegawa, M. Ishida, T. Nakajima, Y. Honda, O. Kitao, H. Nakai, T. Vreven, J. A. Montgomery Jr, J. E. Peralta, F. Ogliaro, M. Bearpark, J. J. Heyd, E. Brothers, K. N. Kudin, V. N. Staroverov, R. Kobayashi, J. Normand, K. Raghavachari, A. Rendell, J. C. Burant, S. S. Iyengar, J. Tomasi, M. Cossi, N. Rega, J. M. Millam, M. Klene, J. E. Knox, J. B. Cross, V. Bakken, C. Adamo, J. Jaramillo, R. Gomperts, R. E. Stratmann, O. Yazyev, A. J. Austin, R. Cammi, C. Pomelli, J. W. Ochterski, R. L. Martin, K. Morokuma, V. G. Zakrzewski, G. A. Voth, P. Salvador, J. J. Dannenberg, S. Dapprich, A. D. Daniels, O. Farkas, J. B. Foresman, J. V. Ortiz, J. Cioslowski and D. J. Fox, Gaussian 09, Revision A.01, Gaussian, Inc., Wallingford, CT, 2009 Search PubMed.
- A. L. Tenderholt, QMForge, version 2.2, 2013, http://qmforge.sourceforge.net Search PubMed.
- (a) S. Heun and P. Borsenberger, Chem. Phys., 1995, 200, 245 CrossRef CAS; (b) H. Fong, K. Lun and S. So, Chem. Phys. Lett., 2002, 353, 407 CrossRef CAS.
- (a) J. Kalinowski, W. Stampor, J. Mȩżyk, M. Cocchi, D. Virgili, V. Fattori and P. Di Marco, Phys. Rev. B: Condens. Matter Mater. Phys., 2002, 66, 235321 CrossRef; (b) W. S. Jeon, T. J. Park, S. Y. Kim, R. Pode, J. Jang and J. H. Kwon, Appl. Phys. Lett., 2008, 93, 063303 CrossRef; (c) G. J. Zhou, W. Y. Wong, B. Yao, Z. Xie and L. Wang, J. Mater. Chem., 2008, 18, 1799 RSC.
- (a) S. Tse, H. Fong and S. So, J. Appl. Phys., 2003, 94, 2033 CrossRef CAS; (b) M. Y. Teng, S. Zhang, S. W. Jiang, X. Yang, C. Lin, Y. X. Zheng, L. Wang, D. Wu, J. L. Zuo and X. Z. You, Appl. Phys. Lett., 2012, 100, 073303 CrossRef.
- (a) H. Scher and E. W. Montroll, Phys. Rev. B: Solid State, 1975, 12, 2455 CrossRef CAS; (b) A. Pal, R. Österbacka, K.-M. Källman and H. Stubb, Appl. Phys. Lett., 1997, 71, 228 CrossRef CAS.
- J. Lee, N. Chopra, S. H. Eom, Y. Zheng, J. Xue, F. So and J. Shi, Appl. Phys. Lett., 2008, 93, 123306 CrossRef.
- S. J. Su, T. Chiba, T. Takeda and J. Kido, Adv. Mater., 2008, 20, 2125 CrossRef CAS.
- (a) S. J. Su, H. Sasabe, T. Takeda and J. Kido, Chem. Mater., 2008, 20, 1691 CrossRef CAS; (b) S. J. Su, C. Cai and J. Kido, Chem. Mater., 2011, 23, 274 CrossRef CAS.
- (a) M. Uchida, C. Adachi, T. Koyama and Y. Taniguchi, J. Appl. Phys., 1999, 86, 1680 CrossRef CAS; (b) M. Ikai, S. Tokito, Y. Sakamoto, T. Suzuki and Y. Taga, Appl. Phys. Lett., 2001, 79, 156 CrossRef CAS.
- (a) M. Ikai, S. Tokito, Y. Sakamoto, T. Suzuki and Y. Taga, Appl. Phys. Lett., 2001, 79, 156 CrossRef CAS; (b) T. Serevičius, T. Nakagawa, M. C. Kuo, S. H. Cheng, K. T. Wong, C. H. Chang, R. C. Kwong, S. Xia and C. Adachi, Phys. Chem. Chem. Phys., 2013, 15, 15850 RSC.
- Y. M. Jing, F. Z. Wang, Y. X. Zheng and J. L. Zuo, J. Mater. Chem. C, 2017, 5, 3714 RSC.
- (a) Z. Q. Chen, Z. Q. Bian and C. H. Huang, Adv. Mater., 2010, 22, 1534 CrossRef CAS PubMed; (b) Y. C. Zhu, L. Zhou, H. Y. Li, Q. L. Xu, M. Y. Teng, Y. X. Zheng, J. L. Zuo, H. J. Zhang and X. Z. You, Adv. Mater., 2011, 23, 4041 CrossRef CAS PubMed.
- SAINT-Plus, version 6.02, Bruker Analytical X-ray System, Madison, WI, 1999 Search PubMed.
- G. M. Sheldrick, SADABS An empirical absorption correction program, Bruker Analytical X-ray Systems, Madison, WI, 1996 Search PubMed.
- G. M. Sheldrick, SHELXTL-2014, Universität of Göttingen, Göttingen, Germany, 2014 Search PubMed.
Footnote |
| † Electronic supplementary information (ESI) available: Parameters associated with the single crystal diffraction data, selected bond lengths and angles of Ir1 and Ir3. Electrochemical data, percentage distributions of HOMO/LUMO and the lifetime curves in degassed solution at room temperature of the complexes Ir1 to Ir4. Power efficiency–luminance curves of DS1/DS2 and DD1/DD2 devices. PL spectra in neat and doped films of Ir3 and Ir4. CCDC 1535471 and 1535473. For ESI and crystallographic data in CIF or other electronic format see DOI: 10.1039/c7ra05530g |
| This journal is © The Royal Society of Chemistry 2017 |