 Open Access Article
Creative Commons Attribution 3.0 Unported Licence
Hybrid nanocomposites of nanostructured Co3O4 interfaced with reduced/nitrogen-doped graphene oxides for selective improvements in electrocatalytic and/or supercapacitive properties†
Sheng Hu‡
bcd,
Erick L. Ribeiro‡bcd,
Seyyed Ali Davariac,
Mengkun Tianb,
Dibyendu Mukherjee *abcd and
Bamin Khomami*abd
aDepartment of Mechanical, Aerospace, & Biomedical Engineering, University of Tennessee, Knoxville, Tennessee 37996, USA. E-mail: dmukherj@utk.edu; bkhomami@utk.edu; Tel: +1 86 5974 5309 Tel: +1 86 5974 2035
bDepartment of Chemical & Biomolecular Engineering, University of Tennessee, Knoxville, Tennessee 37996, USA
cNano-BioMaterials Laboratory for Energy, Energetics & Environment (nbmL-E3), University of Tennessee, Knoxville, Tennessee 37996, USA
dSustainable Energy Education & Research Center (SEERC), University of Tennessee, Knoxville, Tennessee 37996, USA
First published on 30th June 2017
Abstract
Performance enhancements in next-generation electrochemical energy storage/conversion devices require the design of new classes of nanomaterials that exhibit unique electrocatalytic and supercapacitive properties. To this end, we report the use of laser ablation synthesis in solution (LASiS) operated with cobalt as the target in graphene oxide (GO) solution in tandem with two different post-treatments to manufacture three kinds of hybrid nanocomposites (HNCs) namely, (1) Co3O4 nanoparticle (NP)/reduced graphene oxide (rGO), (2) Co3O4 nanorod (NR)/rGO, and (3) Co3O4 NP/nitrogen-doped graphene oxide (NGO). FTIR and Raman spectroscopic studies indicate that both chemical and charge-driven interactions are partially responsible for embedding the Co3O4 NPs/NRs into the various GO films. We tune the selective functionalities of the as-synthesized HNCs as oxygen reduction reaction (ORR) catalysts and/or supercapacitors by tailoring their structure–property relationships. Specifically, the nitrogen doping in the NP/NGO HNC samples promotes higher electron conductivity while hindering aggregation between 0D CoO NPs that are partially reshaped into Co3O4 nanocubes due to induced surface strain energies. Our results indicate that such interfacial energetics and arrangements lead to superior ORR electrocatalytic activities. On the other hand, the interconnecting 1D nanostructures in the NR/rGO HNCs benefit charge transport and electrolyte diffusion at the electrode–electrolyte interfaces, thereby promoting their supercapacitive properties. The NP/rGO HNCs exhibit intermediate functionalities towards both ORR catalysis and supercapacitance.
Introduction
The increasing global demand for clean and sustainable energy sources has triggered significant impetus towards the research and development of electrochemical energy storage/conversion systems such as proton/anion exchange membrane fuel cells (PEMFCs/AEMFCs) and supercapacitors.1–5 Fuel cell devices typically require highly active and cost-effective catalysts to accelerate the rate-determining and sluggish oxygen reduction reactions (ORR) at the cathode.6–8 To this end, efforts have been recently devoted to the synthesis of non-platinum group metal (non-PGM) electrocatalysts to replace the traditionally expensive Pt-based catalysts that are prone to extensive aggregation and loss of surface area during operation, especially under the prevalent alkaline/acidic operating conditions of PEMFCs/AEMFCs.9,10 On the other hand, supercapacitors, including electrochemical double-layer capacitors (EDLC) and pseudo-capacitors, have concurrently gained prominence due to their superior power densities and longer life cycles comparing with typical batteries and fuel cells, and higher energy densities when compared to conventional dielectric capacitors.4,11–14 Specifically, the EDLCs are driven by the electrostatic energy storage achieved via nanoscopic charge separation in a Helmholtz double layer at the matter–electrolyte interface. In comparison, pseudo-capacitors typically store electrical energy faradaically based upon the electron charge transfer between electrodes and electrolytes, where non-PGM electrocatalysts can also play critical roles in facilitating the charge transfer processes.Graphene and reduced graphene oxide (rGO) have been well-characterized as the classical two-dimensional (2D) materials with unique honey-comb lattice structures that exhibit unique physicochemical properties along with high electrochemistry surface area and conductivity.1,15–20 Additionally, efforts have been directed towards chemically reacting GO with nitrogen-containing species to synthesize nitrogen-doped GO (NGO) that are known to exhibit higher electron mobility and chemical compatibilities as compared to other metal/metal oxides dopants.7,9,10,21–27 In turn, both rGO and NGO have been widely explored and reported as potentially excellent supporting materials for various catalytic systems as well as EDLC materials.5,28–32
A highly promising earth-abundant transition metal oxide, cobalt oxide (Co3O4)-based nanomaterials have gained prominence in recent years due to their relatively good ORR activities in alkaline conditions (specifically, for AEMFCs) along with outstanding pseudo-capacitance capabilities.6,17,18,25,33,34 To this end, much recent research has been devoted to assembly of Co3O4 nanoparticles (NPs), nanorods (NRs), and nanosheets into rGO/NGO to form hybrid nanocomposites (HNCs).7,25,26,35 The inherent strong coupling and consequent synergistic effects between the metal oxide nanostructures and rGO/NGO result in larger effective electrochemical surface areas and higher electron conductivity for the faradaic reactions to take place.1,18,36–42 This, in turn, promotes a higher and more stable ORR catalytic activity as well as an enhanced capacitive capability that facilitates their behaviors as both EDLC and pseudocapacitors.7,25,43–46 However, simple physical mixing of metal oxides and rGO/NGO would inevitably impede the charge transfer processes across the composite material for both ORR and capacitive performances due to the high electron resistivity at the interface.17,47,48
To address the abovementioned issue, researchers have typically resorted to chemical synthesis routes to assemble various heteronanostructures chemisorbed and/or embedded into 2D matrices such as graphene, GO, MoS2, etc.1,40,49 While such routes have been successfully used in the past to synthesize HNCs, they almost always involve complex multiple steps50,51 and sometimes unwanted/harsh chemical and surfactants52 that can be left behind as residues, thereby degrading the active interfacial areas for catalytic and charge transport pathways. To this end, we have recently reported the use of LASiS as well as LASiS in tandem with galvanic replacement reaction (GRR) as a facile and environmentally-clean route to manufacture diverse classes of heteronanostructures including Co3O4 NPs/NRs, single crystal β-Co(OH)2 NPs, and Pt-based binary/ternary nanoalloys and nanocomposites.53–56 The merit of LASiS stems from the extreme temperature and pressure inside the laser-induced plasma plume that facilitates the nucleation of seeding NPs from within a cavitation bubble and subsequent ultrafast reactions with the surrounding solution-phase species.57–66 Furthermore, the charge screening effects arising from the high-density laser-induced plasma prevent the NP aggregations to a large extent without the use of any external surfactants/ligands. It is also noted that the kinetics of such reactions are driven by out-of-equilibrium thermodynamic conditions that promote the formation of nanomaterials in metastable phases.53,61,67–70 Consequently, it becomes possible to further modify the structure/composition of various metastable products by tuning the appropriate experimental protocols.
Herein, we report the use of LASiS in conjunction with two different post-treatments to incorporate three types of cobalt oxide nanostructures into rGO/NGO sheets for synthesizing tailored HNCs. Our aim is to investigate the selective tuning of the ORR catalytic and/or supercapacitive properties of the HNCs via systematic synthesis–structure–property characterizations.
Experimental details
Synthesis of hybrid nanocomposites (HNCs)
![[thin space (1/6-em)]](https://www.rsc.org/images/entities/char_2009.gif) :
:![[thin space (1/6-em)]](https://www.rsc.org/images/entities/char_2009.gif) 1 (urea
1 (urea![[thin space (1/6-em)]](https://www.rsc.org/images/entities/char_2009.gif) :
:![[thin space (1/6-em)]](https://www.rsc.org/images/entities/char_2009.gif) GO). The mixture was sealed in a 50 mL Teflon-lined autoclave and held at 180 °C for 3 hours. The products were filtered and washed several times with DI-water. Finally, the dark powder obtained from the filtration was dried at 80 °C for 3 hours.
GO). The mixture was sealed in a 50 mL Teflon-lined autoclave and held at 180 °C for 3 hours. The products were filtered and washed several times with DI-water. Finally, the dark powder obtained from the filtration was dried at 80 °C for 3 hours.Characterizations
A Zeiss Libra 200MC monochromated transmission electron microscope (TEM) was used with an accelerating voltage of 200 kV for regular TEM characterizations along with selected area electron diffraction (SAED) and energy dispersive X-ray spectroscopy (EDX). The scanning electron microscopy (SEM) images were acquired using a Philips XL-30ESEM equipped with an energy dispersive X-ray spectroscopy. A Zetasizer (Make: Malvern; Model: nano ZS) was used for measuring zeta potentials of the colloidal solutions. The Co concentrations in the composites under study were measured via inductively coupled plasma optical emission spectroscopy (ICP-OES) (Make: Perkin Elmer; Model: Optima 4300 DV) and our in-house developed quantitative laser-induced breakdown spectroscopy (Q-LIBS) as described elsewhere.72–75 X-ray diffraction (XRD) was carried out on a Phillips X'Pert-Pro diffractometer equipped with a Cu Ka source at 45 kV and 40 mA. The Fourier transformed infrared (FTIR) spectrum was obtained using a Nicolet 6700 FT-IR Spectrometer at the wavenumber range of 400 to 3000 cm−1. Raman spectra were acquired using an NT-MDT NTEGRA spectra with a 532 nm laser beam. Thermogravimetric analysis (TGA) were carried out under an air atmosphere using a Perkin Elmer Thermal Analyzer at a heating rate of 5 °C min−1. AFM images were collected in the tapping mode on a Dimension ICON instrument from Veeco. X-ray photoelectron spectroscopy (XPS) data was collected using a SPECS Phoibos 150 analyzer with the Al K-alpha fluorescence line providing photon energy of 1486.7 eV. The overall energy resolution of the experiment was set to about 0.7 eV.Electrochemical tests
The rotating disk electrode (RDE) setup was bought from Pine instrument company, LLC. A conventional, three-compartment electrochemical cell comprising a saturated double junction Ag/AgCl electrode as the reference electrode, and a platinum coil as the counter electrode were used for all the EC tests. All potentials in this work are reported in reference to the standard hydrogen electrode (SHE).| JK = nFkC0; B = 0.62nFC0D02/3ν−1/6 |
![[thin space (1/6-em)]](https://www.rsc.org/images/entities/char_2009.gif) :
:![[thin space (1/6-em)]](https://www.rsc.org/images/entities/char_2009.gif) 1
1![[thin space (1/6-em)]](https://www.rsc.org/images/entities/char_2009.gif) :
:![[thin space (1/6-em)]](https://www.rsc.org/images/entities/char_2009.gif) 1. The electrodes were fabricated by loading the blend onto the surface of nickel foam sheets, drying at 80 °C for 8 h, and pressing under 10 MPa for 5 s. The typical mass loading of the electrode active material was about ∼3–5 mg. 6 M KOH solution was used as the electrolyte. Cyclic voltammetry (CV) measurements were conducted in a potential window of −0.15 to 0.35 V at the scanning rate of 20 mV s−1. The charge–discharge tests were carried out at different current densities over a potential range of −0.1 to 0.35 V. Electrochemical impedance spectroscopy (EIS) was carried out on the same electrochemistry workstation in the frequency range from 0.05 Hz to 100 kHz for an open-circuit potential with 5 mV as the amplitude potential. The specific capacitance was calculated from the following equation:
1. The electrodes were fabricated by loading the blend onto the surface of nickel foam sheets, drying at 80 °C for 8 h, and pressing under 10 MPa for 5 s. The typical mass loading of the electrode active material was about ∼3–5 mg. 6 M KOH solution was used as the electrolyte. Cyclic voltammetry (CV) measurements were conducted in a potential window of −0.15 to 0.35 V at the scanning rate of 20 mV s−1. The charge–discharge tests were carried out at different current densities over a potential range of −0.1 to 0.35 V. Electrochemical impedance spectroscopy (EIS) was carried out on the same electrochemistry workstation in the frequency range from 0.05 Hz to 100 kHz for an open-circuit potential with 5 mV as the amplitude potential. The specific capacitance was calculated from the following equation:where C is the specific capacitance, I am the current density during discharging, m is the weight loading of the electroactive material.
Results and discussion
Structural characterizations
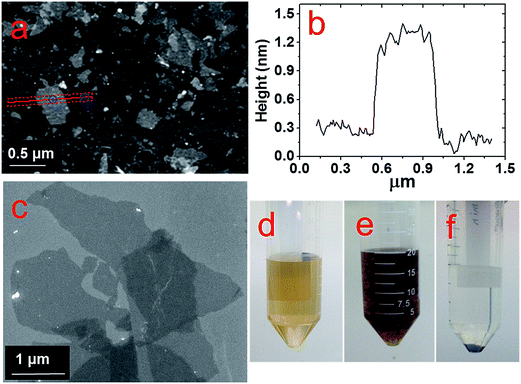
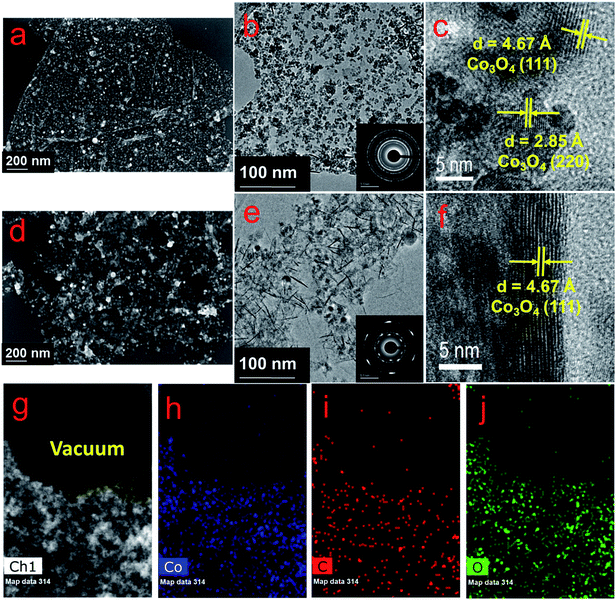
The GO flakes synthesized via the improved Hummer's method indicate lateral dimensions of ∼1 μm, as shown in both AFM and SEM images in Fig. 1a–c respectively. The height profile in Fig. 1b for the corresponding cross-section (marked as the red line in Fig. 1a) indicates the average flake thickness to be ∼1 nm that corresponds to 2–3 GO layers. Fig. 1d reveals a uniform dispersion for the as-synthesized GO flakes in the aqueous suspension, which aggregates instantly after the LASiS process (Fig. 1e) and in turn, easily precipitates upon centrifugation (Fig. 1f). Such aggregation arises largely due to the oppositely charged surfaces for the Co/CoOx NPs and GO flakes, as seen from the zeta potential measurements shown in ESI (EIS, Fig. S1†). Specifically, the Co/CoOx NPs from LASiS carry net effective positive charges in the Stern layer (a positive zeta potential of ∼+32 mV), while the GO flakes carry net effective negative Stern layer charges (a negative zeta potential of ∼−55 mV). Hence, the two species quickly attract each other during the LASiS step to neutralize the interfacial charges and in turn, form fluffy aggregates due to lack of charge stabilization. It needs to be borne in mind that the zeta potentials for both pure GO flakes and CoOx NPs being >+30 mV and <−30 mV respectively allow for the electrostatic stabilization of their respective aqueous suspensions.In order to make better electrochemical supporting materials, the conductivity of the GO sheets in the as-synthesised CoOx/GO nanocomposites are improved via two different reduction processes namely, (1) direct heating at 250 °C, and (2) nitrogen-doping (N-doping) to generate rGO and NGO respectively as the supporting matrices for the various Co3O4 nanostructures (as described in detail in the Experimental part). It needs to be mentioned here that the initial products from LASiS on Co are the metastable CoO and/or Co(OH)2 crystals, both of which transform into Co3O4 NPs as the final product upon aging or heating, as also noted in our earlier work.53 The SEM and TEM images in Fig. 2a–e indicate the various morphologies for the Co3O4/rGO HNCs made from the direct heating routes. For the pH7 case, Fig. 2a and b indicates the formation of uniformly distributed NPs in GO sheets. Here, the crystalline structures from electron diffraction pattern (inset in Fig. 1b) and lattice fringes from high-resolution TEM (HRTEM) images (Fig. 1c) confirm the NPs to be Co3O4 (enlarged image along with detailed crystalline structure identification can be found in Fig. S2 and Table S1 in ESI†). In contrast, for the pH13 case, Fig. 2d–f indicate the formation of a mixture of Co3O4 NPs and nanorods (NRs) uniformly distributed on rGO matrices (also indicated by the inset in Fig. 2e and demonstrated in Fig. S2 and Table S1 in ESI†). Such formation of Co3O4 NRs is attributed to the breakdown of Co(OH)2 hexagonal single crystals, as discussed in detail in our previous work.53 Besides, the EDX mappings in Fig. 2g–j for the Co3O4 NP/rGO HNC samples further confirm the even distribution of each element/species in the HNCs. In our second reduction route, the N-doping procedure (as detailed in Experimental section) on the CoOx/GO samples made from LASiS at pH7 conditions generates NH3 molecules that quickly react with surface functional groups on the GO and consequently induce the formation of Co3O4/NGO HNCs. Specifically, in this case, it is clearly observed from Fig. 3a–c that during the N-doping process, some of the spherical CoOx NPs get structurally re-arranged into Co3O4 nanocubes indicating relatively less agglomeration. We attribute this to the possible spatial confinement of the NPs within ∼5–6 layers of the NGO, as seen from HRTEM images in Fig. 3b and c, that re-distributes the surface energy during the crystalline growth of the Co3O4 NPs. Such spatial confinements from few layers of graphitic shells have also been reported in previous literature.76 Meanwhile, it should also be pointed out that in this case, the NPs show a relatively poorer coverage on NGO (Fig. 3a) as compared to the surface coverage for the Co3O4/rGO HNCs. For ease of understanding, from here onwards, we refer to the aforementioned three products as NP/rGO (pH7), NR/rGO (pH13) and NP/NGO (pH7, N-doping) respectively. The weight ratios of Co3O4![[thin space (1/6-em)]](https://www.rsc.org/images/entities/char_2009.gif) :
:![[thin space (1/6-em)]](https://www.rsc.org/images/entities/char_2009.gif) C were estimated from Q-LIBS measurements and confirmed by ICP-OES to be 3
C were estimated from Q-LIBS measurements and confirmed by ICP-OES to be 3![[thin space (1/6-em)]](https://www.rsc.org/images/entities/char_2009.gif) :
:![[thin space (1/6-em)]](https://www.rsc.org/images/entities/char_2009.gif) 1 for both NP/rGO and NP/NGO, and 3
1 for both NP/rGO and NP/NGO, and 3![[thin space (1/6-em)]](https://www.rsc.org/images/entities/char_2009.gif) :
:![[thin space (1/6-em)]](https://www.rsc.org/images/entities/char_2009.gif) 2 for NR/rGO as reported in EIS (Fig. S6 and S7†). The XRD patterns for the various HNC products under study are shown in Fig. 4. The pure GO exhibits a distinct peak at ∼12°, which corresponds to GO (002) and implies an interlayer spacing of about 0.76 nm, while the two small peaks at ∼34° and 45° are due to trace amounts of impurities. The absence of the GO (002) peak after the incorporation of Co3O4 nanostructures (NPs/NRs) suggest a disruption of the GO lattice stacking as well as partial reduction during the reaction with seeding Co NPs. After the N-doping process, a broad peak located at ∼25° is exhibited for the NP/NGO sample, suggesting a successful reduction of GO. The NP/rGO samples before heating (NP/rGO-RT) indicate very weak peaks for Co(OH)2 (001) at ∼19°, which quickly disappears after calcination at 250 °C (NP/rGO-250) due to the relative instability of Co(OH)2 at high temperatures. A similar phenomenon is also observed for the NR/rGO samples, except that a huge Co(OH)2 (001) peak appears before the heating (NR/rGO-RT). This is clearly attributed to the reaction between the seeding Co NPs from LASiS and the concentrated solution phase OH− from the alkaline conditions (pH13). The transformation of these metastable Co(OH)2 nanocrystals into Co3O4 under alkaline conditions lead to their selective crystalline growth as nanorods. In consequence, the emergence of a Co3O4 (311) peak is seen after heating the samples to 250 °C (NR/rGO-250). These observations have also been reported and explained in details in our earlier work.53 Finally, we would like to mention that neither NP/rGO nor NP/NGO samples show any Co3O4 peaks in the XRD pattern due to the relatively small NP sizes as well as the weak crystallization processes, which is as a result of the non-equilibrium ultrafast quenching of the laser-induced plasma plume in water where the NPs are generated.
2 for NR/rGO as reported in EIS (Fig. S6 and S7†). The XRD patterns for the various HNC products under study are shown in Fig. 4. The pure GO exhibits a distinct peak at ∼12°, which corresponds to GO (002) and implies an interlayer spacing of about 0.76 nm, while the two small peaks at ∼34° and 45° are due to trace amounts of impurities. The absence of the GO (002) peak after the incorporation of Co3O4 nanostructures (NPs/NRs) suggest a disruption of the GO lattice stacking as well as partial reduction during the reaction with seeding Co NPs. After the N-doping process, a broad peak located at ∼25° is exhibited for the NP/NGO sample, suggesting a successful reduction of GO. The NP/rGO samples before heating (NP/rGO-RT) indicate very weak peaks for Co(OH)2 (001) at ∼19°, which quickly disappears after calcination at 250 °C (NP/rGO-250) due to the relative instability of Co(OH)2 at high temperatures. A similar phenomenon is also observed for the NR/rGO samples, except that a huge Co(OH)2 (001) peak appears before the heating (NR/rGO-RT). This is clearly attributed to the reaction between the seeding Co NPs from LASiS and the concentrated solution phase OH− from the alkaline conditions (pH13). The transformation of these metastable Co(OH)2 nanocrystals into Co3O4 under alkaline conditions lead to their selective crystalline growth as nanorods. In consequence, the emergence of a Co3O4 (311) peak is seen after heating the samples to 250 °C (NR/rGO-250). These observations have also been reported and explained in details in our earlier work.53 Finally, we would like to mention that neither NP/rGO nor NP/NGO samples show any Co3O4 peaks in the XRD pattern due to the relatively small NP sizes as well as the weak crystallization processes, which is as a result of the non-equilibrium ultrafast quenching of the laser-induced plasma plume in water where the NPs are generated.
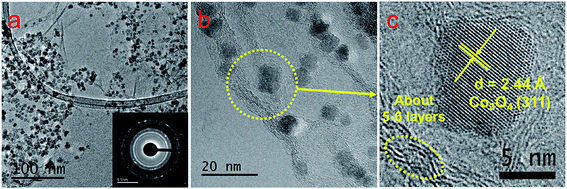 | ||
| Fig. 3 TEM (a) and HRTEM (b and c) images of the Co3O4 NP/NGO HNCs. The inset in (a) reveals the corresponding SAED patterns. | ||
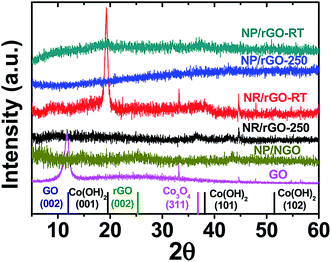 | ||
| Fig. 4 Comparison of XRD patterns for various HNC samples under study. The standard peak position for each species is shown by the vertical lines at the bottom. | ||
Interfacial characterizations
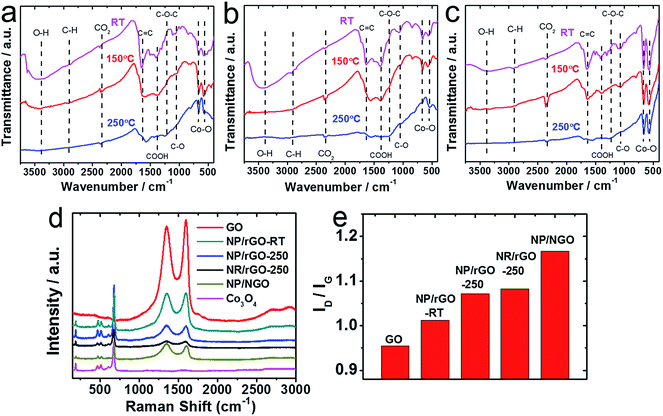
In this section, the formations of rGO/NGO and Co3O4 in the aforementioned HNC samples along with their interfaces are further investigated by FTIR, Raman spectroscopy and XPS. The FTIR spectra of NP/rGO and NR/rGO at different heating temperatures are recorded in Fig. 5a and b respectively. Both as-synthesized samples (RT case) exhibit a broad peak at ∼3400 cm−1 that correspond to the O–H stretching vibration, along with several sharp peaks located at 1650 cm−1, 1391 cm−1 1250 cm−1, 1060 cm−1 representing C![[double bond, length as m-dash]](https://www.rsc.org/images/entities/char_e001.gif) C, COOH, C–O–C and C–O bonding respectively.36,50,77 The last two peaks located at lower wavenumbers, i.e., 665 and 570 cm−1 are assigned to the stretching vibration of Co3+–O and Co2+–O bonds.36,50,77 Upon heating (150 °C and 250 °C cases), the O–H, COOH and C–O peaks disappear, while the C
C, COOH, C–O–C and C–O bonding respectively.36,50,77 The last two peaks located at lower wavenumbers, i.e., 665 and 570 cm−1 are assigned to the stretching vibration of Co3+–O and Co2+–O bonds.36,50,77 Upon heating (150 °C and 250 °C cases), the O–H, COOH and C–O peaks disappear, while the C![[double bond, length as m-dash]](https://www.rsc.org/images/entities/char_e001.gif) C peak is found to shift to a lower wavenumber of ∼1610 cm−1, and a small C–O–C peak starts to emerge at 1060 cm−1. Such observations indicate and confirm the thermal reduction of GO. The Co–O peaks, however, indicate a successive reduction of the 665 and 570 cm−1 stretching peaks along with the formation of a tail at ∼500 cm−1 after the heating, which is possibly due to the solid phase reaction between Co/CoO and GO that forms a more complex structure. For the sake of comparison, another set of HNC sample was prepared by carrying out LASiS on Co in water first, followed by heating the solution overnight until CoOx gets fully oxidized into Co3O4, and then physically mixing it with GO at the same Co3O4
C peak is found to shift to a lower wavenumber of ∼1610 cm−1, and a small C–O–C peak starts to emerge at 1060 cm−1. Such observations indicate and confirm the thermal reduction of GO. The Co–O peaks, however, indicate a successive reduction of the 665 and 570 cm−1 stretching peaks along with the formation of a tail at ∼500 cm−1 after the heating, which is possibly due to the solid phase reaction between Co/CoO and GO that forms a more complex structure. For the sake of comparison, another set of HNC sample was prepared by carrying out LASiS on Co in water first, followed by heating the solution overnight until CoOx gets fully oxidized into Co3O4, and then physically mixing it with GO at the same Co3O4![[thin space (1/6-em)]](https://www.rsc.org/images/entities/char_2009.gif) :
:![[thin space (1/6-em)]](https://www.rsc.org/images/entities/char_2009.gif) GO weight ratio as the NP/rGO sample (3
GO weight ratio as the NP/rGO sample (3![[thin space (1/6-em)]](https://www.rsc.org/images/entities/char_2009.gif) :
:![[thin space (1/6-em)]](https://www.rsc.org/images/entities/char_2009.gif) 1). With this technique, no chemical reaction occurs between Co3O4 and GO. The FTIR result for this sample is shown in Fig. 5c. Clearly, much stronger peaks for the Co–O bonding is seen with no tail after heating, suggesting that the Co3O4 NPs are only physically absorbed onto GO. This confirms our earlier hypothesis regarding the possible reactions between Co/CoO and GO during both the LASiS step and the subsequent vacuum heating that result in the formation of more complex Co–rGO structures exhibiting lower intensities for the Co–O stretching. The Raman spectra in Fig. 5d for all the Co3O4-containing HNC samples detect the four distinct peaks at 677, 517, 470 and 193 cm−1 that correspond to the A1g and F2g modes of Co3O4.39,78,79 Alternately, all the GO-containing HNC samples exhibit two broad peaks at 1351 and 1604 cm−1 that are assigned to the carbon D band and G band vibrations for GO. Specifically, the D peak is related to the mode of the k-point phonons of A1g symmetry while the G peak corresponds to the E2g phonon of Csp2 atoms.36,38,50 The D/G intensity ratios (ID/IG) for all the HNC samples were calculated and summarized in Fig. 5e, where a high value indicates better exfoliation,39 more disorder/defects,80 and reduced oxygenated functional groups.50 It is clearly seen that both thermal reduction and N-doping effectively increases the ID/IG, with the NP/NGO sample showing the highest value of 1.16. The reduction of GO is further characterized by the XPS results shown in Fig. 6b, e and h, where the C–O characteristic peak obtained from C 1s fitting is found to significantly decrease after N-doping/heating. Meanwhile, the survey spectrum for NP/NGO (Fig. 6d) reveals a distinctive N 1s peak at 400 eV in comparison to NP/GO (Fig. 6a), confirming the effective N doping for this sample. The doped N atoms are further found to mostly exist in pyrrolic or pyridinic forms,81 as shown in Fig. 6g. Finally, the Co 2p peaks (Fig. 6c, f and i) indicate the coexistence of Co2+ and Co3+ oxidation state, confirming the formation of Co3O4 for all the NP samples, with NP/rGO showing a relatively higher Co3O4 ratio which can be attributed to the high temperature heating process.
1). With this technique, no chemical reaction occurs between Co3O4 and GO. The FTIR result for this sample is shown in Fig. 5c. Clearly, much stronger peaks for the Co–O bonding is seen with no tail after heating, suggesting that the Co3O4 NPs are only physically absorbed onto GO. This confirms our earlier hypothesis regarding the possible reactions between Co/CoO and GO during both the LASiS step and the subsequent vacuum heating that result in the formation of more complex Co–rGO structures exhibiting lower intensities for the Co–O stretching. The Raman spectra in Fig. 5d for all the Co3O4-containing HNC samples detect the four distinct peaks at 677, 517, 470 and 193 cm−1 that correspond to the A1g and F2g modes of Co3O4.39,78,79 Alternately, all the GO-containing HNC samples exhibit two broad peaks at 1351 and 1604 cm−1 that are assigned to the carbon D band and G band vibrations for GO. Specifically, the D peak is related to the mode of the k-point phonons of A1g symmetry while the G peak corresponds to the E2g phonon of Csp2 atoms.36,38,50 The D/G intensity ratios (ID/IG) for all the HNC samples were calculated and summarized in Fig. 5e, where a high value indicates better exfoliation,39 more disorder/defects,80 and reduced oxygenated functional groups.50 It is clearly seen that both thermal reduction and N-doping effectively increases the ID/IG, with the NP/NGO sample showing the highest value of 1.16. The reduction of GO is further characterized by the XPS results shown in Fig. 6b, e and h, where the C–O characteristic peak obtained from C 1s fitting is found to significantly decrease after N-doping/heating. Meanwhile, the survey spectrum for NP/NGO (Fig. 6d) reveals a distinctive N 1s peak at 400 eV in comparison to NP/GO (Fig. 6a), confirming the effective N doping for this sample. The doped N atoms are further found to mostly exist in pyrrolic or pyridinic forms,81 as shown in Fig. 6g. Finally, the Co 2p peaks (Fig. 6c, f and i) indicate the coexistence of Co2+ and Co3+ oxidation state, confirming the formation of Co3O4 for all the NP samples, with NP/rGO showing a relatively higher Co3O4 ratio which can be attributed to the high temperature heating process.
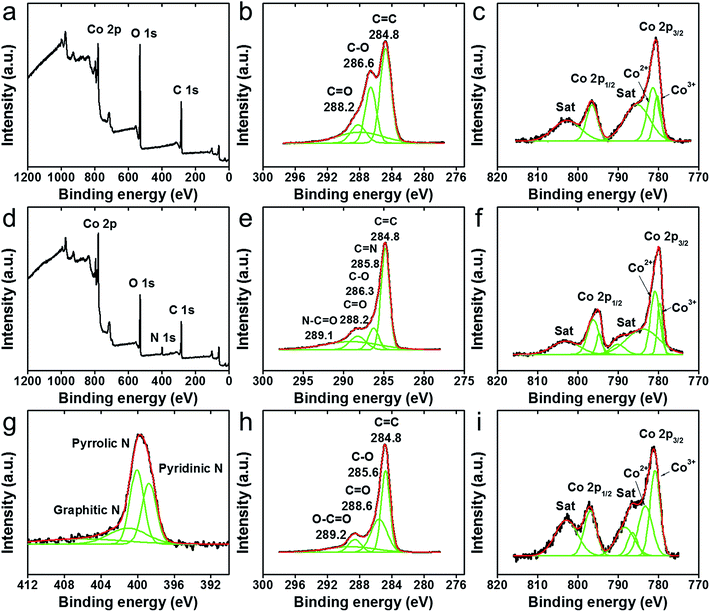 | ||
| Fig. 6 XPS results indicating the survey spectra (a and d), C 1s (b, e and h), Co 2p (c, f and i) and N 1s (g) for: NP/GO (a–c), NP/NGO (d–g) and NP/rGO (h and i). | ||
Functional characterizations
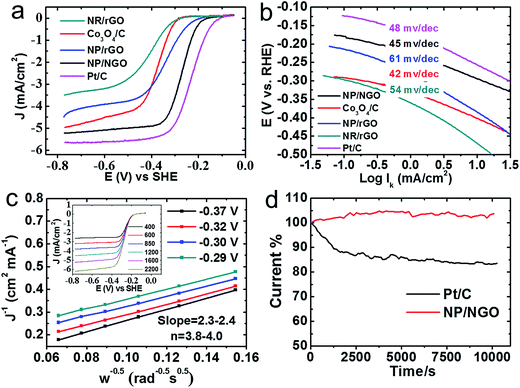
Two types of electrochemical properties, namely, ORR electrocatalytic activity and supercapacitive property are evaluated and compared for the as-synthesized HNCs. The ORR polarization curves in Fig. 7a indicates that the NP/NGO HNC exhibits the best ORR activity among all the samples in terms of the onset potential and diffusion-limited current, followed by the NP/rGO, Co3O4/C, and NR/rGO samples. Specifically, the onset potential and diffusion-limited current for NP/NGO HNCs (−0.15 V vs. SHE, and −5 mA cm−2 respectively) are very close to the corresponding values for commercial Pt/C ORR catalysts (−0.08 V vs. SHE, and −5.6 mA cm−2). Furthermore, the Tafel plots in Fig. 7b for the kinetic-diffusion region of the ORR polarization curves indicate the Tafel slope for NP/NGO samples (∼45 mV dec−1) to be even lower than that for Pt/C (48 mV dec−1) samples. This suggests a faster charge transfer rate for the ORR kinetics of the NP/NGO HNC samples. Typical Koutecky–Levich plots extracted from rotating disk voltammogram at different rotation speeds, as shown in Fig. 7c and the inset enable quantification of electron transfer numbers for the ORR catalysis by the NP/NGO HNCs. The results clearly indicate a near four electron transport process in the mixed kinetic-diffusion region with the potential ranging from −0.29 V to −0.37 V. Finally, the NP/NGO HNC electrocatalyst is also found to be more stable than the Pt/C. As shown in Fig. 7d, the chronoamperometry test run for 10![[thin space (1/6-em)]](https://www.rsc.org/images/entities/char_2009.gif) 000 s at −0.25 V indicates negligible changes in the current density for the NP/NGO samples, whereas the standard Pt/C samples see a dramatic decline by ∼16% from the starting point value. The superior ORR activity for NP/NGO can be attributed to the N-doping process that endows NGO with ultrahigh electron mobility along with less agglomerated Co3O4 NPs that are devoid of any interfacial contaminants from surfactants/ligand, thereby providing a larger electroactive surface area.
000 s at −0.25 V indicates negligible changes in the current density for the NP/NGO samples, whereas the standard Pt/C samples see a dramatic decline by ∼16% from the starting point value. The superior ORR activity for NP/NGO can be attributed to the N-doping process that endows NGO with ultrahigh electron mobility along with less agglomerated Co3O4 NPs that are devoid of any interfacial contaminants from surfactants/ligand, thereby providing a larger electroactive surface area.
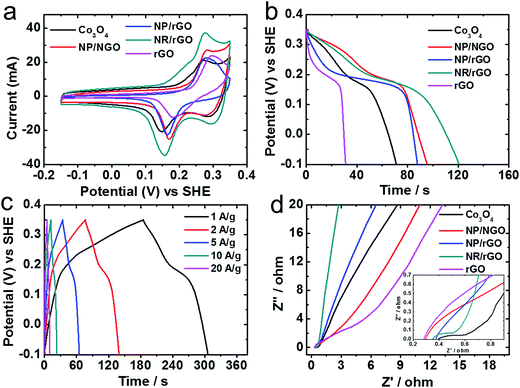
The supercapacitor performance for the synthesized HNCs is shown in Fig. 8. The two redox peaks located at the midpoint potentials of ∼0.15 and ∼0.28 V on the CV curves (Fig. 8a) correspond to the following two faradaic reactions for Co3O4:
| Co3O4 + H2O + OH− ⇔ 3CoOOH + e− |
| CoOOH + OH− ⇔ CoO2 + H2O + e− |
Fig. 8b reveals the discharge curves at 1 A g−1 from −0.1 to 0.35 V for various samples under study. All HNCs exhibit longer discharge time, i.e., better capacitive performance than both pure Co3O4 (159 F g−1) and rGO (68.4 F g−1), with NR/rGO showing the largest capacitance of 269 F g−1 that is comparable with values reported in other literatures for similar NP/rGO systems,18,40,82,83 followed by NP/NGO (213 F g−1) and NP/rGO (196 F g−1). Fig. 8c illustrates the complete charge–discharge curves for NR/rGO at different scan rates. The curves are found to be symmetrical which exhibit the typical characteristics for an ideal supercapacitor. Finally, the electrode–electrolyte interface properties were characterized via EIS measurements (see Experimental section) with the resultant Nyquist plots shown in Fig. 8d and the corresponding equivalent circuit illustrated in Fig. S9 in ESI.† At the high-frequency region, the intercept at real part (Z′) denotes the intrinsic resistance of the electrode, electrolyte as well as their contact resistance (Re).38,40 Pure Co3O4 is found to exhibit the largest Re among all the samples, thereby impairing its specific capacitance. Rct stands for charge-transfer resistance, which is affected by the aforementioned faradaic reactions. NR/rGO exhibits the lowest Rct of 0.37 Ω, followed by Co3O4 (0.52 Ω), NP/rGO (0.87 Ω), NP/NGO (1.43 Ω), and rGO (4.31 Ω). The linear part of the low-frequency region of the Nyquist plot corresponds to the Warburg impedance, which represents the diffusion of electrolyte to the electrode materials. NR/rGO exhibits the most vertical slope, indicating the best electrolyte diffusion efficiency.38,40 Thus, the better supercapacitive properties for NR/rGO, when compared to the other samples studied here, can be possibly ascribed to its interconnecting nanostructures comprising both NRs and NPs that lower the charge-transfer resistance and meanwhile promote the electrolyte diffusion rate at the interface. Qualitatively, it can be deduced from Fig. 8d that although NP/NGO shows the smallest Re among all HNCs that promotes the charge transfer for ORR catalysis, the larger Rct hinders their capacitive capabilities. This is probably due to the relatively poorer coverage of Co3O4 NPs on NGO, resulting in more NGO exposing to the surface, as demonstrated earlier in the TEM images in Fig. 3. In comparison, NP/rGO shows the expected intermediate activities for both ORR and supercapacitance.
Synthesis–structure relations: a discussion
Finally, we summarize the formation mechanism for the three types of HNCs under different LASiS conditions as depicted in Fig. 9. In general, laser ablation on the CO target induces the formation of a plasma containing Co species which nucleates within the propagating cavitation bubble. Once the bubble collapses, the seeding Co NPs go through ultrasonic quenching at the liquid–bubble interface and meanwhile react with both water and GO flakes. This results in the formation of cobalt oxides embedded in rGO due to the primary reduction reactions at the bubble–liquid interface. The embedding process could be both chemically and charge driven, as demonstrated earlier in the FTIR and Raman results. The initial metal oxide products from LASiS in the alkaline condition (pH13) involve a mixture of CoO NPs, Co3O4 NRs and Co(OH)2 hexagonal NPs, which further transform into interconnecting nanostructures comprising Co3O4 NPs and NRs upon thermal heating, and are responsible for the enhanced supercapacitive properties. On the contrary, at pH7 conditions, only CoO NPs are initially formed that are found to transfer into Co3O4 NPs upon heating. These Co3O4 NPs exhibit more uniform distribution on rGO than when formed via N-doping, albeit with a higher degree of agglomeration. The N-doping process endows the NGO with a higher conductivity, while partially reshaping the metastable CoO NPs into Co3O4 nanocubes with less agglomeration that is believed to eventually benefit their ORR catalytic activities.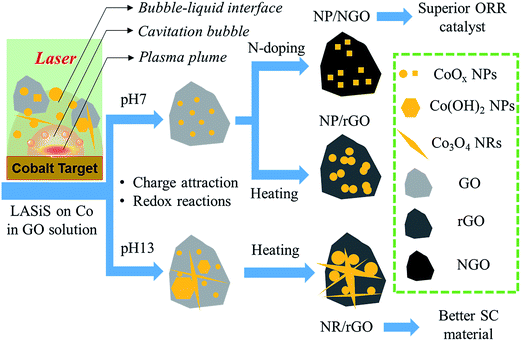 | ||
| Fig. 9 Schematic diagram summarizing the formation of the three types of Co–GO HNCs under different synthesis conditions. | ||
Conclusions
In summary, three types of 0D-2D interfaced HNCs, namely, NP/rGO, NR/rGO and NP/NGO were manufactured via laser ablation synthesis in solution (LASiS) in tandem with two different post-treatments. The synthesized HNC samples were systematically characterized for their selective applications as ORR catalysts and/or supercapacitive materials. Detailed structural and interfacial characterizations reveal the embedment of the nanomaterials into GO to be both chemically and charge driven. Functional characterizations indicate that the NP/NGO HNC samples exhibit the best ORR activity that is comparable to the commercial Pt/C. This is ascribed to the higher electron mobility and conductivity arising from the N-doped GO (NGO) matrix along with the dispersion of isolated Co3O4 NPs devoid of any interfacial surfactants/ligands that provide enhanced electroactive surface areas. On the other hand, the NR/rGO samples indicate the highest supercapacitive activities resulting from interpenetrating nanostructures in the rGO matrix that benefit both charge transfer and electrolyte diffusion at the electrode interface. Finally, as expected from the aforementioned observations, the NP/rGO samples display mediocre bi-functional activities for both the applications. The ability to tune selective bi-functionalities in such tailored HNCs provide future pathways for the rational design of efficient fuel cell and/or battery electrodes from 0D–2D interfaced nanomaterials.Acknowledgements
We acknowledge the financial support and funding for S. Hu (Postdoc research associate) through Sustainable Energy Education and Research Center (SEERC), UTK; and E. L. Ribeiro through CAPES (Coordination for the Improvement of Higher Education-Personnel) sponsored by the Brazilian Ministry of Higher Education. We also acknowledge the NSF MRI grant (Number 092312) for support of the Advanced Photoelectron Spectrometer.References
- Q. Y. Liao, N. Li, S. X. Jin, G. W. Yang and C. X. Wang, ACS Nano, 2015, 9, 5310–5317 CrossRef CAS PubMed.
- S. Hu, O. Dyck, H. Chen, Y.-c. Hsiao, B. Hu, G. Duscher, M. Dadmun and B. Khomami, RSC Adv., 2014, 4, 27931–27938 RSC.
- M. Zhi, C. Xiang, J. Li, M. Li and N. Wu, Nanoscale, 2013, 5, 72–88 RSC.
- H. Yan, J. Bai, J. Wang, X. Zhang, B. Wang, Q. Liu and L. Liu, CrystEngComm, 2013, 15, 10007–10015 RSC.
- S. P. Wu, R. Xu, M. J. Lu, R. Y. Ge, J. Iocozzia, C. P. Han, B. B. Jiang and Z. Q. Lin, Adv. Energy Mater., 2015, 5, 1500400 CrossRef.
- T. Odedairo, X. C. Yan, J. Ma, Y. L. Jiao, X. D. Yao, A. J. Du and Z. H. Zhu, ACS Appl. Mater. Interfaces, 2015, 7, 21373–21380 CAS.
- Z. J. Jiang and Z. Jiang, Sci. Rep., 2016, 6, 27081 CrossRef CAS PubMed.
- H. Tao, C. Yan, A. W. Robertson, Y. Gao, J. Ding, Y. Zhang, T. Ma and Z. Sun, Chem. Commun., 2017, 53, 873–876 RSC.
- A. Pendashteh, J. Palma, M. Anderson and R. Marcilla, Appl. Catal., B, 2017, 201, 241–252 CrossRef CAS.
- Y. Hou, Z. H. Wen, S. M. Cui, S. Q. Ci, S. Mao and J. H. Chen, Adv. Funct. Mater., 2015, 25, 872–882 CrossRef CAS.
- X. Zhou, X. Shen, Z. Xia, Z. Zhang, J. Li, Y. Ma and Y. Qu, ACS Appl. Mater. Interfaces, 2015, 7, 20322–20331 CAS.
- H. Ma, J. He, D. B. Xiong, J. Wu, Q. Li, V. Dravid and Y. Zhao, ACS Appl. Mater. Interfaces, 2016, 8, 1992–2000 CAS.
- X. Feng, J. Zhou, L. Wang, Y. Li, Z. Huang, S. Chen, Y. Ma, L. Wang and X. Yan, New J. Chem., 2015, 39, 4026–4034 RSC.
- J. Zhou, J. Song, H. Li, X. Feng, Z. Huang, S. Chen, Y. Ma, L. Wang and X. Yan, New J. Chem., 2015, 39, 8780–8786 RSC.
- Q. X. Feng, X. G. Li, J. Wang and A. M. Gaskov, Sens. Actuators, B, 2016, 222, 864–870 CrossRef CAS.
- Y. L. Zheng, P. Li, H. B. Li and S. H. Chen, Int. J. Electrochem. Sci., 2014, 9, 7369–7381 Search PubMed.
- Y. G. Liu, Z. Y. Cheng, H. Y. Sun, H. Arandiyan, J. P. Li and M. Ahmad, J. Power Sources, 2015, 273, 878–884 CrossRef CAS.
- L. Wang, D. L. Wang, J. S. Zhu and X. S. Liang, Ionics, 2013, 19, 215–220 CrossRef CAS.
- X. Y. Zhou, J. J. Shi, Y. Liu, Q. M. Su, J. Zhang and G. H. Du, Electrochim. Acta, 2014, 143, 175–179 CrossRef CAS.
- J. Zhang, Z. Dong, X. Wang, X. Zhao, J. Tu, Q. Su and G. Du, J. Power Sources, 2014, 270, 1–8 CrossRef CAS.
- X. L. Li, H. L. Wang, J. T. Robinson, H. Sanchez, G. Diankov and H. J. Dai, J. Am. Chem. Soc., 2009, 131, 15939–15944 CrossRef CAS PubMed.
- X. J. Cui, Y. H. Li, S. Bachmann, M. Scalone, A. E. Surkus, K. Junge, C. Topf and M. Beller, J. Am. Chem. Soc., 2015, 137, 10652–10658 CAS.
- K. Kumar, C. Canaff, J. Rousseau, S. Arrii-Clacens, T. W. Napporn, A. Habrioux and K. B. Kokoh, J. Phys. Chem. C, 2016, 120, 7949–7958 CAS.
- L. F. Lai, J. R. Potts, D. Zhan, L. Wang, C. K. Poh, C. H. Tang, H. Gong, Z. X. Shen, L. Y. Jianyi and R. S. Ruoff, Energy Environ. Sci., 2012, 5, 7936–7942 CAS.
- T. Liu, Y. F. Guo, Y. M. Yan, F. Wang, C. Deng, D. Rooney and K. N. Sun, Carbon, 2016, 106, 84–92 CrossRef CAS.
- T. T. Sun, L. B. Xu, S. Y. Li, W. X. Chai, Y. Huang, Y. S. Yan and J. F. Chen, Appl. Catal., B, 2016, 193, 1–8 CrossRef CAS.
- S. Peng, H. Jiang, Y. Zhang, L. Yang, S. Wang, W. Deng and Y. Tan, J. Mater. Chem. A, 2016, 4, 3678–3682 CAS.
- Q. Li, N. Mahmood, J. H. Zhu, Y. L. Hou and S. H. Sun, Nano Today, 2014, 9, 668–683 CrossRef CAS.
- H.-W. Wang, Z.-A. Hu, Y.-Q. Chang, Y.-L. Chen, Z.-Y. Zhang, Y.-Y. Yang and H.-Y. Wu, Mater. Chem. Phys., 2011, 130, 672–679 CrossRef CAS.
- J. M. Xu, J. S. Wu, L. L. Luo, X. Q. Chen, H. B. Qin, V. Dravid, S. B. Mi and C. L. Jia, J. Power Sources, 2015, 274, 816–822 CrossRef CAS.
- Q. Ke, Y. Liao, S. Yao, L. Song and X. Xiong, J. Mater. Sci., 2016, 51, 2008–2016 CrossRef CAS.
- J. L. Yang, J. J. Wang, Y. J. Tang, D. N. Wang, X. F. Li, Y. H. Hu, R. Y. Li, G. X. Liang, T. K. Sham and X. L. Sun, Energy Environ. Sci., 2013, 6, 1521–1528 CAS.
- V. H. Nguyen and J. J. Shim, Mater. Lett., 2015, 139, 377–381 CrossRef.
- Q. Su, J. Zhang, Y. Wu and G. Du, Nano Energy, 2014, 9, 264–272 CrossRef CAS.
- Y. Y. Liang, Y. G. Li, H. L. Wang, J. G. Zhou, J. Wang, T. Regier and H. J. Dai, Nat. Mater., 2011, 10, 780–786 CrossRef CAS PubMed.
- T. T. Nguyen, V. H. Nguyen, R. K. Deivasigamani, D. Kharismadewi, Y. Iwai and J. J. Shim, Solid State Sci., 2016, 53, 71–77 CrossRef CAS.
- G. Y. He, J. H. Li, H. Q. Chen, J. Shi, X. Q. Sun, S. Chen and X. Wang, Mater. Lett., 2012, 82, 61–63 CrossRef CAS.
- C. C. Xiang, M. Li, M. J. Zhi, A. Manivannan and N. Q. Wu, J. Power Sources, 2013, 226, 65–70 CrossRef CAS.
- B. Wang, Y. Wang, J. Park, H. Ahn and G. X. Wang, J. Alloys Compd., 2011, 509, 7778–7783 CrossRef CAS.
- Y. Q. Zou, I. A. Kinloch and R. A. W. Dryfe, ACS Appl. Mater. Interfaces, 2015, 7, 22831–22838 CAS.
- V. H. Nguyen and J.-J. Shim, J. Power Sources, 2015, 273, 110–117 CrossRef CAS.
- V. H. Nguyen, C. Lamiel and J.-J. Shim, Electrochim. Acta, 2015, 161, 351–357 CrossRef CAS.
- F. Bonaccorso, L. Colombo, G. Yu, M. Stoller, V. Tozzini, A. C. Ferrari, R. S. Ruoff and V. Pellegrini, Science, 2015, 347, 1246501 CrossRef PubMed.
- J. Ji, L. L. Zhang, H. Ji, Y. Li, X. Zhao, X. Bai, X. Fan, F. Zhang and R. S. Ruoff, ACS Nano, 2013, 7, 6237–6243 CrossRef CAS PubMed.
- G. He, L. Wang, H. Chen, X. Sun and X. Wang, Mater. Lett., 2013, 98, 164–167 CrossRef CAS.
- Q. Qiu, Y. Chen, J. Xue, J. Zhu, Y. Fu, G. He and H. Chen, Ceram. Int., 2017, 43, 2226–2232 CrossRef CAS.
- S. Faraji and F. N. Ani, J. Power Sources, 2014, 263, 338–360 CrossRef CAS.
- H. Wang and H. Dai, Chem. Soc. Rev., 2013, 42, 3088–3113 RSC.
- D. Liang, Z. Tian, J. Liu, Y. Ye, S. Wu, Y. Cai and C. Liang, Electrochim. Acta, 2015, 182, 376–382 CrossRef CAS.
- S. K. Ujjain, G. Singh and R. K. Sharma, Electrochim. Acta, 2015, 169, 276–282 CrossRef CAS.
- S. M. Choi, M. H. Seo, H. J. Kim and W. B. Kim, Synth. Met., 2011, 161, 2405–2411 CrossRef CAS.
- R. Pocklanova, A. K. Rathi, M. B. Gawande, K. K. R. Datta, V. Ranc, K. Cepe, M. Petr, R. S. Varma, L. Kvitek and R. Zboril, J. Mol. Catal. A: Chem., 2016, 424, 121–127 CrossRef CAS.
- S. Hu, C. Melton and D. Mukherjee, Phys. Chem. Chem. Phys., 2014, 16, 24034–24044 RSC.
- S. Hu, M. Tian, E. L. Ribeiro, G. Duscher and D. Mukherjee, J. Power Sources, 2016, 306, 413–423 CrossRef CAS.
- S. Hu, G. Goenaga, C. Melton, T. A. Zawodzinski and D. Mukherjee, Appl. Catal., B, 2016, 182, 286–296 CrossRef CAS.
- S. Hu, K. Cheng, E. L. Ribeiro, K. Park, B. Khomami and D. Mukherjee, Catal. Sci. Technol., 2017, 7, 2074–2086 CAS.
- R. Z. Li, R. Peng, K. D. Kihm, S. Bai, D. Bridges, U. Tumuluri, Z. Wu, T. Zhang, G. Compagnini, Z. Feng and A. Hu, Energy Environ. Sci., 2016, 9(4), 1458–1467 CAS.
- J. Lam, J. Lombard, C. Dujardin, G. Ledoux, S. Merabia and D. Amans, Appl. Phys. Lett., 2016, 108, 074104 CrossRef.
- A. Matsumoto, A. Tamura, T. Honda, T. Hirota, K. Kobayashi, S. Katakura, N. Nishi, K.-i. Amano, K. Fukami and T. Sakka, J. Phys. Chem. C, 2015, 119, 26506–26511 CAS.
- P. Liu, H. Cui, C. X. Wang and G. W. Yang, Phys. Chem. Chem. Phys., 2010, 12, 3942–3952 RSC.
- H. B. Zeng, X. W. Du, S. C. Singh, S. A. Kulinich, S. K. Yang, J. P. He and W. P. Cai, Adv. Funct. Mater., 2012, 22, 1333–1353 CrossRef CAS.
- E. Jiménez, K. Abderrafi, R. Abargues, J. L. Valdés and J. P. Martínez-Pastor, Langmuir, 2010, 26, 7458–7463 CrossRef PubMed.
- S. Scaramuzza, M. Zerbetto and V. Amendola, J. Phys. Chem. C, 2016, 120, 9453–9463 CAS.
- D. Zhang, B. Gökce and S. Barcikowski, Chem. Rev., 2017, 117(5), 3990–4103 CrossRef CAS PubMed.
- A. Letzel, B. Gökce, P. Wagener, S. Ibrahimkutty, A. Menzel, A. Plech and S. Barcikowski, J. Phys. Chem. C, 2017, 121(9), 5356–5365 CAS.
- A. De Giacomo, M. Dell'Aglio, A. Santagata, R. Gaudiuso, O. De Pascale, P. Wagener, G. C. Messina, G. Compagnini and S. Barcikowski, Phys. Chem. Chem. Phys., 2013, 15, 3083–3092 RSC.
- S. Scaramuzza, S. Agnoli and V. Amendola, Phys. Chem. Chem. Phys., 2015, 17(42), 28076–28087 RSC.
- M. E. Povarnitsyn, T. E. Itina, P. R. Levashov and K. V. Khishchenko, Phys. Chem. Chem. Phys., 2013, 15, 3108 RSC.
- V. Amendola and M. Meneghetti, Phys. Chem. Chem. Phys., 2013, 15, 3027–3046 RSC.
- N. G. Semaltianos, S. Logothetidis, N. Frangis, I. Tsiaoussis, W. Perrie, G. Dearden and K. G. Watkins, Chem. Phys. Lett., 2010, 496, 113–116 CrossRef CAS.
- D. C. Marcano, D. V. Kosynkin, J. M. Berlin, A. Sinitskii, Z. Sun, A. Slesarev, L. B. Alemany, W. Lu and J. M. Tour, ACS Nano, 2010, 4, 4806–4814 CrossRef CAS PubMed.
- S. A. Davari, S. Hu, E. L. Ribeiro and D. Mukherjee, MRS Adv., 2017, 1–6, DOI:10.1557/adv.2017.303.
- S. A. Davari, S. Hu and D. Mukherjee, Talanta, 2017, 164, 330–340 CrossRef CAS PubMed.
- S. A. Davari, S. Hu, R. Pamu and D. Mukherjee, J. Anal. At. Spectrom., 2017 10.1039/c7ja00083a.
- S. A. Davari, S. Masjedi, Z. Ferdous and D. Mukherjee, J. Biophotonics, 2017 DOI:10.1002/jbio.201600288.
- S. Roy, R. Bajpai, N. Koratkar and D. S. Misra, Carbon, 2015, 85, 406–413 CrossRef CAS.
- S. O. Huang, Y. H. Jin and M. Q. Jia, Electrochim. Acta, 2013, 95, 139–145 CrossRef CAS.
- X. L. Sun, Z. Q. Jiang, C. X. Li, Y. Y. Jiang, X. Y. Sun, X. N. Tian, L. J. Luo, X. G. Hao and Z. J. Jiang, J. Alloys Compd., 2016, 685, 507–517 CrossRef CAS.
- H. Kim, D. H. Seo, S. W. Kim, J. Kim and K. Kang, Carbon, 2011, 49, 326–332 CrossRef CAS.
- S. Saha, M. Jana, P. Samanta, N. C. Murmu, N. H. Kim, T. Kuila and J. H. Lee, RSC Adv., 2014, 4, 44777–44785 RSC.
- L. Tang, R. Ji, X. Li, K. S. Teng and S. P. Lau, J. Mater. Chem. C, 2013, 1, 4908 RSC.
- S. Maiti, A. Pramanik and S. Mahanty, CrystEngComm, 2016, 18, 450–461 RSC.
- Y. Zhang, C. Sun, P. Lu, K. Li, S. Song and D. Xue, CrystEngComm, 2012, 14, 5892–5897 RSC.
Footnotes |
| † Electronic supplementary information (ESI) available. See DOI: 10.1039/c7ra05494g |
| ‡ Erick L. Ribeiro and Sheng Hu contributed equally to this paper. |
| This journal is © The Royal Society of Chemistry 2017 |


