 Open Access Article
Creative Commons Attribution 3.0 Unported Licence
Low-temperature molten-salt synthesis and upconversion of novel hexagonal NaBiF4:Er3+/Yb3+ micro-/nanocrystals
Xinyang Huang *,
Liang Jiang,
Qiuju Xu,
Xiaoxia Li and
Aiqun He
Institute of Research on the Functional Materials, Jiangxi University of Finance and Economy, Nanchang, Jiangxi 330013, PR China. E-mail: xyhang0202@hotmail.com; Fax: +86-791-83891364; Tel: +86-791-83891364
First published on 23rd August 2017
Abstract
A series of NaBiF4:Er3+/Yb3+ micro-/nanocrystals were synthesized via the low-temperature molten-salt method in NH4NO3 flux. The influences of the amount of NaF and NH4NO3 flux used, the reaction time and reaction temperature on the crystal phase structure, morphology and size of the resultant samples were systematically investigated. The morphology, size, doped concentrations of Er3+ and Yb3+, pumping power, and temperature dependences of UC emissions were studied in detail under 980 nm irradiation. The NaBiF4:3 mol% Er3+/20 mol% Yb3+ crystal exhibits the strongest green UC emission, which was observed under several mW 980 nm excitation at room temperature. The energy transfer between Bi3+ and Er3+ during UC emission process was also discussed at length.
1. Introduction
In the past decades, lanthanide-doped upconversion (UC) inorganic materials have evoked a tremendous amount of attention to the ongoing research. UC refers to a system sequentially absorbing two or more long-wavelength (low-energy) photons, combining their energies, and emitting one short-wavelength (high-energy) photon. Compared to semiconductor quantum dots, these UC materials exhibit some advantages of low toxicity, large Stokes shift, sharp emission band, high quantum yield, long lifetime, weak background luminescence, and good resistance to photo-bleaching, blinking and photochemical degradation.1–3 Owing to their outstanding properties, they have been proposed for diverse potential applications in photovoltaic,3–5 photocatalysis,4,5 sensor and biological labels.6–9Er3+, as being an excellent activated ion, can emit different wavelength photons ranging from ultraviolet (UV) through visible (red, blue, green) to near infrared (NIR) light. Unfortunately, Er3+ suffers from inferior absorption near 980 nm (compared with Yb3+), and low Er3+ doping concentration (in the range 0.2–2%) to avoid significant concentration-quenching.5–9 To enhance UC efficiency, a popular approach is adopted where a sensitizer with a reasonable cross section in NIR region is co-doped due to an efficient energy transfer between the two. Yb3+ has a relatively large absorption cross section (1.2 × 10⁻²⁰ cm2) compared with that of Er3+ (1.7 × 10⁻²¹ cm2) and broad absorption band matching with the emission wavelength of powerful commercial laser diodes, and its 2F5/2 excited state resonates well with the 4I11/2 excited state of Er3+, thus Yb3+ can significantly improve UC efficiency of Er3+.10–13
It is generally accepted that Bi3+ ions possess some inherent features of non-toxicity, low cost, and large rare-earth ion admittance. From the point of optical physics, Bi3+ ions have 6s2 electronic configuration (1S0 corresponds to the ground state, whereas 3P0, 3P1 and 3P2 are due to three excited states) and a broad absorption and emission band,14–16 which is usually used in downconversion and UC emission system to enhance luminescence.16–21 For example, the Bi3+ ion in hexagonal NaYF4 possesses a broad absorption near 300 nm and a emission band ranging from 400 to 500 nm.22 The introduction of the optimal Bi3+ can obviously enhance UC emission of hexagonal NaYF4:Er3+/Yb3+ materials.21 In addition, fluoride compounds possess a host lattice of low phonon energies (less than 350 cm−1) causing to decrease nonradiative relaxation and in turn to yield relatively strong UC emission, they have served as very efficient UC matrixes. For instance, NaREF4 (RE = Y, Gd and Lu) is one kind of the efficient NIR-vis UC host materials.23–27 Therefore, Bi3+-based fluorides can combine the advantages of both fluorides and Bi3+ ions, they are suggested to be novel UC materials with efficient luminescence and have been attracted more and more attention.28–31 As one member of Bi3+-based fluorides, NaBiF4 belongs to the hexagonal system with the space group P![[3 with combining macron]](https://www.rsc.org/images/entities/char_0033_0304.gif) and the unit cell parameters: a = 6.144 Å, c = 3.721 Å (ref. 32) and has the same structure as NaREF4,1–3 thereby, the addition of Er3+ and Yb3+ can not generate the crystal lattice distortion and exhibits the capacity of heavily rare-earth ion doping. The Yb3+/RE3+ (RE = Er, Tm, and Ho) doped hexagonal NaBiF4 nanocrystals has demonstrated to be one potential excellent UC material.31
and the unit cell parameters: a = 6.144 Å, c = 3.721 Å (ref. 32) and has the same structure as NaREF4,1–3 thereby, the addition of Er3+ and Yb3+ can not generate the crystal lattice distortion and exhibits the capacity of heavily rare-earth ion doping. The Yb3+/RE3+ (RE = Er, Tm, and Ho) doped hexagonal NaBiF4 nanocrystals has demonstrated to be one potential excellent UC material.31
In past several decades, rare-earth doped NaREF4 materials with high dispersability were synthesized in organic solvents by hydro(solvo)thermal methods.1–11,33–35 In contrast with the above methods, the most advantage of low-temperature molten-salt method is an economical mass, convenient, effective, facile and environmental friendly approach. And it is very easy to obtain the materials with clean surface, chemical purification, and few residual impurities below the melting point of the as-grown crystals. Ammonium nitrate (NH4NO3) exhibits some inherent advantages, including abundance in nature, low melting point, and easy deliquescence in water/alcohol causing to easily separate from the flux and the target compound. Thus, this synthetic route has been has been adopted to fabricate hexagonal NaYF4:Er3+/Yb3+,36 tetragonal LiYF4:Er3+/Yb3+,37 cubic BaGdF5:Ce3+/Er3+/Yb3+ (ref. 38) and monazite LaPO4:Eu3+.39 Recently, the Yb3+/RE3+ (RE = Er, Tm, and Ho) doped hexagonal NaBiF4 nanocrystals have been fabricated in ethylene glycol at room temperature.31 Unfortunately, the degree of the crystalline and their UC emissions need to be further improved. Therefore, here, hexagonal NaBiF4:Er3+/Yb3+ (h-NaBiF4:Er3+/Yb3+) micro-/nanocrystals will be prepared by the low-temperature molten-salt synthesis in NH4NO3 flux. In this synthetic route, the phase structure, shape and size of the samples could be highly determined by the intrinsic structure of target compound and the growth surroundings (such as the reaction temperature, the reaction time, and the usage amounts of raw materials and flux). To obtain high-quality NaBiF4:Er3+/Yb3+ micro-/nano-crystals, it is very necessary to fastidiously control these parameters. Herein, we will mainly concentrate upon the influence of the usage amount of reaction materials NaF and flux NH4NO3, the reaction temperature and the reaction time on the chemical composition, the morphology and size of the resultant products. On this basis, the corresponding UC properties will be investigated and discussed in detail. Finally, the UC emission dynamics of h-NaBiF4:Er3+/Yb3+ will be studied by the pumping power, and temperature dependences of UC emissions and fluorescence decays.
2. Experimental
2.1 Material preparation
NaBiF4:Er3+/Yb3+ samples were synthesized by the low temperature molten-salt method in NH4NO3 flux. Reagent-grade NaF, NH4NO3, Bi(NO3)3·5H2O, Yb(NO3)3·5H2O and Er(NO3)3·5H2O powders were used to synthesize hexagonal Er3+/Yb3+-codoped NaBiF4 crystals. All the reagent-grade powders and NH4NO3 with different usage amounts were mixed well. The mixtures were put into 15 ml capacity crucibles. After the lids were tightly closed, the crucibles were placed in an oven. The sealed tank was heated to different reaction temperature (160, 175, 210 and 250 °C), and held for different hours (0.5, 1, 2, 4, 8, 12 and 24 h) in an oven, and then cooled to room temperature naturally. The detailed experimental parameters including the reaction temperature, reaction time, the doping concentration of Er3+ and Yb3+, the NaF usage amount and the usage amount of NH4NO3 flux were listed in Table 1. After being washed several times with deionized water and ethanol, the precipitates were dried at 70 °C for 12 hours in vacuum.| Sample | NaF/Ln molar ratio | NH4NO3/Ln molar ratio | Reaction temperature (°C) | Reaction time (h) | Crystal phase |
|---|---|---|---|---|---|
| S1 | 3 | 5 | 250 | 24 | c-BiF3 + t-BiOF |
| S2 | 4 | 5 | 250 | 24 | |
| S3 | 5 | 5 | 250 | 24 | h-NaBiF4 |
| S4 | 6 | 5 | 250 | 24 | h-NaBiF4 |
| S5 | 8 | 5 | 250 | 24 | h-NaBiF4 |
| S6 | 5 | 8 | 250 | 24 | h-NaBiF4 |
| S7 | 5 | 10 | 250 | 24 | h-NaBiF4 |
| S9 | 6 | 8 | 250 | 24 | h-NaBiF4 |
| S10 | 6 | 10 | 250 | 24 | h-NaBiF4 |
| S11 | 8 | 8 | 250 | 24 | h-NaBiF4 |
| S12 | 8 | 10 | 250 | 24 | h-NaBiF4 |
| S13 | 5 | 5 | 210 | 24 | h-NaBiF4 |
| S14 | 5 | 5 | 180 | 24 | h-NaBiF4 + c-BiF3 + t-BiOF |
| S15 | 5 | 5 | 160 | 24 | m-NH4BiF4 + c-BiF3 + t-BiOF |
| S16 | 3 | 5 | 250 | 12 | h-NaBiF4 |
| S17 | 3 | 5 | 250 | 8 | h-NaBiF4 |
| S18 | 3 | 5 | 250 | 4 | h-NaBiF4 |
| S19 | 3 | 5 | 250 | 2 | h-NaBiF4 |
| S20 | 3 | 5 | 250 | 1 | h-NaBiF4 t-BiOF |
| S21 | 3 | 5 | 250 | 0.5 | h-NaBiF4 t-BiOF |
2.2 Material characterization
The samples were examined by X-ray diffraction (XRD), transmission electron microscopy (TEM), energy-dispersive X-ray spectroscopy (EDS) and photoluminescence (PL). XRD analyses were carried out on a Bruker D8-Advance diffractometer with graphite-monochromatized Cu Kα radiation (40 kV/60 mA, graphite monochromator, λ = 0.1541 nm). The size, morphology and chemical compositions of products were determined by a transmission electron microscopy (TEM, JEOL2010) operating at 200 kV and a JSM 6700F scanning electron microscope (SEM) equipped with the energy dispersive X-ray spectrum (EDS). Structural information of the nanocrystals was measured by a high-resolution transmission electron microscopy (HRTEM).Downconversion (DC) luminescence spectra were performed using an Edinburgh Instruments FLS920 fluorescence spectrometer equipped with both continuous (450 W) and pulsed xenon lamps. UC emission spectra were carried out upon 976 nm excitation with a pump power of ∼200 mW (power density ∼ 20 W cm−2), provided by a mode-locked picosecond Ti:sapphire laser (700–1000 nm, pulse width ≤ 1.5 ps, Tsunami, Spectra-Physics). The measurements were repeated in an integrating sphere in order to reduce the effect of the scattering on the UC properties. Power-dependence of UC emissions of Er3+ was studied upon excitation by a power-controllable 976 nm diode laser (DPL-II, Module HTL98M10) with two emission monochromators to record the emission spectra in the wavelength range of 200–850 nm (with a Hamamatsu R928 photomultiplier tube). Its maximum power output is 5 W. To eliminate the noise from tunable Ti:sapphire laser, 980 nm LD, and both continuous (450 W) and pulsed xenon lamps, different filters were kept in front of the detector. The emission monochromator's slits were set as small as possible to maximize the instrumental resolution. The best wavelength resolution was 0.05 nm. The line intensities and positions of the measured spectra were calibrated according to the FLS920 correction curve and standard mercury lamp. All the spectra were measured at room temperature and under identical conditions for each serial test. Luminescence decays were recorded using a customized UV to mid-infrared steady-state and phosphorescence lifetime spectrometer (FSP920-C, Edinburgh) equipped with a digital oscilloscope (TDS3052B, Tektronix) and a tunable mid-band OPO pulse laser as the excitation source (410–2400 nm, 10 Hz, pulse width ≤ 5 ns, Vibrant 355II, OPOTEK). For the low-temperature measurements, the samples were mounted on a closed-cycle cryostat (10–350 K, DE202, Advanced Research Systems).
3. Results and discussion
3.1 Phase structure
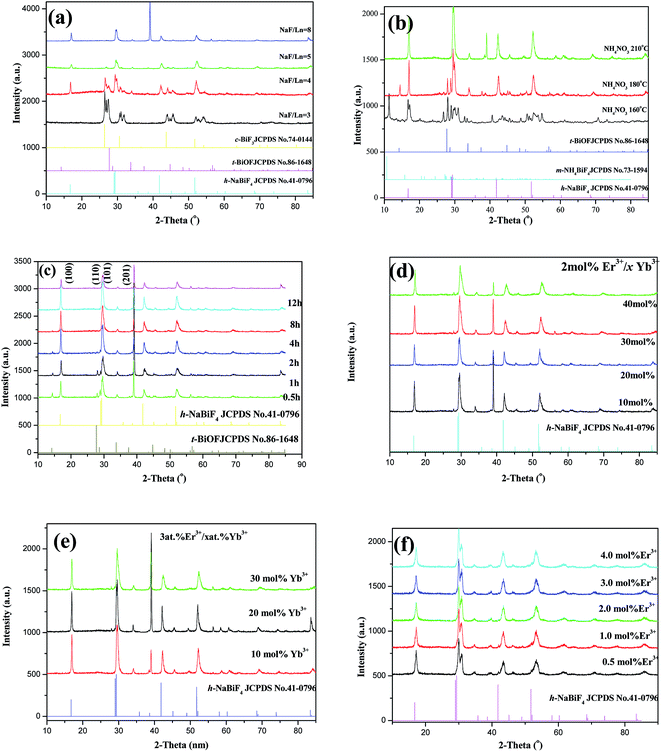
When the molar ratio of NaF to Ln(NO3)3 (hereinafter to be referred as NaF/Ln) was 3, the resultant product consists of cubic BiF3 (c-BiF3) (JCPDS no. 74-0144) and tetragonal BiOF (t-BiOF) (JCPDS no. 86-1478) (Fig. 1a) and the XRD peaks due to hexagonal NaBiF4 (h-NaBiF4) (JCPDS no. 041-0796) were not observed. When the NaF/Ln molar ratio increased to 4, h-NaBiF4 phase appeared and played a predominant role (Fig. 1a), and yet a small quantity of c-BiF3 could be still detected. As the NaF/Ln molar ratio increased to 5, the diffraction peaks due to c-BiF3 disappeared and those due to t-BiOF continued to weaken. The further increasing NaF/Ln molar ratio to 8, the diffraction peaks due to the t-BiOF vanished, all the diffraction peaks were in good agreement with those of pure h-NaBiF4 and no trace of characteristic peaks for other impurity phases was observed, implying that the samples obtained have the same crystallographic structure as pure h-NaBiF4 crystal. Thus, the h-NaBiF4 can be synthesized at NaF/Ln molar ratio above 5, and the NH4NO3 molten solution system can be developed to prepare the h-NaBiF4 materials.From Fig. 1b, it can be seen that the variance of the reaction temperature also highly affects the phase structure of the products. For the sample obtained at 210 and 250 °C for 12 hours, only h-NaBiF4 (JCPDS no. 041-0796) was obtained. When the reaction temperature decreased to 175 °C, the t-BiOF and monoclinic NH4BiF4 (m-NH4BiF4) (JCPDS no. 041-0796) were formed. With the reaction temperature further decreasing to 160 °C, the m-NH4BiF4 became more and more and played a predominant role while the amount of h-NaBiF4 significantly decreased. As is known, the thermodynamic growth regime is highly dependent upon a sufficient supply of thermal energy, and the crystal with the most stable structure preferential grows.40 Since h-NaBiF4 is thermodynamically more stable than m-NH4BiF4 and t-BiOF, m-NH4BiF4 and t-BiOF are susceptible to transform to h-NaBiF4. The energy barrier hinders the formation of the h-NaBiF4, a sufficient supply of thermal energy must be required to surmount this energy barrier to adjust the environment of Bi3+ (Er3+ and Yb3+) and Na+ occupation sites.41 Therefore in this thermal system m-NH4BiF4 and t-BiOF can be formed at low temperature, relatively high reaction temperature is more favorable for this transformation (m-NH4BiF4 → NaBiF4 and t-BiOF → h-NaBiF4) in the molten salt process and the pure h-NaBiF4 crystals can be synthesized at the reaction temperature of 210 °C and above.
To study the impact of the reaction time on the phase structure and the growth mechanism, the XRD patterns of the products prepared for different reaction times of 0.5, 1, 2, 4, 8, 12 and 24 h, as shown in Fig. 1c, indicates that the crystal phase of the samples is strongly dependent on the reaction time. When the reaction time was 0.5 h, a great amount of h-NaBiF4 and a small amount of t-BiOF were also observed and m-NH4BiF4 (JCPDS no. 041-0796) was hardly detected. The t-BiOF became less and less with the elongation of the reaction time from 0.5 hour to 4 hours and disappeared as the reaction time extended to 8 and 12 hours. It is demonstrated that the longer reaction time is also beneficial to transform from t-BiOF to h-NaBiF4 and the pure h-NaBiF4 crystals can be also obtained when the reaction time exceeds 8 h. Moreover, in comparison to (101) and (201) XRD peaks owing to he hexagonal NaBiF4, the (110) and (110) XRD peaks becomes stronger with the extension of the reaction time, implying that the [0001] direction is the preferred direction of crystal growth.
XRD patterns of the products with different concentrations of Er3+ or Yb3+ for 24 hours are shown in Fig. 1d, e and f with h-NaBiF4 standard card (no. 41-0796). All the XRD peaks are in good agreement with those of the h-NaBiF4, showing that all the products have the same crystal structure as pure h-NaBiF4. Because of the replacement of Bi3+ with smaller Er3+ and Yb3+ ions in the host lattice, the diffraction peaks shift slightly to higher angle side as a result of the shrinkage of the unit-cell volume.
3.2 Morphology
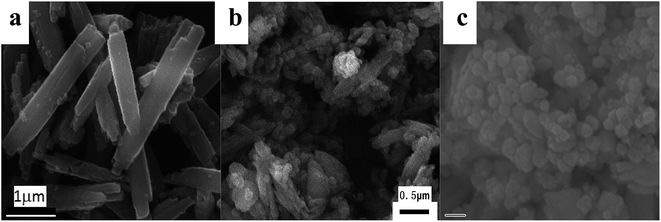
Fig. 2–5 illustrate some representative SEM images of h-NaBiF4:Er3+/Yb3+ prepared under different reaction conditions, as listed in Table 1. When the molar ratio of NaF/Ln was 3.0, the corresponding sample is composed of a large number of tiny nanoparticles attached to the surface of large polyhedral particles with size of ca. 0.6 μm. The product prepared at the NaF/Ln molar ratio of 4 mainly consists of many prismatic microrods with 4–5 μm in length and ca. 0.8 μm in diameter. Their lateral surfaces (Fig. 2a and 3a) are covered with a layer of minute irregular nanoparticles while their end planes are coarse, concave and irregular. When the molar ratio of NaF/Ln was increased to 5.0, the product maintains rod-like morphology and becomes even uniform. Their sizes and end planes keep nearly unchanged, whereas their lateral surfaces become relatively smooth and have some fine slit along the rods. With the increasing NaF/Ln molar ratio to 6.0, the morphology of the product still exhibits prismatic microrods, whenas their length and diameter slightly decrease to 3–4 μm and ca. 0.8 μm, respectively. Some small holes appear on their surfaces. Further increasing NaF/Ln molar ratio to 8.0 deduces the prisms incomplete and their length and diameter are 3–5 μm and 0.6 μm, respectively. There are a great number of relatively large holes on their side surfaces of these prisms.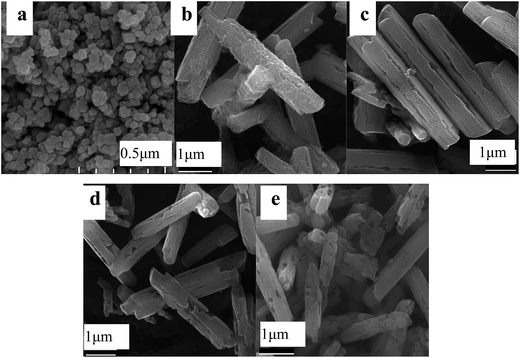 | ||
| Fig. 2 Representative SEM images of the as-obtained products at 250 °C for 24 hours with the NH4NO3/Ln molar ratio of 5, and different NaF/Ln molar ratios of 3 (a), 4 (b), 5 (c), 6 (d) and 8 (e). | ||
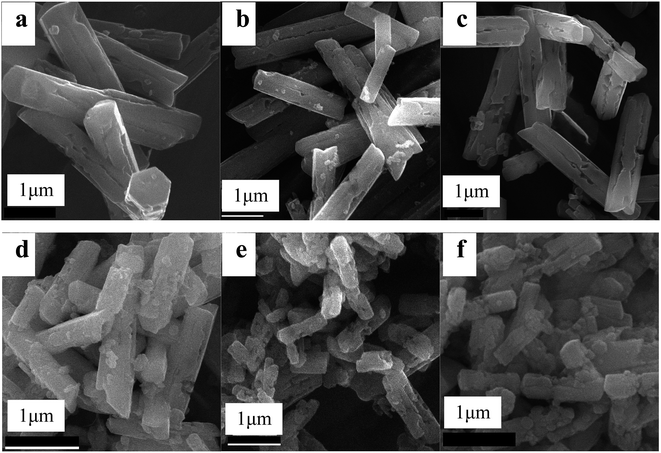 | ||
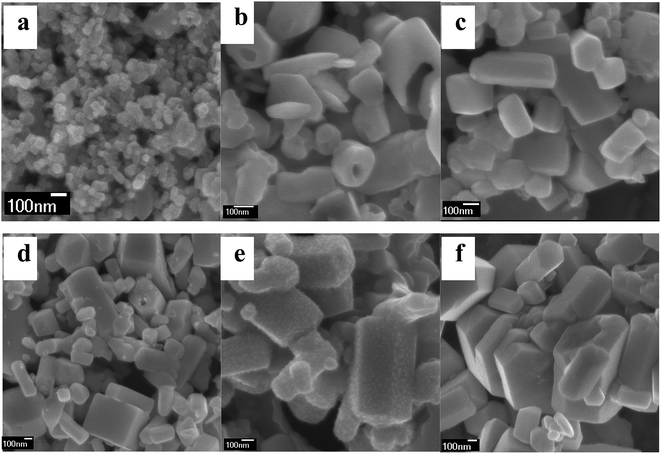
| Fig. 3 Representative SEM images of the as-obtained products at 210 °C for 24 hours with the NaF/NH4NO3/Ln molar ratio of 5/8/1 (a), 5/10/1 (b), 6/8/1 (c), 6/10/1 (d), 8/8/1 (e) and 8/10/1 (f). | ||
To study the impact of the variation of the amount of flux NH4NO3 upon the morphology and size of the products, the SEM images of the samples with different NH4NO3/Ln molar ratios were shown in Fig. 3. The NH4NO3 usage amount produces a great influence upon their sizes. When the NaF/Ln molar ratio was fixed to be 5 and 6, the molar ratio of NH4NO3/Ln increased to 8 and 10, the resultant products still maintain prism-like morphology. Meanwhile, their diameters also nearly stay at the same level (ca. 0.8 μm), and the mean lengths decrease to ca. 3.0 μm. For the NaF/Ln molar ratio of 8, the NH4NO3/Ln molar ratio enhances from 5 through 8 to 10, the diameters of these rods also keep almost invariable (ca. 0.5 μm), the lengths experience a significant downward from 3.0 μm through 2.0 μm to 1.0 μm. That is to say, the larger NH4NO3/Ln molar ratio is, the smaller the aspect ratio length/diameter becomes.
To elucidate the effect of the reaction temperature on the morphology the detailed temperature-dependent experiments were carried out under the similar reaction conditions. When the reaction temperature decreases from 250 °C to 210 °C, the corresponding sample takes on prismatic shape with the length of ca. 2.0–3.0 μm, the diameter of ca. 0.3–0.5 μm and irregular end planes (Fig. 4a). In comparison with S3, the length and diameter simultaneously have a downward trend. Further decreasing reaction temperature to 180 °C deduces the prismatic rods disappear, and some tiny nanoparticles aggregate together into the prismatic embryonic form (Fig. 4b). When the reaction temperature is 160 °C, the prismatic embryonic form vanish, a great number of tiny nanoparticles have come into being (Fig. 4c).
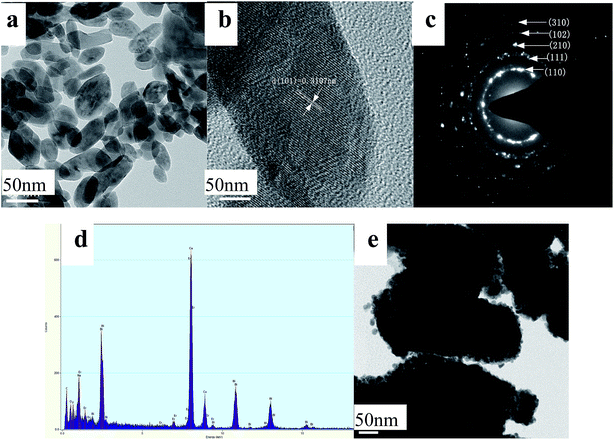
To shed light on the morphology evolution of h-NaBiF4 crystal, taking S3 as an example, the morphologies of the intermediates at different growth stages are shown in Fig. 5 and 6. The intermediates exhibit different morphologies at different reaction times. The reaction treatment for 0.5 hour leads to the formation of small hexagonal prisms with average sizes of 10–50 nm in length and 20–50 nm in diameter (Fig. 5a and 6a). The high-magnification TEM image indicates that the fringe distance (d-spacing) is 0.311 nm (Fig. 6b), corresponding to the distance between neighboring (110) planes of h-NaBiF4 (JCPDS no. 041-0796). The selected area electron diffraction (SAED) pattern, as shown in Fig. 6c, shows the diffraction rings corresponding to (110), (111), (210), (102) and (310) planes of h-NaBiF4. The compositional analysis by EDS pattern spectrum (as shown in Fig. 6d) reveals that the sample is composed of Er, Yb, Bi, Na and F elements. When the reaction time was increased to 1.0 h, some short and imperfect hexagonal prismatic particles are formed (Fig. 5b). TEM image reveals that these prismatic products are actually polycrystalline, constructed by small particles (Fig. 6e). The holding time of 2.0 h reduced the these short and imperfect hexagonal prisms to evolve into the regular ones with the length of 200–500 nm and the diameter of 150–200 nm and convex end planes (Fig. 5c). When the reaction time was extended to 4 and 8, the hexagonal prisms continue to grow large while the small particles become less and less (Fig. 5d and e). As the reaction time elongated to 12 h, most of small nanoparticles disappeared and transformed to the hexagonal prismatic rods or plates (Fig. 5f). When the reaction time further extended to 24 h, these irregular nanoparticles depleted and converted to the hexagonal prismatic rods or plates (Fig. 2c). The above results reveal that the rod-like particles undergo dissolution–recrystallization transformation in order to minimize the surface energy of the system, and the h-NaBiF4 prisms grow along c-axis direction at the consumption of smaller nanoparticles by Ostwald ripening process.42
3.3 Formation mechanism
Herein we have experimentally and independently study the impacts of (1) the reaction time, (2) the reaction temperature, (3) the usage amount of NaF (4) the usage amount of NH4NO3 flux upon the resultant morphology and chemical composition. Based on the above results, a possible phase and morphology evolution mechanism is described as follows.At the beginning, Ln(NO3)3·5H2O (Ln = Bi, Yb and Er) and NaF are mixed with the desired amount of NH4NO3 salts to form a precursor, which then is reacted above the melting point to provide a fluid phase. Since the melting point of NH4NO3, Bi(NO3)3·5H2O, Yb(NO3)3·5H2O and Er(NO3)3·5H2O is less than 100 °C, they quickly melt, dissociate and form Bi3+, Yb3+, Er3+, NH4+ and NO3− ions during the heat-up process, whereas too high melting point of NaF (ca. 993 °C) cannot melt in such low experimental temperature, howbeit NaF can be partly dissolved to form Na+ and F− ions due to the existence of crystalliferous water. In addition, some Bi3+ ions tend to experience a hydrolysis process and generate BiO+ ions during warming-up process.
When the usage amount of F− is beyond the stoichiometric ratio of h-NaBiF4, Na+, Ln3+ (Ln = Bi, Yb, Er) and NH4+ ions in the molten salt interact with F− to generate m-NH4BiF4 and h-NaBiF4 small nuclei. If the number of F− ions can not exceed this ratio, the m-NH4BiF4 and c-BiF3 take precedence to produce in this molten-salt system. Additionally, those BiO+ ions react with F− ions and produce t-BiOF small nuclei. In thermodynamics, m-NH4BiF4 and t-BiOF are lower than h-NaBiF4 and c-BiF3, and susceptible to evolve inevitably to h-NaBiF4 and c-BiF3 seed through dissolution–renucleation process. These nuclei quickly aggregate together and grown into t-BiOF and h-NaBiF4 crystals. As the reaction temperature enhances and reaction time extends, the rate of transformation from m-NH4BiF4 and t-BiOF to h-NaBiF4 becomes larger, more m-NH4BiF4 and t-BiOF convert to h-NaBiF4 by dissolution–recrystallization process.
On the basis of the general theory of crystal growth, the growth crystal is relevant to the relative growth rate of different crystal faces. The different crystal rates give rise to diverse appearance of the crystalline. Since h-NaBiF4 micro-/nano-crystals have a hexagonal shape, their surfaces are typical (001) top/bottom planes and six prismatic side planes of the energetically equivalent (100) family. In this molten salt system, the growth rate on the c-axis in the crystal growth process is quicker than that on the directions perpendicular to c-axis, thereby the sample takes on the hexagonal prism. At the same time, the selective adhesion of some simple ions such as NH4+ ions and Na+ ions on some specific crystalline planes can change the epitaxial growth rate of different crystallographic direction.38 In our experimental surrounding, NH4+ or Na+ ions preferentially adsorb the (001) crystal plane and thereby remarkably prohibit the c-axis (i.e. [001]) directed growth, there is a tendency to shorten the length of prism. The observation of the concave structure at top/bottom facets suggests that the growth rate of the prismatic side facets is little faster than that of the top/bottom facets. These prism-like crystals exhibit the presence of some defects (such as holes and linear slits) on their side surfaces of these prisms, which may be reflected on the preferential 2D-nucleation at the border of the growing face. This behavior can be resulted form the morphological instability generated by the competition between the super-saturation (destabilizing factor) and the surface tension (stabilizing factor).43,44
3.4 Upconversion emission
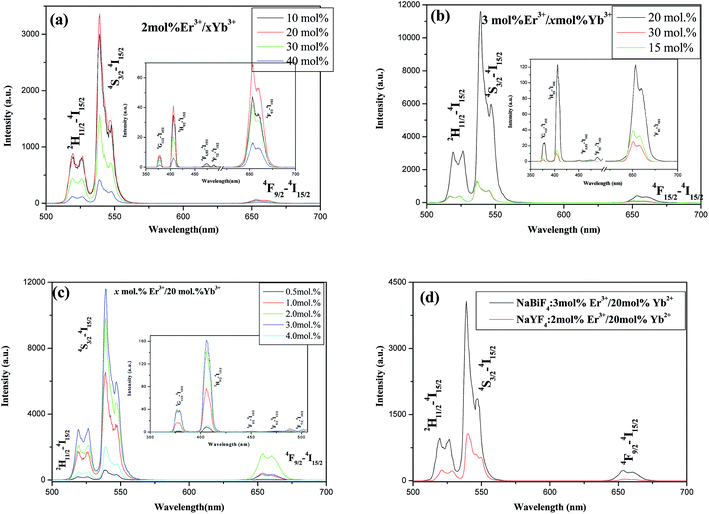
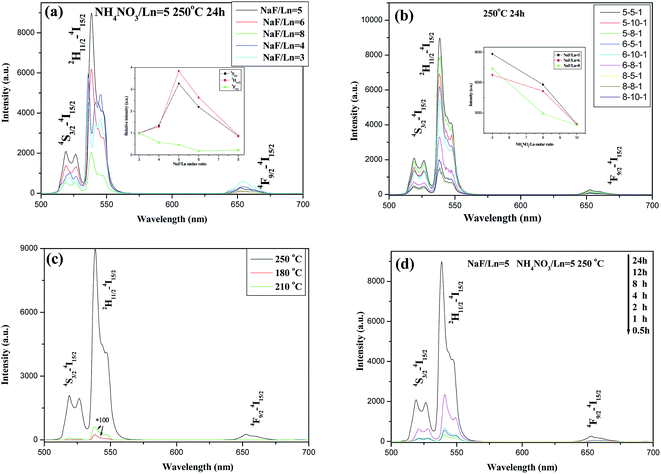
To study the effects of Er3+ and Yb3+ concentrations on the UC properties of h-NaBiF4:Er3+/Yb3+ products, Fig. 7 depicts the room temperature UC emission spectra of h-NaBiF4:Er3+/Yb3+ samples with different doping concentrations upon 980 nm excitation. The strong green UC emission band is observed in the region of 512–573 nm, attributed to the 2H11/2/4S3/2 → 4I15/2 transitions of Er3+. The red UC emission between 630–700 nm belongs to 4F9/2 → 4I15/2 transition of Er3+. It is striking that the predominant green emission is much stronger than the red emission. Thus, it can emit intense green light with high purity. Besides green and red UC emission, other weak UC emissions at 370–390, 400–428, and 445–460 nm, stem from the 4G11/2, 2H9/2, 4F3/2 and 4F5/2 states to the 4I15/2 ground state of Er3+,9–12 respectively. The UC emission in the range between 485 and 505 nm is attributed to the overlap of the cooperative UC of Yb3+,45–47 4F72–4I15/2 transition of Er3+ (ref. 9–12) and the 3P1–1S0 transition of Bi3+ ion14,15 (see Fig. 7a). It is clearly seen from Fig. 7a and b that the UC emission is strongly dependent upon the concentration of Er3+ and Yb3+ ions. In the samples with the constant Er3+ concentration (2 mol% and 3 mol%) the UC emission intensities except 4F7/2–4I15/2 UC emission increase as the Yb3+ concentration increases from 10 mol% to 20 mol%, and the maximum UC emission intensity appears at 20 mol% Yb3+ doping concentration. Then further increasing Yb3+ doping concentration (such as 30 mol%, 40 mol%) deduces the UC emission to fall (Fig. 7a and b). In similar fashion in the samples with the constant Yb3+ doping (20 mol%), the UC emission starts an upward trend as the Er3+ doping concentration increases from 0.5 mol% to 2 mol%, arrives at a peak at 3.0 mol% Er3+ doping concentration, then further increasing Er3+ concentration deduces to fall (see Fig. 7c). Thus, NaBiF4:3 mol% Er3+/20 mol% Yb3+ sample exhibits the strongest UC emission, and possesses stronger green UC emission about 4 times than hexagonal NaYF4:2 mol% Er3+/20 mol% Yb3+ nanocrystals under experimental condition (Fig. 7d). The size and morphology of the latter exhibit small conical hexagonal prisms with ca. 50 nm in diameter and 80–100 nm in length (see Fig. 7b and e in ref. 36).Fig. 8 shows the UC emission spectra of NaBiF4:3 mol% Er3+/20 mol% Yb3+ prepared under different conditions (including the reaction time, the reaction temperature, NaF/Ln and NH4NO3/Ln molar ratio). It can be seen that the UC emissions are similar in the line, and the only difference between these bands are their intensities. From the figure plugged in Fig. 8a, the as-obtained sample at the NaF/Ln molar ratio of 5 has the highest UC emission intensity, and the strong green emission can be observed under several mW 980 nm excitation. The samples prepared at the NaF/Ln molar ratio of 3 including c-BiF3 and t-BiOF possess the lowest UC intensity, whereas the NaF/Ln molar ratio of 4 leads to the formation of h-NaBiF4, thus substantially improving the intensity of UC emission. The resulting samples at the NaF/Ln molar ratio of 5, 6, and 8 exhibit prism with the almost large diameter (ca. 0.8 μm), their mean lengths become short. Similar to the hexagonal NaYF4:2 mol% Er3+/20 mol% Yb3+, the green UC emission gradually decreased as the NaF/Ln molar ratio increased from 5 through 6 to 8, that is to say, the larger the length of the prism is, the stronger the UC emission is (see Fig. 3 and Table 1).
In addition, the change of the NH4NO3 usage amount can alter UC emission intensities of the samples (Fig. 8b). For the fixed NaF/Ln molar ratio (5, 6 and 8, respectively), as NH4NO3/Ln molar ratio gradually increases, the UC emission intensity of the corresponding sample also gradually reduces (plugged in Fig. 8b). This can be also related to the morphology and size of the sample. The increase of NH4NO3/Ln molar ratio deduces the length of the rod to shorten, thereby the UC emission of the corresponding sample also decreases.
With the enhancing reaction temperature and elongating reaction time, the UC emission became stronger and stronger (Fig. 8c and d). As mentioned above, the higher reaction temperature and longer reaction time are favorable for the transition from m-NH4BiF4, t-BiOF to h-NaBiF4 in the molten salt procedure and the proportion of h-NaBiF4 increasing. Thus, the UC emission intensity of the samples is dramatically improved.
To determine the nature of the UC emission mechanisms responsible, we study the evolution of the intensities as a function of the pumping power for NaBiF4:3 mol% Er3+/20 mol% Yb3+ sample. The UC emission intensity I should scale as Pn at low power limit (far from the saturation), where n stands for the number of pumping phonons absorbed per UC phonon emitted and P represents the pump power.48–51 A plot of ln![[thin space (1/6-em)]](https://www.rsc.org/images/entities/char_2009.gif) I vs. ln
I vs. ln![[thin space (1/6-em)]](https://www.rsc.org/images/entities/char_2009.gif) P yields a straight line with the slope n. Fig. 9 shows the plots for 4G11/2, 2H9/2, 4F9/2 2H11/2, 4S3/2, 4F7/2 and emission. The slopes for 2H11/2 and 4S3/2 and are 1.70 and 1.61, respectively, which are close to 2, indicating that two-phonon process deal with the UC mechanism responsible for populating these emitting levels, whereas the slope for 4F9/2, 4G11/2 and 2H9/2 is 2.12, 2.4 and 2.18, respectively, implying that it is necessary to feed 4G11/2 and 2H9/2 level via three-phonon process. In addition, the slope for 2H11/2 and 4G11/2 is relatively larger than that for 4S3/2 and 2H9/2, indicating that a faster growth of the former than the latter. This can be resulted from the thermal effect. As the pump power increases to high enough, the strong absorption brings forth the enhancement of the sample temperature at the irradiated region, generating the thermal effect and the fluorescence quenching. The small energy gap of 2H11/2/4S3/2 and 4G11/2/2H9/2 pairs deduces more Er3+ ions to feed the 2H11/2 and 4G11/2 upper states via the thermal distribution as the pump power rise gradually. Therefore, the 2H11/2 and 4G11/2 state has a large slope n. In these samples, the predominant green emission in UC emission fluorescence indicates a larger population of the 2H11/2/4S3/2 level and a smaller population of the 4F9/2 level. In this case, the 2H11/2(Er3+1) + 4I15/2(Er3+2) → 4I9/2(Er3+1) + 4I13/2(Er3+2) cross relaxation between Er3+ and the 2F7/2(Yb3+) + S3/2(Er3+) → 2F5/2(Yb3+) + 4I13/2(Er3+)9–12,48–51 energy back transfer becomes important. As a result, two NIR excitation photons are used to feed the 4I13/2 state of Er3+. Since 4F9/2 level is populated from 4I13/2 through energy transfer between Er3+ and Yb3+. Consequently, the 4F9/2 population, and thus red emission becomes a three-photons process.
P yields a straight line with the slope n. Fig. 9 shows the plots for 4G11/2, 2H9/2, 4F9/2 2H11/2, 4S3/2, 4F7/2 and emission. The slopes for 2H11/2 and 4S3/2 and are 1.70 and 1.61, respectively, which are close to 2, indicating that two-phonon process deal with the UC mechanism responsible for populating these emitting levels, whereas the slope for 4F9/2, 4G11/2 and 2H9/2 is 2.12, 2.4 and 2.18, respectively, implying that it is necessary to feed 4G11/2 and 2H9/2 level via three-phonon process. In addition, the slope for 2H11/2 and 4G11/2 is relatively larger than that for 4S3/2 and 2H9/2, indicating that a faster growth of the former than the latter. This can be resulted from the thermal effect. As the pump power increases to high enough, the strong absorption brings forth the enhancement of the sample temperature at the irradiated region, generating the thermal effect and the fluorescence quenching. The small energy gap of 2H11/2/4S3/2 and 4G11/2/2H9/2 pairs deduces more Er3+ ions to feed the 2H11/2 and 4G11/2 upper states via the thermal distribution as the pump power rise gradually. Therefore, the 2H11/2 and 4G11/2 state has a large slope n. In these samples, the predominant green emission in UC emission fluorescence indicates a larger population of the 2H11/2/4S3/2 level and a smaller population of the 4F9/2 level. In this case, the 2H11/2(Er3+1) + 4I15/2(Er3+2) → 4I9/2(Er3+1) + 4I13/2(Er3+2) cross relaxation between Er3+ and the 2F7/2(Yb3+) + S3/2(Er3+) → 2F5/2(Yb3+) + 4I13/2(Er3+)9–12,48–51 energy back transfer becomes important. As a result, two NIR excitation photons are used to feed the 4I13/2 state of Er3+. Since 4F9/2 level is populated from 4I13/2 through energy transfer between Er3+ and Yb3+. Consequently, the 4F9/2 population, and thus red emission becomes a three-photons process.
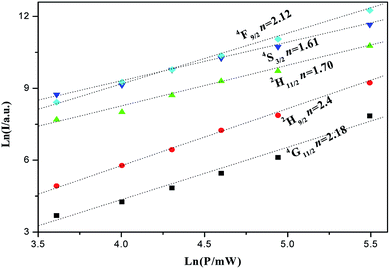 | ||
| Fig. 9 Logarithmic plot of the integrated UC emission intensity of h-NaBiF4:3 mol% Er3+/20 mol% Yb3+ sample at 295 K after 980 nm excitation. | ||
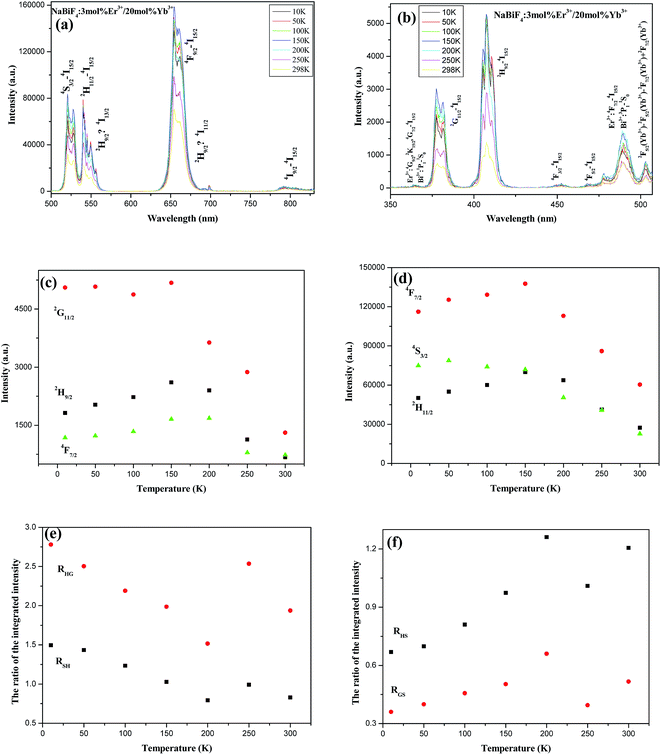
To investigate UC emission mechanism and study the temperature dependence UC characteristics, the UC emission spectra of NaBiF4:3 mol% Er3+/20 mol% Yb3+ at different temperatures under the excitation wavelength of 980 nm were depicted in Fig. 11a and b. The intensity of the UC emission band attributed to the 4S3/2 → 4I15/2 and 2H9/2 → 4I15/2 transition of Er3+ exhibits the same temperature dependent behaviors, which may be resulted from that the population on the 2H9/2 state of Er3+ can be excited from S3/2/2H11/2 state via the cross relaxation process of 4S3/2(Er3+1) + 4I13/2(Er3+2) → 2H9/2(Er3+1) + 4I15/2(Er3+2).9–12 They stay at the same level with increasing temperature from 10 to 150 K, then experience a significant downward trend. The other UC emissions exhibit another similar temperature dependent behavior. With decreasing temperature the emission intensities increase initially, reach a maximum at 150 K, and then decrease (Fig. 11c). The reduction in the emission can be resulted from the decrease in resonant transfer because of the thermal depopulation of the higher-energy 4I11/2 Er3+ levels, which has a resonant match with the 4F7/2 level. The decrease of emission intensity can be originated from the temperature dependence of the multi-phonon de-excitation of the 4S3/2(2H11/2) and 4F9/2 level. Since it is most likely for a relatively tightly coupled pair to transfer to a single ion is and such pairs have the probability to relax back to 4IJ levels again, the UC fluorescence quenching takes place. The fluorescence quenching becomes more effective than there occurs for the excitation into 4F7/2 of Er3+ aggravating the fluorescence quenching with increasing temperature. For 4F7/2, the emissions originating mainly from relatively isolated ions cause to reduce rate relaxation rate of ion-pair and to decrease the UC emission.49–54
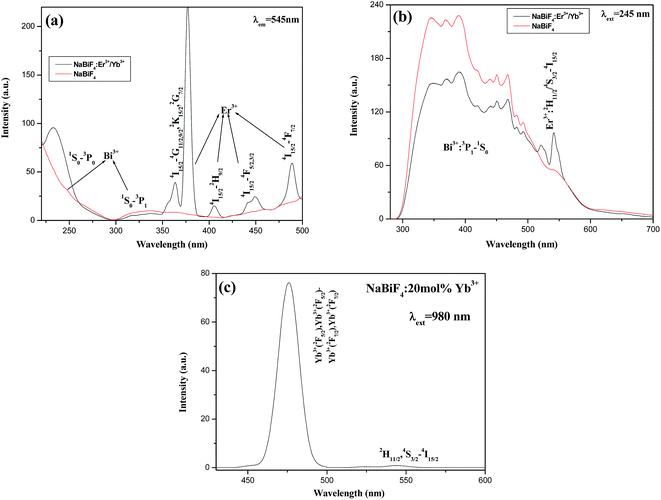 | ||
| Fig. 10 The excitation spectra (a) and emission spectra (b) of h-NaBiF4:3 mol% Er3+/20 mol% Yb3+ and pure h-NaBiF4; (c) the cooperative UC spectra of h-NaBiF4:20 mol% Yb3+. | ||
In order to better understand the temperature-dependent behavior, RHS (the ratio of 2H11/2 → 4I15/2 to 4S3/2 → 4I15/2) and RGH (the ratio of 4G11/2 → 4I15/2 to 2H9/2 → 4I15/2) as a function of temperature are shown as Fig. 11d, respectively. RHS and RGH possess the same temperature dependence characteristics. RHS and RGH firstly increase as the temperature enhances from 10 K to 200 K, then have a downward trend and hit rock bottom when the temperature increases to 250 K, finally recover to have an upward trend. Such phenomenon that the decreasing trend at 200–250 K indicates that there must be some additional UC channel energy transfers are involved with Yb3+ cooperative UC followed by the energy transfer to Bi3+, and the nonradiative energy transfer from the excited levels of Er3+ to the 3P1 manifold of Bi3+, followed by energy back energy to another manifolds of Er3+.
To authenticate the existence of energy transfer process between Bi3+ and Er3+, the excitation and emission spectra of NaBiF4:3 mol% Er3+/20 mol% Yb3+ and NaBiF4 have been measured and are depicted in Fig. 10. The excitation and emission wavelengths are 245 and 545 nm, respectively. In the excitation spectra (Fig. 10a), there exists broad absorption bands owing to Bi3+ ions,15–19 while some emission bands due to the transitions of Er3+ ions are also observed in the emission spectra (Fig. 10b),1–12 implying that the interaction between Bi3+ and Er3+ takes place. In addition, the anti-Stokes UC fluorescence spectra of NaBiF4:20 mol% Yb3+ samples under 980 nm excitation at room temperature was also shown in Fig. 10c. The observed anti-Stokes in the range of 470–510 nm is believed to be cooperative UC causing by the simultaneous radiative relaxation of the excited Yb3+–Yb3+ pairs accompanied by the emission of a visible photon in the expression 2F5/2(Yb3+)–2F5/2(Yb3+) → 2F7/2(Yb3+) + 2F7/2(Yb3+) + hν45–47 and the emission from the 3P1 excited state to the 1S0 ground state of Bi3+.14,15,22
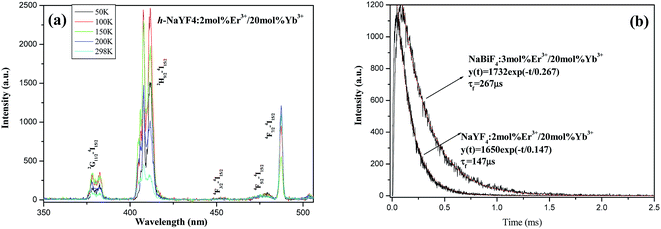
To further validate the rationality of the energy transfer from Bi3+ to Er3+, the UC emission spectra of NaYF4:2 mol% Er3+/20 mol% Yb3+ at different temperatures and the emission decay curves of 4S3/2 → 4I15/2 transition in h-NaBiF4:3 mol% Er3+/20 mol% Yb3+ (the former) and h-NaYF4:2 mol% Er3+/20 mol% Yb3+ (the latter) were measured under the excitation wavelength of 980 nm, as shown in Fig. 12. Both h-NaBiF4 and h-NaYF4 belong to the hexagonal system with the same space group P![[3 with combining macron]](https://www.rsc.org/images/entities/char_0033_0304.gif) , and the crystal cell parameter of h-NaBiF4 (a = 6.144 Å, c = 3.721 Å)32 is slightly larger than that of h-NaYF4 (a = 5.96 Å, c = 3.53 Å).55 In the same doping concentration, the mean distance between Yb3+ ions in the former is larger than that in the latter. The cooperative UC intensity depends upon the shortest distances between Yb3+ ions, and the smaller the distance between Yb3+ ions, the stronger the cooperative UC emission,45–47 thereby, the cooperative UC intensity of the former is weaker than that of the latter. As a matter of fact, the UC emission intensity of the former is stronger than that of the latter (see figure). It is suggested that there exists the energy transfer between Er3+ ion or Yb3+ ion and Bi3+ ion in h-NaBiF4:3 mol% Er3+/20 mol% Yb3+ sample. In addition, the decay curves of both the samples could be well fitted into a single exponential function (Fig. 12a). It is obvious that the lifetime of the 4S3/2 state in the former (267 μs) is longer than that in the latter (147 μs). Moreover, the former exhibits longer rise and delay times than the latter. This further affirms the existence of energy transfer between Er3+ ion and Bi3+ ions in h-NaBiF4:3 mol% Er3+/20 mol% Yb3+.
, and the crystal cell parameter of h-NaBiF4 (a = 6.144 Å, c = 3.721 Å)32 is slightly larger than that of h-NaYF4 (a = 5.96 Å, c = 3.53 Å).55 In the same doping concentration, the mean distance between Yb3+ ions in the former is larger than that in the latter. The cooperative UC intensity depends upon the shortest distances between Yb3+ ions, and the smaller the distance between Yb3+ ions, the stronger the cooperative UC emission,45–47 thereby, the cooperative UC intensity of the former is weaker than that of the latter. As a matter of fact, the UC emission intensity of the former is stronger than that of the latter (see figure). It is suggested that there exists the energy transfer between Er3+ ion or Yb3+ ion and Bi3+ ion in h-NaBiF4:3 mol% Er3+/20 mol% Yb3+ sample. In addition, the decay curves of both the samples could be well fitted into a single exponential function (Fig. 12a). It is obvious that the lifetime of the 4S3/2 state in the former (267 μs) is longer than that in the latter (147 μs). Moreover, the former exhibits longer rise and delay times than the latter. This further affirms the existence of energy transfer between Er3+ ion and Bi3+ ions in h-NaBiF4:3 mol% Er3+/20 mol% Yb3+.
Based on the above analysis, the energy diagram showing the proposed UC emission mechanism and energy transfer process in NaBiF4:Er3+/Yb3+ materials was depicted in Fig. 13. The initially increasing Yb3+ doping rapidly promotes the rate of energy transfer from Yb3+ to Er3+, enhancing the population on the green-emitting participating 4F7/2 and red-emitting participating 4I11/2 manifolds, which results in the improvement of the UC emission. Too high Yb3+ doping concentration induces an efficient energy back-transfer process 4F7/2(Er3+) + 2F5/2(Yb3+) → 4I11/2(Er3+) + 2F5/2(Yb3+)9–12 and 4F9/2(Er3+) + 2F5/2(Yb3+) → 4I13/2(Er3+) + 2F5/2(Yb3+),9–12 causing the decrease of the population on the 4F7/2, 4I11/2, 2H11/2/4S3/2 and 4F9/2 manifold, accordingly the green UC emission and red one both experiences a significant downward trend. At low Er3+ doping concentration, there are not enough Er3+ ions to be populated or excited. The increase of Er3+ concentration makes the average distance between Er3+ ions shrink and the interaction between ions intensifies. This induces the population on the 4F7/2, 4I11/2, 2H11/2, 4S3/2 and 4F9/2 states increase, and gives rise to the increase of the population on the green and red-emitting manifolds, thus, the red and green emission experiences an upward trend. When the Er3+ doping concentration achieves a certain crisis, the average interaction distance between Er3+ and Yb3+ is beyond the critical distance of the energy back transfer 4I11/2(Er3+) + 2F7/2(Yb3+) → 4I15/2(Er3+) + 2F5/2(Yb3+) (EBT),9–12 which leads to a considerate drop the population on the red-emitting 4F9/2 manifold and the green-emitting 2H11/2/4S3/2 and violet emitting 4G11/2 manifold. As a consequence, the intensity of the visible emission abruptly falls off, while the green one quickly rises. Obviously, 4 mol% exceeds the critical concentration, whereas 3 mol% is below this threshold.
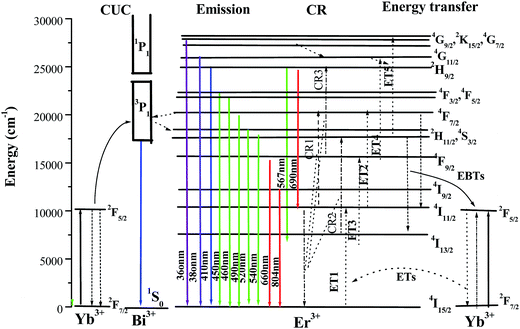 | ||
| Fig. 13 Schematic energy level diagrams of Bi3+, Er3+ and Yb3+ ions as well as the proposed energy transfer of NaBiF4:Er3+/Yb3+ under excitation of 980 nm. | ||
4. Conclusions
The hexagonal NaBiYF4:Er3+/Yb3+ micro-/nanocrystals were synthesized via low-temperature molten-salt method in NH4NO3 flux. The influences of the reaction time, the reaction temperature, the content of NaF and NH4NO3 on the crystal phase of the resulting products were studied at length. This research also investigates and discusses in detail the effects of shapes, sizes, doping concentration of Er3+ and Yb3+, the pumping power and the temperature on the UC emission of NaBiYF4:Er3+/Yb3+ micro-/nanocrystals. The results show that the NaBiF4:3 mol% Er3+/20 mol% Yb3+ sample exhibits the strongest UC emission and can be comparable to the most efficient UC hexagonal NaYF4:Er3+/Yb3+ micro-/nanocrystals. Two-phonon process takes responsibility to populate 4S3/2/2H11/2 of Er3+, whist the 4F9/2 is involved in a three-photon process. The energy transfer between the excited levels of Er3+ and the 3P1 manifold of Bi3+ and cooperative UC of Yb3+ are favorable to improve upconversion emission of Er3+. This work is significant not only to provide one novel synthesis method of Bi-based fluoride UC materials but also for the better understanding of their essential UC emission mechanisms (particularly the energy transfer from Bi3+ to Er3+).Conflicts of interest
There are no conflicts to declare.Acknowledgements
This work was supported by the National Natural Science Foundation of China (61204003), Train Object Program of Jiangxi Province Young Scientists, Natural Science Foundation of Jiangxi Province (No. 20142BAB206011 and 2011BAB206029) and Luodi program of Jiangxi Province (No. KJLD13030), respectively.References
- B. Zhou, B. Y. Shi and X. G. Liu, Nat. Nanotechnol., 2015, 10, 924 CrossRef CAS PubMed.
- M. Haase and H. Schäfer, Angew. Chem., Int. Ed., 2011, 50, 5808 CrossRef CAS PubMed.
- S. Y. Han, R. R. Deng, X. J. Xie and X. G. Liu, Angew. Chem., Int. Ed., 2014, 53, 2 CrossRef.
- G. Y. Chen, J. W. Seo, C. H. Yang and P. N. Prasad, Chem. Soc. Rev., 2013, 242, 8304 RSC.
- W. F. yang, X. Y. Li, D. Z. Chi, H. J. Zhang and X. G. Liu, J. Nanotechnol., 2015, 25, 482001 CrossRef PubMed.
- X. M. Li, F. Zhang and D. Y. Zhao, Chem. Soc. Rev., 2015, 44, 1346 RSC.
- X. D. Wang, O. S. Wolfbeis and R. J. Meier, Chem. Soc. Rev., 2013, 42, 7834 RSC.
- G. Y. Chen, H. L. Qiu, P. N. Parasad and X. Y. Chen, Chem. Rev., 2014, 110, 5161 CrossRef PubMed.
- W. Zhang, P. Huang, E. Ma, H. M. Zhu and X. Y. Chen, Chem. Soc. Rev., 2015, 44, 1379 RSC.
- H. Dong, L. D. Sun and C. H. Yan, Nanoscale, 2013, 5, 5657 RSC.
- L. P. Tu, X. M. Liu, F. Wu and H. Zhang, Chem. Soc. Rev., 2015, 44, 1331 RSC.
- H. Dong, L. D. Sun and C. H. Yan, Chem. Soc. Rev., 2015, 44, 1608 RSC.
- J. F. Suyver, J. Grimm, M. K. van Veen, D. Biner, K. W. Krämer and H. U. Güdel, J. Lumin., 2006, 117, 1 CrossRef CAS.
- P. Boutinaud, Inorg. Chem., 2013, 52, 6028 CrossRef CAS PubMed.
- R. H. P. Awater and P. Dorenbos, J. Lumin., 2017, 184, 221 CrossRef CAS.
- G. J. Gao, M. Y. Peng and L. Wondraczek, J. Mater. Chem. C, 2014, 2, 8085 Search PubMed.
- R. V. Yadav, R. S. Yadav, A. Bahadur and A. K. Singh, Inorg. Chem., 2016, 55, 10928 CrossRef CAS PubMed.
- A. Urbina-Frías, T. López-Luke, H. Desirena, P. Salas, A. Terres-Casatro and E. De la Rosa, Opt. Mater., 2015, 48, 92 CrossRef.
- M. Z. Yang, Y. Sui, S. C. Lü, M. J. Wang, X. J. Wang, M. H. Wu, Y. Wang, Y. T. Q. Lü and W. F. Liu, J. Alloys Compd., 2011, 509, 8590 CrossRef CAS.
- J. P. Fu, R. Pang, Y. L. Jia, W. Z. Sun, L. H. Jiang, S. Zhang and C. Y. Li, J. Lumin., 2017, 181, 240 CrossRef CAS.
- P. P. Lei, P. Zhang, S. Yao, S. Y. Song, L. L. Dong, X. Liu, X. L. Liu, K. M. Du, J. Feng and H. J. Zhang, ACS Appl. Mater. Interfaces, 2016, 8, 27490 CAS.
- N. Niu, F. He, S. L. Gai, C. X. Li, H. Huang and P. P. Yang, J. Mater. Chem., 2012, 22, 21613 RSC.
- K. J. Chong, T. Hirai, S. Hashimoto and N. Ohno, J. Lumin., 2017, 122–123, 149 Search PubMed.
- A. Escudero, E. Moretti and M. Ocaña, CrystEngComm, 2014, 16, 3274 RSC.
- J. M. Zhao, H. L. Pan, X. He, Y. S. Wang, L. Gu, Y. S. Hu, L. Q. Chen, H. Z. Liu and S. Dai, Nanoscale, 2013, 5, 518 RSC.
- W. B. Niu, S. L. Wu, S. F. Zhang, J. Li and L. Li, Dalton Trans., 2011, 40, 3305 RSC.
- H. X. Mai, Y. W. Zhang, L. D. Sun and C. H. Yan, J. Phys. Chem. C, 2007, 111, 13721 CAS.
- W. J. Yao, Q. Y. Tian, Z. H. Wu, S. Y. Cui, Z. G. Dai and W. Wu, J. Mater. Chem. C, 2016, 4, 6327 RSC.
- H. L. in, D. K. Xu, A. M. Li, D. D. Teng, S. H. Yang and Y. L. Zhang, J. Mater. Chem. C, 2015, 3, 11754 RSC.
- D. T. Klier and M. U. Kumke, J. Mater. Chem. C, 2015, 3, 11228 RSC.
- P. P. Lei, R. An, S. Yao, Q. S. Wang, L. L. Dong, K. M. Du, J. Feng and H. J. Zhang, Adv. Mater., 2017, 22, 00505 Search PubMed.
- P. Fedorov, et al., Russ. J. Inorg. Chem., 1979, 24, 157 Search PubMed.
- B. Shao, Z. W. Yang, Y. D. Wang, J. Li, J. Z. Yang, J. B. Qiu and Z. G. Song, ACS Appl. Mater. Interfaces, 2015, 7, 25211 CAS.
- J. Y. Liao, Z. W. Yang, H. J. Wu, D. Yan, J. B. Qiu, Z. G. Qiu, Y. Yang, D. C. Zhou and Z. Y. Yin, J. Mater. Chem. C, 2013, 1, 6541 RSC.
- S. L. Gai, C. X. Li, P. P. Yang and J. Lin, Chem. Rev., 2014, 114, 2343 CrossRef CAS PubMed.
- X. Y. Huang, G. H. Hu, Q. J. Xu, X. X. Li and Q. M. Yu, J. Alloys Compd., 2014, 616, 652 CrossRef CAS.
- X. Y. Huang, Opt. Mater. Express, 2014, 4, 2381 CrossRef CAS.
- X. Y. Huang, L. Jiang, X. X. Li and A. Q. He, J. Alloys Compd., 2017, 6721, 374 CrossRef.
- X. Y. Huang, Opt. Mater., 2015, 50, 81 CrossRef CAS.
- D. M. Mathews, R. B. Ambekar, K. A. Tyagi and J. Köhler, J. Alloys Compd., 2004, 377, 162–166 CrossRef.
- F. Zhang, Y. Wan, T. Yu, F. Q. Zhang, Y. F. Shi, S. H. Xie, Y. G. Li, L. Xu, B. Tu and D. Y. Zhao, Angew. Chem., Int. Ed., 2007, 46, 7976 CrossRef CAS PubMed.
- A. Naduviledathu Raj, T. Rinkel and M. Hasse, Chem. Mater., 2014, 26, 5689 CrossRef CAS.
- M. Y. Ding, C. H. Lu, L. H. Cao, Y. R. Ni and Z. Z. Xu, CrystEngComm, 2014, 4, 29165 Search PubMed.
- X. Qu, H. Song, X. Bai, G. Pan, B. Dong, H. Zhao, F. Wang and R. Qin, Inorg. Chem., 2008, 47, 9654 CrossRef CAS PubMed.
- E. Nakazawa and S. Shionoya, Phys. Rev. Lett., 1970, 25, 1710 CrossRef CAS.
- D. G. Deng, S. Q. Xu, R. Q. Bao, S. L. Zhao, B. L. Wang, H. P. Wang and H. D. Ju, J. Phys. D: Appl. Phys., 2009, 42, 105111 CrossRef.
- X. Y. Huang, Chin. Opt. Lett., 2010, 8, 780 CrossRef CAS.
- M. Pollnau, D. R. Gamelin, S. R. Lüthi, H. U. Güdel and M. P. Hehlen, Phys. Rev. B: Condens. Matter Mater. Phys., 2000, 61, 3337 CrossRef CAS.
- F. Vetrone, J. C. Boyer, J. A. Capobianco, A. Speghini and M. Bettinll, J. Appl. Phys., 2004, 96, 661 CrossRef CAS.
- J. F. Suyver, A. Aebisher, S. García-Revilla, P. Gerner and H. U. Güdel, Phys. Rev. B: Condens. Matter Mater. Phys., 2005, 71, 125123 CrossRef.
- J. P. van der Ziel, F. W. Ostermayer Jr and L. G. Van Uitert, Phys. Rev. B: Condens. Matter Mater. Phys., 1970, 2, 4432 CrossRef.
- K. Y. Wu, J. B. Cui, X. Kong and Y. J. Wang, J. Appl. Phys., 2011, 110, 053510 CrossRef.
- A. M. Pires and O. A. Serra, J. Appl. Phys., 2005, 98, 063529 CrossRef.
- D. D. Li, Q. Y. Shao, Y. Yan and J. J. Jiang, J. Phys. Chem. C, 2014, 118, 22807 CAS.
- Y. S. Liu, H. M. Zhu, R. F. Li, L. Q. Liu and X. Y. Chen, Angew. Chem., Int. Ed., 2013, 52, 1128 CrossRef PubMed.
| This journal is © The Royal Society of Chemistry 2017 |

