 Open Access Article
The preparation of fluorine-containing polysiloxane low-melting glass and its effect on the tracking resistance and thermostability of addition-cure liquid silicone rubber
Fengjiao Liu,
Xingrong Zeng *,
Xuejun Lai and
Hongqiang Li
College of Materials Science and Engineering, South China University of Technology, No 381, Wushan Road, Tianhe District, Guangzhou 510640, People's Republic of China. E-mail: psxrzeng@gmail.com; Fax: +86 20 8711 4248; Tel: +86 20 8711 4248
First published on 29th June 2017
Abstract
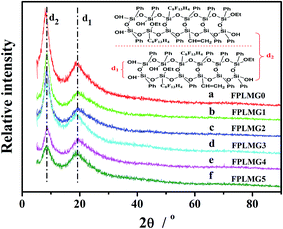
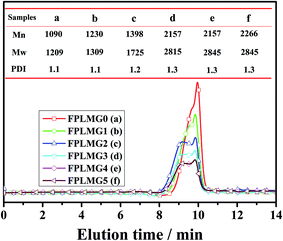
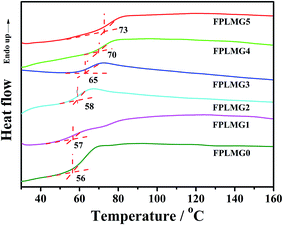
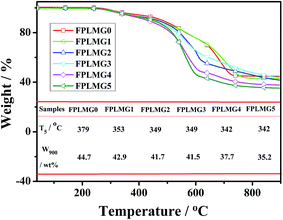
Fluorine-containing polysiloxane low-melting glass (FPLMG) was prepared by the hydrolysis-condensation of tridecafluorooctyltriethoxysilane (FAS), vinyltriethoxysilane (ViTES) and phenyltriethoxysilane (PhTES). FPLMG was characterized by Fourier transform infrared spectrometry (FTIR), nuclear magnetic resonance spectrometry (1H-NMR), X-ray diffraction (XRD), gel permeation chromatography (GPC), differential scanning calorimetry (DSC) and thermogravimetric analysis (TG). The effect of FPLMG with different FAS content on the mechanical and hydrophobic properties, tracking resistance and thermal stability of addition-cure liquid silicone rubber (ALSR) was investigated. The results showed that FPLMG had an amorphous ladder-like structure. The molecular weight and glass transition temperature of FPLMG increased with more addition of FAS. The tracking resistance and hydrophobicity of ALSR could be significantly enhanced by FPLMG. FPLMG formed a “glassy layer” on the surface of ALSR, which effectively improved the thermal stability of silicone rubber. Therefore, the tracking resistance of ALSR was enhanced because of the improvement of hydrophobicity and thermal stability of ALSR by FPLMG.
1. Introduction
Silicone rubber has excellent high and low temperature resistance, electrical insulation property, hydrophobicity and hydrophobicity recovery and so on. It is gradually replacing the traditional insulating materials, such as glass and porcelain, in high voltage transmission areas.1–6 However, the hydrophobicity of silicone rubber might be reduced or even lost owing to its exposure to elevated voltage level and environmental deterioration during long-term operation. The loss of surface hydrophobicity accelerated the deposition of contaminants in heavy wet weather. Once under the applied electric field, local electric field distribution would be altered by contaminants, which resulted in the formation of leakage current. The water on the surface of silicone rubber would evaporate under the influence of current joule heat, and then dry-band discharge was formed. These electrical discharges would lead to the concentration of a mass of heat, and then causing the thermal degradation of the silicone rubber. Consequently, the silicone rubber undergoes electrical tracking, destabilizing its electrical insulation property.7–10Nowadays, the common method to improve the tracking resistance of silicone rubber is the incorporation of inorganic anti-tracking additives, such as alumina trihydrate (ATH).11–13 However, high polarity of inorganic additives, poor compatibility between inorganic additives and silicone rubber, and heavy load for the desired tracking resistance would severely deteriorate the mechanical and hydrophobic properties of silicone rubber. Thus, it is extremely urgent to study one novel and efficient organic anti-tracking additive with excellent compatibility with silicone rubber. The frequently-used organic anti-tracking additives in our research group are the urea- or amino-containing siloxane,14,15 of which high polarity might reduce the hydrophobicity of silicone rubber. Therefore, it is of meaningfully significance for the application and development of silicone rubber to not only improve its tracking resistance but also retain its hydrophobic and mechanical properties.
Fluorinated modification can improve the hydrophobicity of silicone rubber because fluorine atoms have lower surface energy than silicone atoms.16–23 Besides, Du et al. found that fluorination could also dissipate the surface charge of room temperature vulcanized silicone rubber. The reason was that fluorine element had high electric negativity, which made the C–F bond highly polarized. The fluorinated layer would capture electrons once under the applied electric field. An inverse field was formed in the vicinity of anode, weakening the effective field between the electrode and sample.24 Therefore, introducing the fluorine element into silicone rubber might improve its hydrophobicity and tracking resistance.
In recent years, organic–inorganic hybrid low-melting glass also develops a new route for the anti-tracking additives of silicone rubber. Organic–inorganic hybrid low-melting glass, a novel organic–inorganic hybrid materials, is in transparent glassy state at room temperature, and can transform into fluid liquid at relative low temperature.25 It has applicable prospects in the improvement of the flame retardance, high temperature resistance, tracking and erosion resistance and other properties of polymer.26,27 Yu et al. introduced polysiloxane low-melting glass into epoxy composites, and found that polysiloxane low-melting glass would form a glassy protective layer when heated and significantly enhanced the ablative resistance and surface barrier properties of epoxy.26 Therefore, organically combining fluorine element and organic–inorganic low-melting glass would not only improve the hydrophobicity of silicone rubber and dissipate its surface charge, but also effectively barrier the transmission of heat and flammable gas by forming the “glassy layer” at high temperature. It might be favorable to enhance the tracking resistance property of silicone rubber and broaden its application. However, there were few reports about the incorporation of fluorine element into organic–inorganic hybrid low-melting glass and the application of organic–inorganic hybrid low-melting glass in silicone rubber.
In this work, fluorine-containing polysiloxane low-melting glass (FPLMG) was prepared by hydrolysis-condensation of tridecafluorooctyltriethoxysilane (FAS), vinyltriethoxysilane (ViTES) and phenyltriethoxysilane (PhTES) via one-step hydrochloric acid catalyzed sol–gel method. FPLMG was characterized by Fourier transform infrared spectrometry (FTIR), nuclear magnetic resonance spectrometry (1H-NMR), X-ray diffraction (XRD), gel permeation chromatography (GPC), differential scanning calorimetry (DSC) and thermogravimetric analysis (TGA). The effect of FPLMG with different FAS content on the tracking resistance, mechanical property, hydrophobicity and thermal stability of addition-cure liquid silicone rubber (ALSR) was investigated.
2. Experimental
2.1 Materials
Tridecafluorooctyltriethoxysilane (FAS) was obtained from Evonik Industries Group, Germany. Phenyltriethoxysilane (PhTES) was purchased from Hubei Jianghan Fine Chemical Co., Ltd., China. Vinyltriethoxysilane (ViTES) was supplied by Qufu Chenguang Chemical Co., Ltd., China. Toluene and hydrochloric acid were obtained from Guangzhou Chemical Reagent Factory, China. Ethanol was purchased from Tianjin Fuyu Fine Chemical Co., Ltd., China. Vinyl-terminated poly(dimethylsiloxanes) (VPDMS, viscosity was 24![[thin space (1/6-em)]](https://www.rsc.org/images/entities/char_2009.gif) 320 mPa s and vinyl content was 0.28 wt%) was obtained from Midgold Fine Performance Materials Co., Ltd., China. Poly(hydromethylsiloxane) (PHMS, vinyl content was 0.75 wt%) was purchased from Shandong Dayi Chemical Co., Ltd., China. 1-Ethynylcyclohexanol, Karstedt's catalyst (platinum content was 2000 ppm) and poly(dimethylsiloxanes) with high vinyl content (viscosity was 2095 mPa s and vinyl content was 8.7 wt%) were supplied by Guangzhou Tinci Silicon Technology Co., Ltd., China. Fumed silica (SiO2, QS-25, specific surface area was 250 m2 g−1) was obtained from Tokuyama Corp, Japan. Hexamethyldisilazane (HMDS) was purchased from Jilin Xinya Qiangshengwu Chemical Co., Ltd., China. Distilled water was prepared by our laboratory.
320 mPa s and vinyl content was 0.28 wt%) was obtained from Midgold Fine Performance Materials Co., Ltd., China. Poly(hydromethylsiloxane) (PHMS, vinyl content was 0.75 wt%) was purchased from Shandong Dayi Chemical Co., Ltd., China. 1-Ethynylcyclohexanol, Karstedt's catalyst (platinum content was 2000 ppm) and poly(dimethylsiloxanes) with high vinyl content (viscosity was 2095 mPa s and vinyl content was 8.7 wt%) were supplied by Guangzhou Tinci Silicon Technology Co., Ltd., China. Fumed silica (SiO2, QS-25, specific surface area was 250 m2 g−1) was obtained from Tokuyama Corp, Japan. Hexamethyldisilazane (HMDS) was purchased from Jilin Xinya Qiangshengwu Chemical Co., Ltd., China. Distilled water was prepared by our laboratory.
2.2 Preparation of fluorine-containing polysiloxane low-melting glass
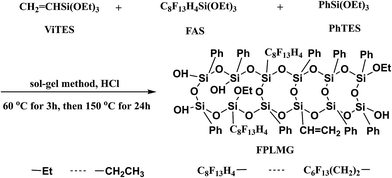
Fluorine-containing polysiloxane low-melting glass (FPLMG) was prepared by one-step hydrochloric acid catalyzed sol–gel method. A certain amount of tridecafluorooctyltriethoxysilane (FAS) (shown as Table 1), 0.12 mol vinyltriethoxysilane (ViTES) and 0.88 mol phenyltriethoxysilane (PhTES) diluted with 4.3 mol ethanol in 150 mL constant pressure funnel were added dropwise to a mixture of 5.7 mol ethanol, 3 mol H2O and 0.1 mol HCl in 250 mL four-neck flask with reflux apparatus under stirring at 30 °C. Then the mixture was heated up to 60 °C and reacted for 3 h. To increase the reaction degree, the mixture was further heated up to 150 °C and kept for 24 h. The ethanol was removed by rotary evaporation under reduced pressure, and then fluorine-containing polysiloxane low-melting glass (FPLMG) was obtained. The synthetic diagram of FPLMG is shown in Fig. 1.| Samples | FPLMG0 | FPLMG1 | FPLMG2 | FPLMG3 | FPLMG4 | FPLMG5 |
|---|---|---|---|---|---|---|
| MFAS/mol% | — | 1.70 | 3.90 | 5.70 | 7.40 | 10.7 |
2.3 Preparation of ALSR samples
100 phr VPDMS, 6.8 phr HMDS, 40 phr SiO2 and 2 phr poly(dimethylsiloxanes) with high vinyl content were mixed uniformly in stirring kneader, and then 1.9 phr PHMS, 0.06 phr 1-ethynylcyclohexanol, 3 phr FPLMG and 15 ppm Karstedt's catalyst were sequentially added to the mixture. Afterwards the mixture was vulcanized for 10 min at 120 °C, and then vulcanized again for 1 h at 150 °C. The codes of ALSR samples are listed in Table 2 according to the different kinds of FPLMG added into silicone rubber.| Samples | N-SR | FS-0 | FS-1 | FS-2 | FS-3 | FS-4 | FS-5 |
|---|---|---|---|---|---|---|---|
| Kind of FPLMG | — | FPLMG0 | FPLMG1 | FPLMG2 | FPLMG3 | FPLMG4 | FPLMG5 |
2.4 Characterization
3. Results and discussion
3.1 Characterization of FPLMG
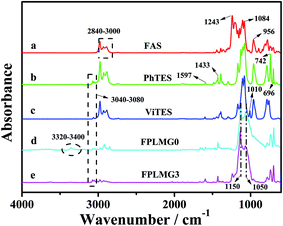
![[double bond, length as m-dash]](https://www.rsc.org/images/entities/char_e001.gif) CH2 in ViTES.29 For FPLMG0 in Fig. 3(d), there was distinct peak separation at 1050 cm−1 and 1150 cm−1 after the reaction of PhTES and ViTES, which were assigned to the symmetrical and asymmetrical stretching vibration of Si–O–Si, respectively.30 The distinctly characteristic peak of –CH
CH2 in ViTES.29 For FPLMG0 in Fig. 3(d), there was distinct peak separation at 1050 cm−1 and 1150 cm−1 after the reaction of PhTES and ViTES, which were assigned to the symmetrical and asymmetrical stretching vibration of Si–O–Si, respectively.30 The distinctly characteristic peak of –CH![[double bond, length as m-dash]](https://www.rsc.org/images/entities/char_e001.gif) CH2 did not appear owing to the low content of vinyl groups and the overlap peaks of Si–O–Si at 1000–1150 cm−1 and C–H of –CH
CH2 did not appear owing to the low content of vinyl groups and the overlap peaks of Si–O–Si at 1000–1150 cm−1 and C–H of –CH![[double bond, length as m-dash]](https://www.rsc.org/images/entities/char_e001.gif) CH2 at 1010 cm−1. The bands located at 742 cm−1 and 696 cm−1 attributed to the out-of-plane bending vibration of C–H of Si–C6H5 appeared, which demonstrated that ViTES and PhTES were successfully condensed. There were characteristic peaks of –OCH2CH3 and –OH at 2840–3000 cm−1 and 3320–3400 cm−1, respectively, indicating that ethyoxyl and hydroxy groups still existed in PhLMG0. For FPLMG3 in Fig. 3(e), after FAS, PhTES and ViTES were reacted, the band at 1243 cm−1 attributed to the stretching vibration of C–F appeared, and other characteristic peaks were similar to those of FPLMG0, which manifested that fluorine-containing polysiloxane low-melting glass was successfully prepared.
CH2 at 1010 cm−1. The bands located at 742 cm−1 and 696 cm−1 attributed to the out-of-plane bending vibration of C–H of Si–C6H5 appeared, which demonstrated that ViTES and PhTES were successfully condensed. There were characteristic peaks of –OCH2CH3 and –OH at 2840–3000 cm−1 and 3320–3400 cm−1, respectively, indicating that ethyoxyl and hydroxy groups still existed in PhLMG0. For FPLMG3 in Fig. 3(e), after FAS, PhTES and ViTES were reacted, the band at 1243 cm−1 attributed to the stretching vibration of C–F appeared, and other characteristic peaks were similar to those of FPLMG0, which manifested that fluorine-containing polysiloxane low-melting glass was successfully prepared.
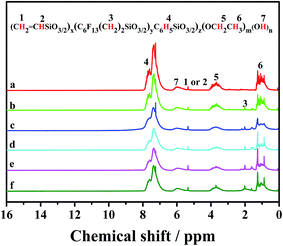
![[H with combining low line]](https://www.rsc.org/images/entities/char_0048_0332.gif) 5 and –O
5 and –O![[H with combining low line]](https://www.rsc.org/images/entities/char_0048_0332.gif) , respectively. The signals of the protons of –C
, respectively. The signals of the protons of –C![[H with combining low line]](https://www.rsc.org/images/entities/char_0048_0332.gif)
![[double bond, length as m-dash]](https://www.rsc.org/images/entities/char_e001.gif) CH2 and –CH
CH2 and –CH![[double bond, length as m-dash]](https://www.rsc.org/images/entities/char_e001.gif) C
C![[H with combining low line]](https://www.rsc.org/images/entities/char_0048_0332.gif) 2 were located at 5.2–5.4 ppm. The protons of –C
2 were located at 5.2–5.4 ppm. The protons of –C![[H with combining low line]](https://www.rsc.org/images/entities/char_0048_0332.gif) 2CH3 and –CH2C
2CH3 and –CH2C![[H with combining low line]](https://www.rsc.org/images/entities/char_0048_0332.gif) 3 had the characteristic signals at 3.2–4.0 ppm and 0.5–1.5 ppm, respectively. It was demonstrated that PhTES and ViTES were successfully condensed, and there still existed ethyoxyl and hydroxy groups in FPLMG0. As shown in Fig. 4(b)–(f), after PhTES, ViTES and FAS were reacted, the characteristic signal at 1.5 ppm of the protons of –CF2CH2CH2– appeared, of which relative intensity intensified with the increase of FAS content. Other signals were similar to the ones as shown in Fig. 4(a). It was also indicated that fluorine-containing polysiloxane low-melting glass was successfully obtained.
3 had the characteristic signals at 3.2–4.0 ppm and 0.5–1.5 ppm, respectively. It was demonstrated that PhTES and ViTES were successfully condensed, and there still existed ethyoxyl and hydroxy groups in FPLMG0. As shown in Fig. 4(b)–(f), after PhTES, ViTES and FAS were reacted, the characteristic signal at 1.5 ppm of the protons of –CF2CH2CH2– appeared, of which relative intensity intensified with the increase of FAS content. Other signals were similar to the ones as shown in Fig. 4(a). It was also indicated that fluorine-containing polysiloxane low-melting glass was successfully obtained.
3.2 Effect of FPLMG on the mechanical properties of ALSR
Table 3 presents the effect of FPLMG with different FAS content on the mechanical properties of ALSR. The mechanical properties of ALSR were obviously enhanced by FPLMG, especially for the tear strength of ALSR. The tear strength of ALSR with FPLMG was improved as FAS content increased. The tear strength of FS-3 was enhanced by 24.5% when compared with N-SR. It might be because that there were vinyl groups in FPLMG which contributed to the formation of concentrated crosslinking network by reacting with PHMS. More stress could be dispersed into the crosslinking network. Moreover, as discussed in Fig. 6, the molecular weight of FPLMG increased with more content of FAS. Therefore, stress would be dispersed into the concentrated crosslinking with higher molecular weight, which was favorable to the improvement of mechanical properties of ALSR.| Samples | N-SR | FS-0 | FS-1 | FS-2 | FS-3 | FS-4 | FS-5 |
|---|---|---|---|---|---|---|---|
| Tensile strength/MPa | 8.5 ± 0.2 | 8.6 ± 0.1 | 8.7 ± 0.2 | 8.8 ± 0.1 | 8.8 ± 0.2 | 9.1 ± 0.3 | 9.2 ± 0.2 |
| Elongation at break/% | 613 ± 15 | 620 ± 18 | 623 ± 20 | 632 ± 24 | 650 ± 23 | 651 ± 15 | 651 ± 20 |
| Tear strength/kN m−1 | 33.5 ± 0.2 | 40.2 ± 0.4 | 40.7 ± 0.3 | 41.3 ± 0.5 | 41.7 ± 0.1 | 41.8 ± 0.2 | 41.8 ± 0.2 |
| Hardness/Shore A | 39 ± 1 | 41 ± 2 | 42 ± 2 | 43 ± 1 | 43 ± 2 | 44 ± 1 | 44 ± 2 |
3.3 Effect of FPLMG on tracking resistance of ALSR
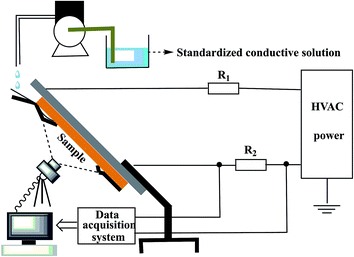
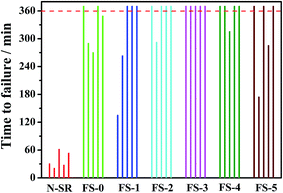
The effect of FPLMG with different FAS content on the tracking resistance of ALSR is showed in Fig. 9. As shown in Fig. 9, the tracking resistance of N-SR was poor, and five parallel specimens failed within 1 h. When the FAS content increased, the tracking resistance property of ALSR with FPLMG, such as FS-0, FS-1 and FS-2, was effectively enhanced, where two, three, four out of five specimens was through 6 h IP test. ALSR with FPLMG3, FS-3 sample, successfully passed 6 h IP test. However, ALSR samples, such as FS-4 and FS-5, did not pass 6 h IP test when FAS content was too high in FPLMG.3.4 Suppression mechanism of FPLMG on the tracking resistance of ALSR
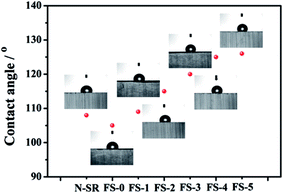
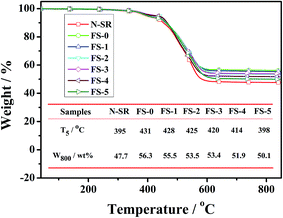
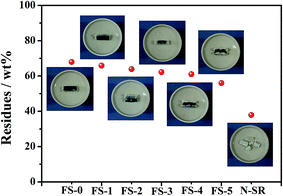
In the long-term operation of silicone rubber in high voltage transmission areas, the loss of hydrophobicity of silicone rubber led to the massive deposition of contaminants. The leakage current on the surface of silicone rubber dramatically increased under the applied electric field, and then arc discharge was formed. The thermal degradation of silicone rubber was caused by the heat concentration owing to the repeated discharge. Consequently, silicone rubber happened to electrical tracking. As can be seen, the tracking resistance property of silicone rubber had connections with its hydrophobicity and thermal stability. Therefore, to clarify the suppression mechanism of FPLMG on the tracking resistance of ALSR, hydrophobicity and thermal stability of ALSR samples were analyzed as follows.To further investigate the effect of FPLMG with different FAS content on the thermal stability of ALSR, ALSR samples were treated with muffle furnace at 800 °C for 10 min. The residue and surface topography of each sample were studied. As shown in Fig. 12, the residue of N-SR after treated at 800 °C for 10 min was so brittle as to be easily cracked, and the inner and external surfaces of residues turned white. After adding FPLMG, the residual content of ALSR apparently increased and, moreover, the residues, of which the inside was charred into black, were hard and compact. The reason was that a densely glassy layer on the surface of ALSR was formed by FPLMG at high temperature, which improved the ablative resistance and surface barrier effect of ALSR. Therefore, the inner of ALSR with absence of oxygen was charred into black. Fig. 12 also presented that the residual content of ALSR at 800 °C decreased with the increase of FAS content in FPLMG. The residues of ALSR, such as FS-4 and FS-5, were cracked when the FAS content was too high. It could be explained that as shown in Fig. 8, the thermal stability of FPLMG decreased with more content of FAS, which resulted in the destruction of glassy layer formed by FPLMG. Therefore, the residues of ALSR with FPLMG were easily cracked when FAS content was too high.
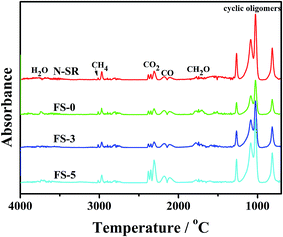 | ||
| Fig. 13 FTIR spectra of total volatile gases analyzed from 3D spectra of TG-FTIR during the thermal decomposition of ALSR samples (air, 20 K min−1). | ||
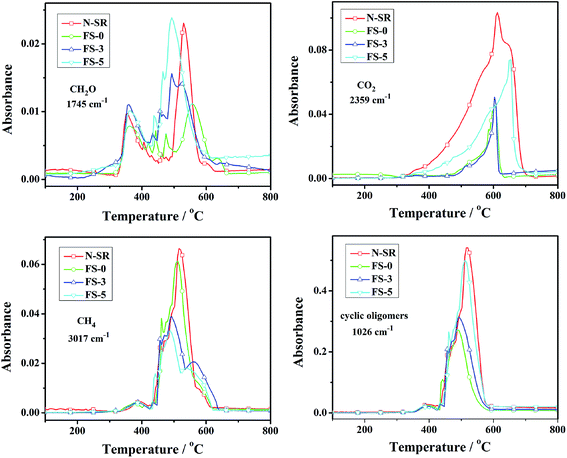
Fig. 14 presents the FTIR absorbance vs. temperature curves of pyrolysis products of ALSR in air atmosphere. As for N-SR, the main pyrolysis products were carbonyl compound and CO2 below 400 °C, indicating that there were mainly the oxidative breakage and degradation of side methyl groups for N-SR below 400 °C. When temperature was elevated, N-SR primarily happened to bond scission of side methyl groups and thermal degradation of backbone, which resulted in the formation of large amount of methane and cyclic oligomers. The relative intensities of CH4, CO2 and cyclic oligomers of ALSR with FPLMG were lower than those of N-SR, while the intensity of carbonyl compound was higher than that of N-SR except for FS-0. Moreover, the relative intensities of CO2, carbonyl compound and cyclic oligomers increased with more FAS content in FPLMG, while the relative intensity of CH4 decreased as FAS content increased. It was demonstrated that, as illustrated in Fig. 12, the densely glassy layer on the surface of ALSR was formed by FPLMG with low FAS content, which hindered oxygen and heat from penetrating into the inside of matrix. Therefore, the main pyrolysis products were CH4 produced from bond scission of side methyl groups and cyclic oligomers generated from thermal degradation of backbone. While thermal stability of FPLMG decreased with high FAS content, and the glassy layer on the surface of ALSR was easily cracked. Therefore, there were primarily carbonyl compound and CO2 caused by oxidative degradation of side methyl groups and cyclic oligomers caused by thermal degradation of backbone. Overall, the thermal stability of ALSR was effectively improved by suppressing the thermal degradation of backbone.
All in all, in combination with above discussion about the effect of FPLMG on hydrophobicity and thermal stability of ALSR, it might be thought that the tracking resistance of ALSR was enhanced by means of the improvement of hydrophobicity and thermal stability of ALSR. On one hand, hydrophobicity of ALSR was improved because of the incorporation of fluorine element, diminishing the deposition of contamination on the surface of ALSR. Meanwhile, surface charge could also be suppressed by fluorine.24 On the other hand, a glassy layer on the surface of ALSR was formed by FPLMG with appropriate FAS content at high temperature generated from arc discharge. It could hinder heat and flammable gas from transmitting into the inside of ALSR, and the thermal stability of ALSR was effectively improved. Therefore, the tracking resistance of ALSR was enhanced by FPLMG with proper FAS content.
4. Conclusions
In this work, fluorine-containing polysiloxane low-melting glass (FPLMG) was prepared by hydrolysis-condensation of tridecafluorooctyltriethoxysilane (FAS), vinyltriethoxysilane (ViTES) and phenyltriethoxysilane (PhTES) via one-step hydrochloric acid catalyzed sol–gel method. FPLMG had amorphous ladder-like structure, and was in glassy state at room temperature. The molecular weight and glass transition temperature of FPLMG increased with more addition of FAS. And the tracking resistance and mechanical properties of ALSR were effectively enhanced by FPLMG. ALSR/FPLMG specimens successfully passed 6 h IP test when FAS content was 5.7 mol%. The hydrophobicity of ALSR with FPLMG was also improved with more content of FAS. TG, TG-FTIR and high temperature heat treatment demonstrated that FPLMG could significantly improve the thermal stability of ALSR because of the enhancement of ablative resistance and surface barrier effect of ALSR by forming a dense and compact glassy layer. Therefore, the tracking resistance of ALSR with FPLMG was enhanced by means of the improvement of hydrophobicity and thermal stability of ALSR.Acknowledgements
This work was supported by the National Natural Science Foundation of China (No. 51573052 and No. 51403067), the Guangzhou Science and Technology Plan Project (201604010056) and the Pearl River S&T Nova Program of Guangzhou (201710010062).Notes and references
- L. Meyer, S. Jayaram and E. A. Cherney, IEEE Trans. Dielectr. Electr. Insul., 2004, 11, 620–630 CrossRef CAS.
- S. H. Kim, E. A. Cherney, R. Hackam and K. G. Rutherford, IEEE Trans. Dielectr. Electr. Insul., 1994, 1, 106–123 CrossRef CAS.
- R. A. Ghunem, S. H. Jayaram and E. A. Cherney, IEEE Elect. Insul. Mag., 2015, 31, 12–21 CrossRef.
- W. J. Chen, X. R. Zeng, X. J. Lai, H. Q. Li, W. Z. Fang and F. Hou, ACS. Appl. Mater. Interfaces, 2016, 8, 21039–21045 CAS.
- Y. H. Shi, X. X. Gao, D. Zhang, Y. F. Liu and G. S. Huang, RSC Adv., 2014, 4, 41453–41460 RSC.
- D. Ghosh, S. Bhandari, T. K. Chaki and D. Khastqir, RSC Adv., 2015, 5, 57608–57618 RSC.
- S. A. Seyedmehdi, H. Zhang and J. Zhu, Appl. Surf. Sci., 2012, 258, 2972–2976 CrossRef CAS.
- K. Siderakis, D. Agoris and S. M. Gubanski, IEEE Trans. Power Del., 2008, 23, 2270–2277 CrossRef.
- X. D. Liang, S. W. Wang, J. Fan and Z. C. Guan, IEEE Trans. Dielectr. Electr. Insul., 1999, 6, 586–594 CrossRef CAS.
- L. E. Schmidt, X. Kornmann, A. Krivda and H. Hillborg, IEEE Trans. Dielectr. Electr. Insul., 2010, 17, 533–540 CrossRef CAS.
- B. Venkatesulu and M. J. Thomas, IEEE Trans. Dielectr. Electr. Insul., 2010, 17, 615–624 CrossRef CAS.
- S. Ansorge, F. Schmuck and K. O. Papailiou, IEEE Trans. Dielectr. Electr. Insul., 2015, 22, 979–989 CrossRef CAS.
- R. A. Ghunem, S. H. Jayaram and E. A. Cherney, IEEE Trans. Dielectr. Electr. Insul., 2015, 22, 14–20 CrossRef CAS.
- W. Z. Fang, X. J. Lai, H. Q. Li, W. J. Chen, X. R. Zeng, L. P. Zhang and S. G. Yang, Polym. Test., 2014, 37, 19–27 CrossRef CAS.
- W. J. Chen, X. R. Zeng, X. J. Lai, H. Q. Li, W. Z. Fang and T. Liu, Thermochim. Acta, 2016, 632, 1–9 CrossRef CAS.
- Z. L. An, Q. Q. Yin, H. H. Xiao, D. L. Xie, F. H. Zheng, Q. Q. Lei and Y. W. Zhang, IEEE Trans. Dielectr. Electr. Insul., 2015, 22, 1124–1133 CrossRef CAS.
- Y. Q. Liu, Z. L. An, Q. Q. Yin, F. H. Zheng, Q. Q. Lei and Y. W. Zhang, IEEE Trans. Dielectr. Electr. Insul., 2013, 20, 1859–1868 CrossRef CAS.
- B. X. Du, J. Li, H. Du and Y. Yin, IEEE Trans. Dielectr. Electr. Insul., 2014, 21, 1817–1823 CrossRef CAS.
- B. X. Du, J. Li and W. Du, IEEE Trans. Dielectr. Electr. Insul., 2013, 20, 947–995 CrossRef CAS.
- Y. J. Jiang, L. Li, J. P. Liu, R. Wang, H. S. Wang, Q. Tian and X. Y. Li, J. Fluorine Chem., 2016, 183, 82–91 CrossRef CAS.
- S. H. Gao, M. K. Lei, Y. Liu and L. S. Wen, Appl. Surf. Sci., 2009, 255, 6017–6023 CrossRef CAS.
- S. R. Coulson, I. S. Woodward, S. A. Brewer, C. Willis and J. P. S. Badyal, Chem. Mater., 2000, 12, 2031–2038 CrossRef CAS.
- D. X. Han, L. Q. Zhu, Y. C. Chen, W. P. Li, X. M. Wang and L. Ning, RSC Adv., 2015, 5, 22847–22855 RSC.
- B. X. Du, Z. L. Li and J. Li, IEEE Trans. Dielectr. Electr. Insul., 2014, 21, 2338–2342 CrossRef CAS.
- H. Masai, M. Takahashi, Y. Tokuda and T. Yoko, J. Mater. Res., 2005, 20, 1234–1241 CrossRef CAS.
- D. Yu, M. Kleemeier, G. M. Wu, B. Schartel, W. Q. Liu and A. Hartwig, Polymer, 2011, 52, 2120–2131 CrossRef CAS.
- D. Yu, M. Kleemeier, G. M. Wu, B. Schartel, W. Q. Liu and A. Hartwig, Polym. Degrad. Stab., 2011, 96, 1616–1624 CrossRef CAS.
- Z. L. An, H. H. Xiao, F. L. Liu, F. H. Zheng, Q. Q. Lei and Y. W. Zhang, IEEE Trans. Dielectr. Electr. Insul., 2016, 23, 2278–2287 CrossRef.
- W. Z. Fang, X. R. Zeng, X. J. Lai, H. Q. Li, W. J. Chen and Y. J. Zhang, Thermochim. Acta, 2015, 605, 28–36 CrossRef CAS.
- M. Unno, A. Suto and T. Matsumoto, Russ. Chem. Rev., 2013, 82, 289–302 CrossRef.
- Z. X. Zhang, J. Hao, P. Xie, X. Zhang, C. C. Han and R. Zhang, Chem. Mater., 2008, 20, 1322–1330 CrossRef CAS.
- S. S. Choi, H. S. Lee, S. S. Hwang, D. H. Choi and K. Y. Baek, J. Mater. Chem., 2011, 20, 9852–9854 RSC.
- C. Q. Liu, H. T. Zhao, P. Xie and R. B. Zhang, Polym. Chem., 1999, 38, 2702–2710 CrossRef.
- C. Liu, Y. L. Liu, Z. R. Shen, S. P. Xie, R. B. Zhang, Z. J. Yang and F. L. Bai, Macromol. Chem. Phys., 2001, 202, 1581–1585 CrossRef CAS.
- A. Kowalewska, M. Nowacka and T. Makowski, eXPRESS Polym. Lett., 2015, 9, 984–1000 CrossRef CAS.
| This journal is © The Royal Society of Chemistry 2017 |

